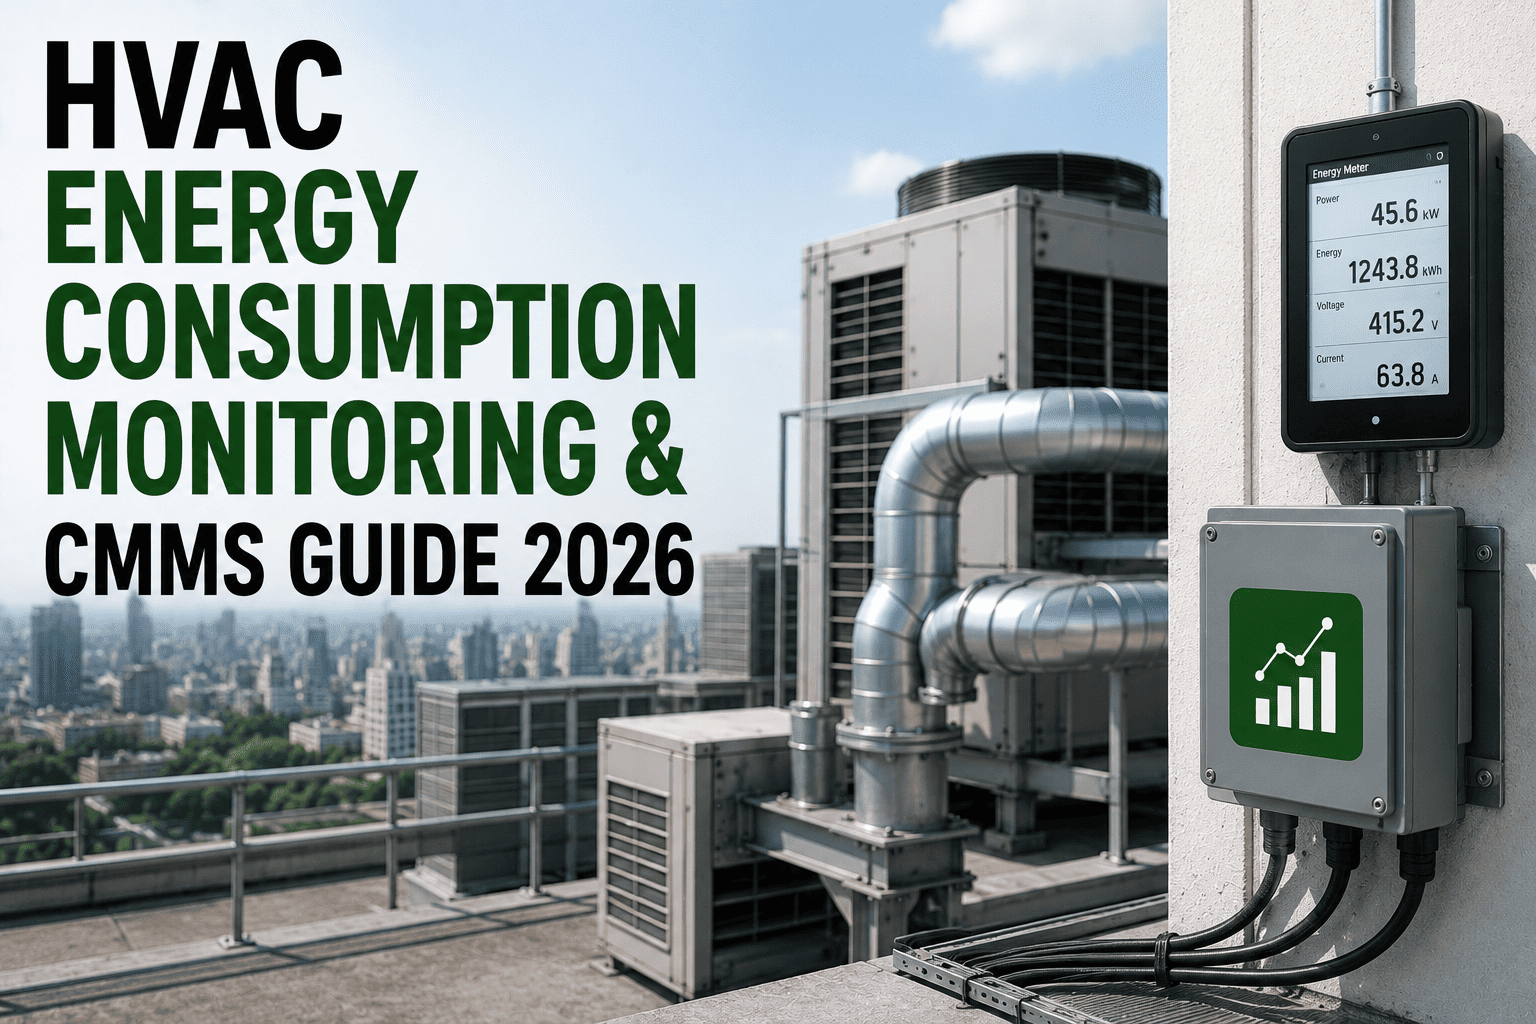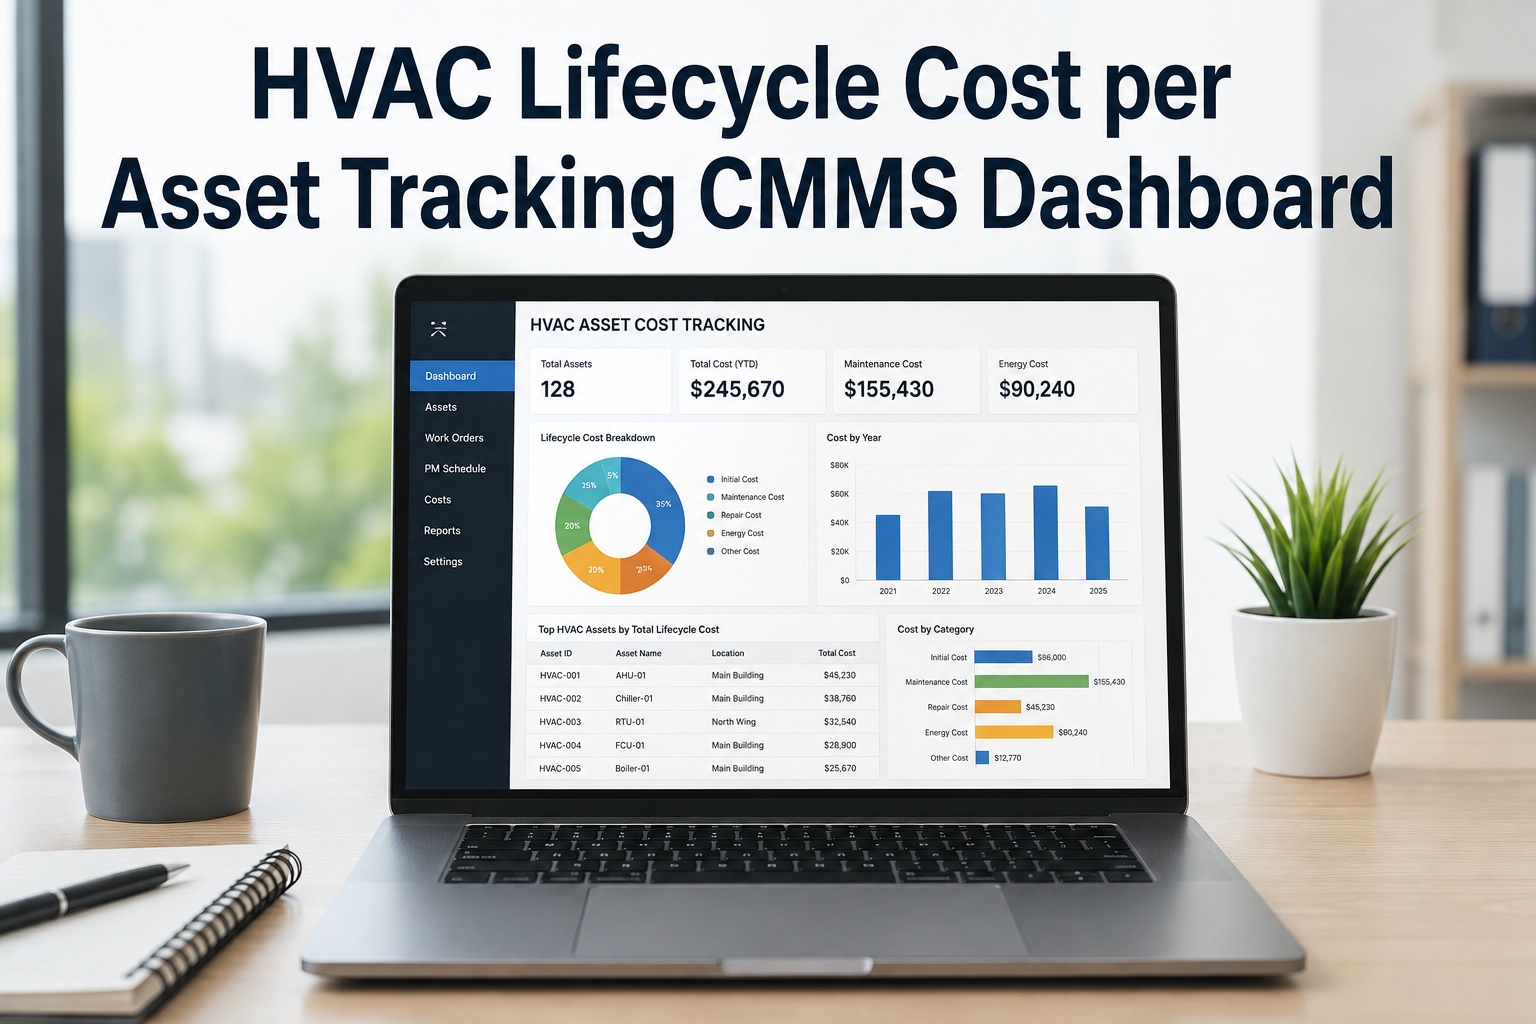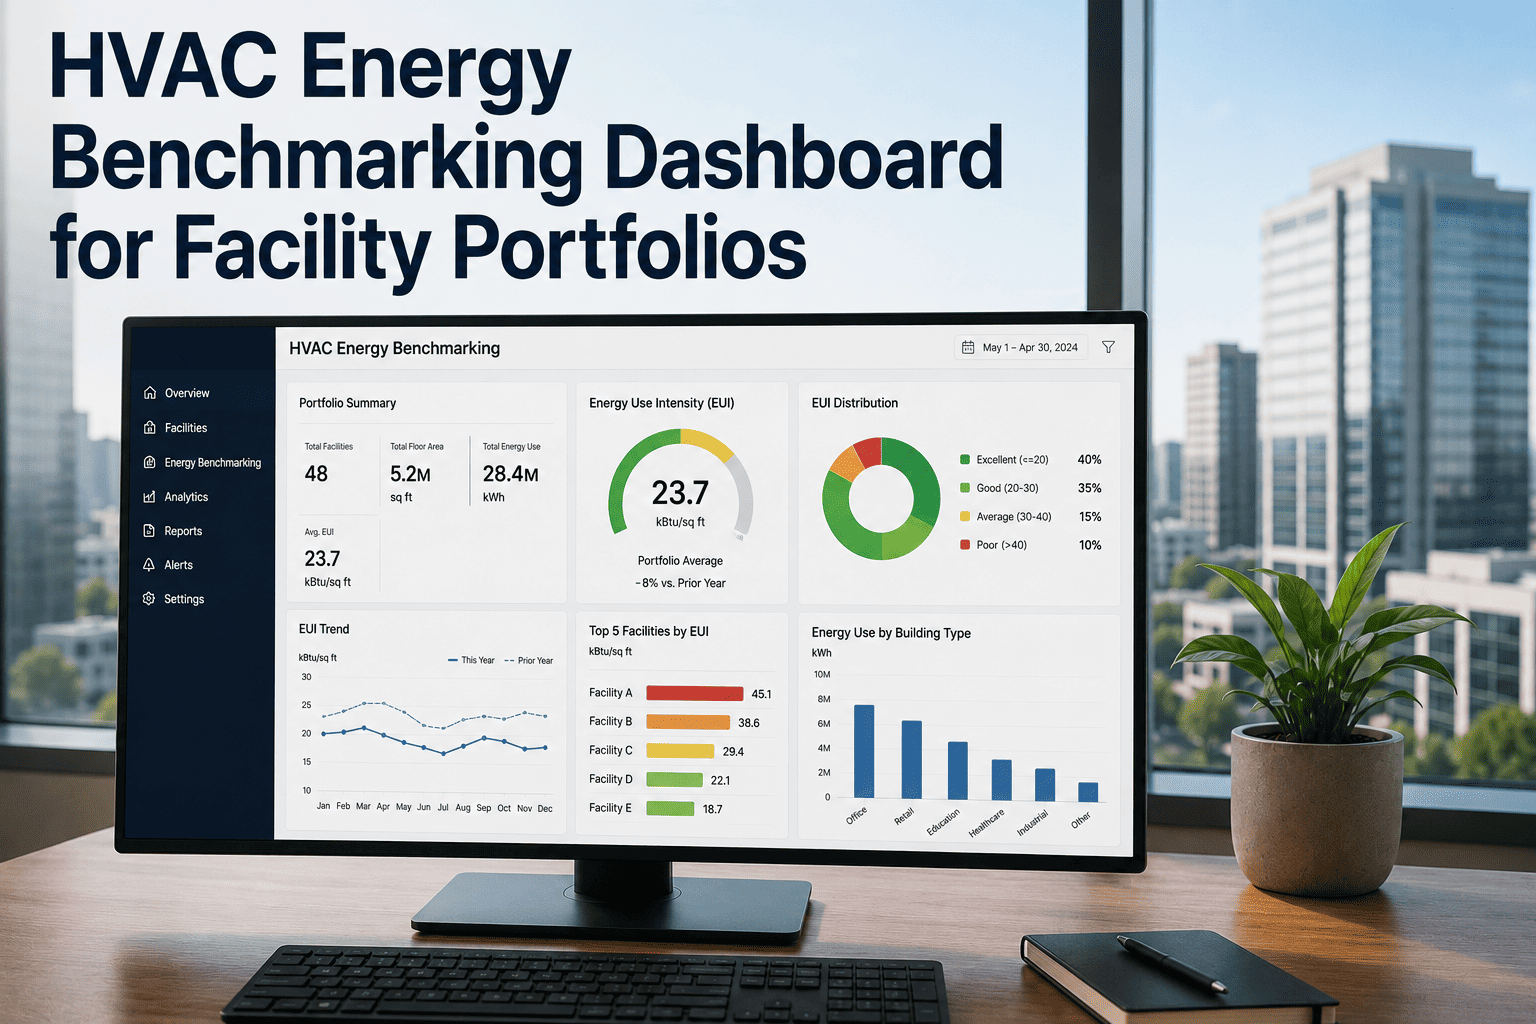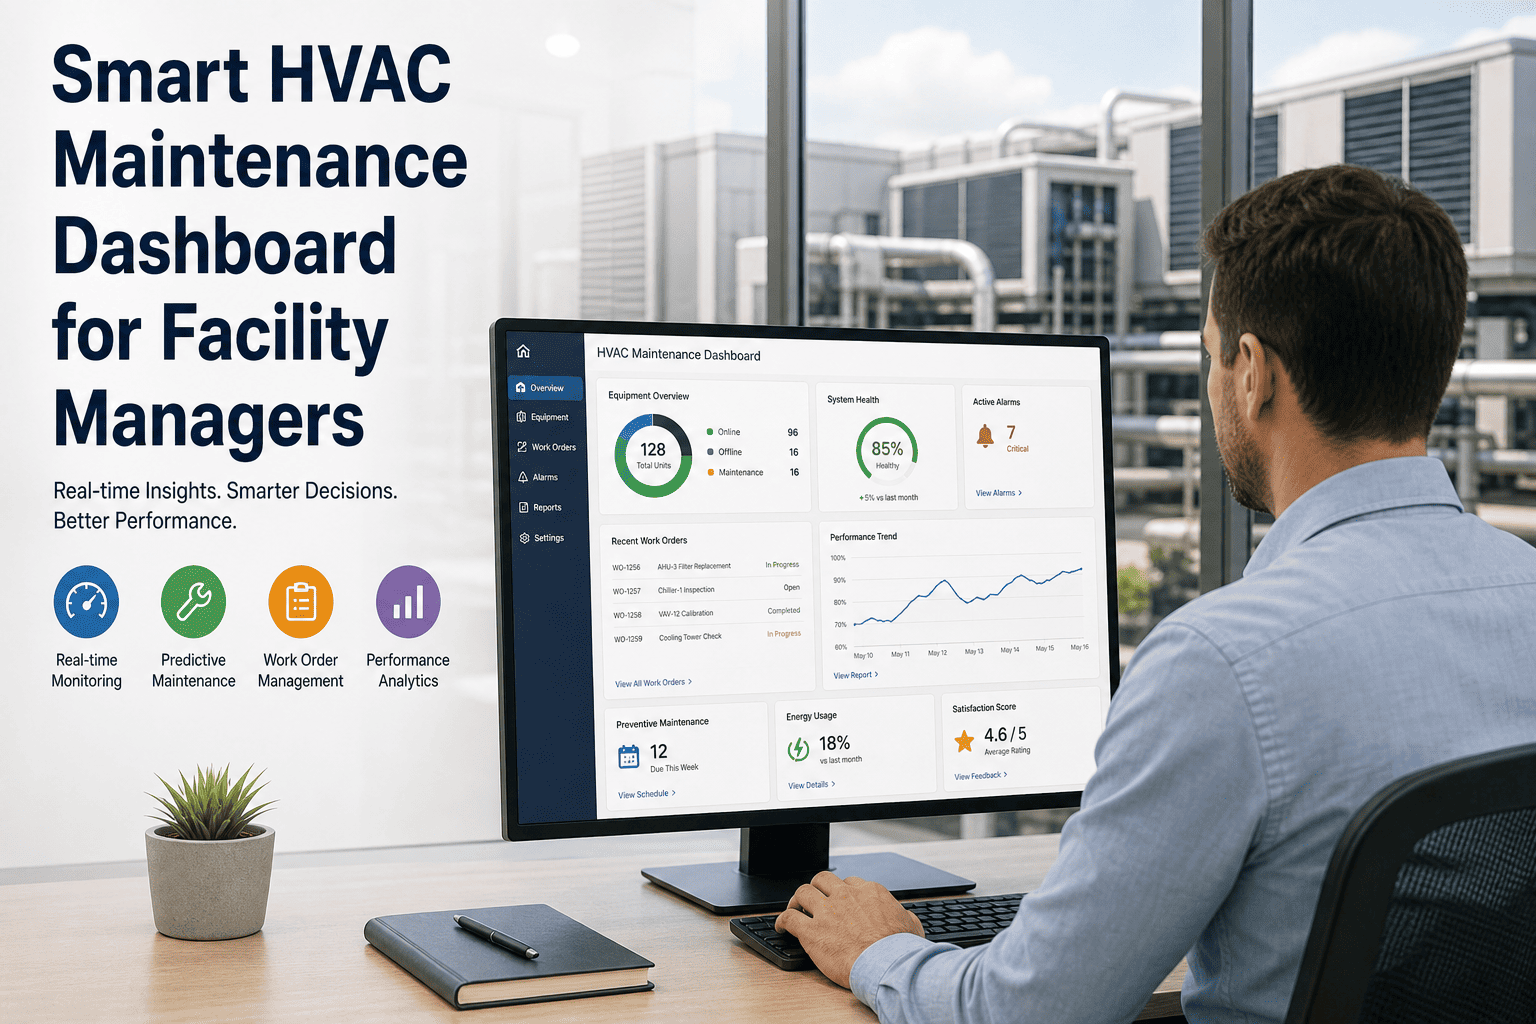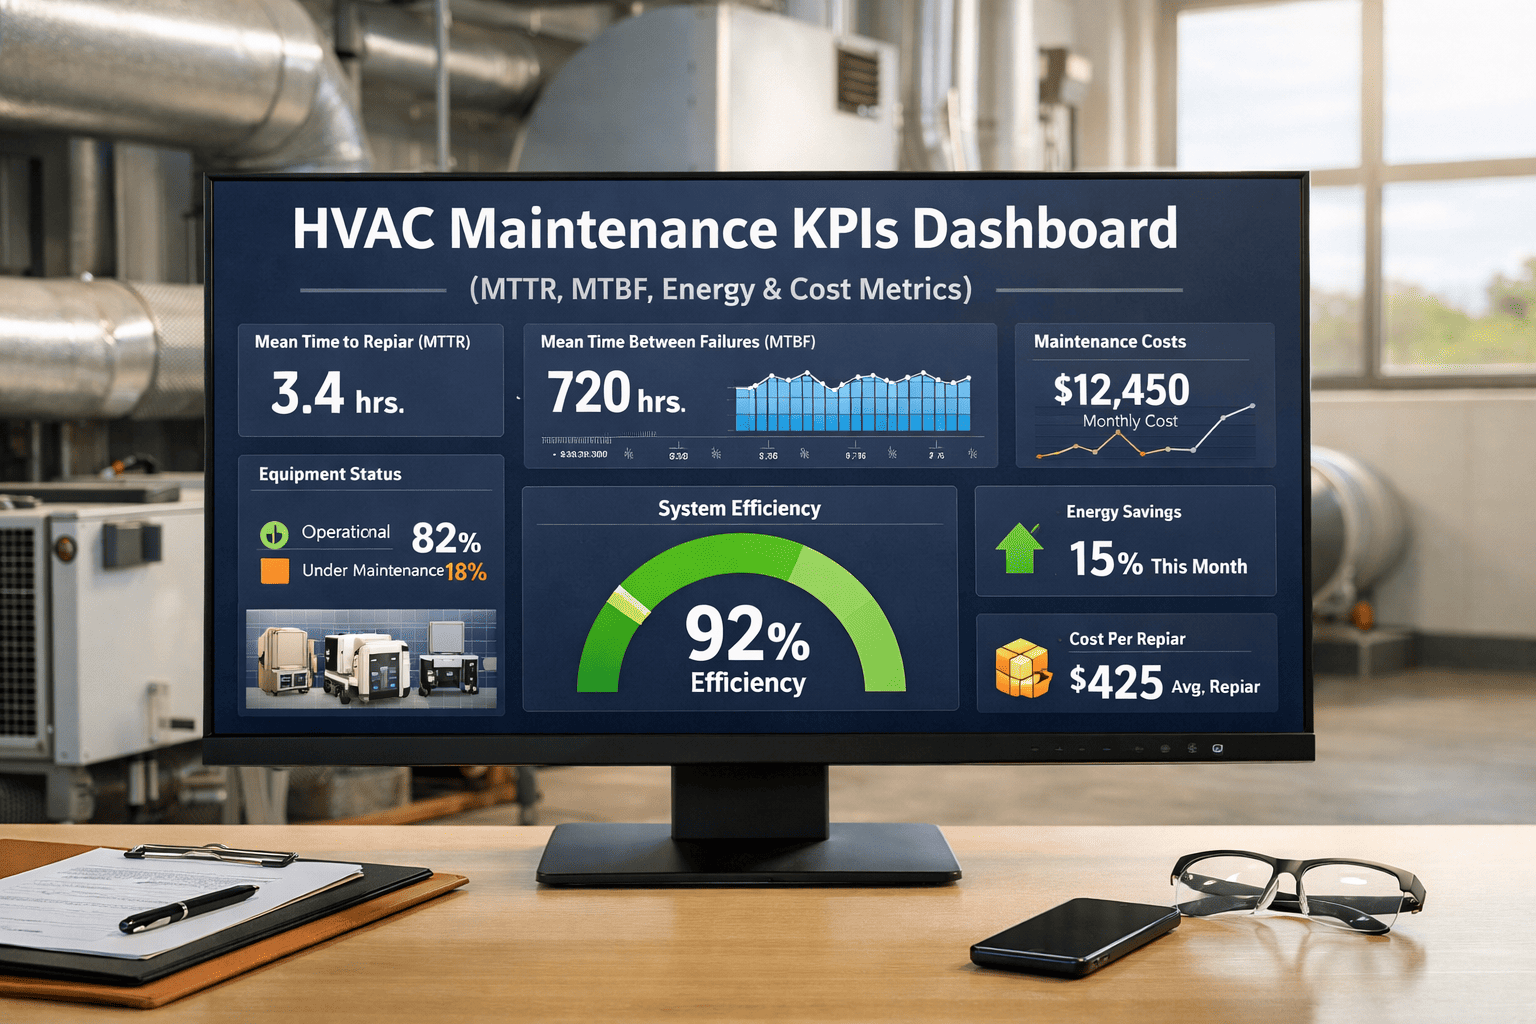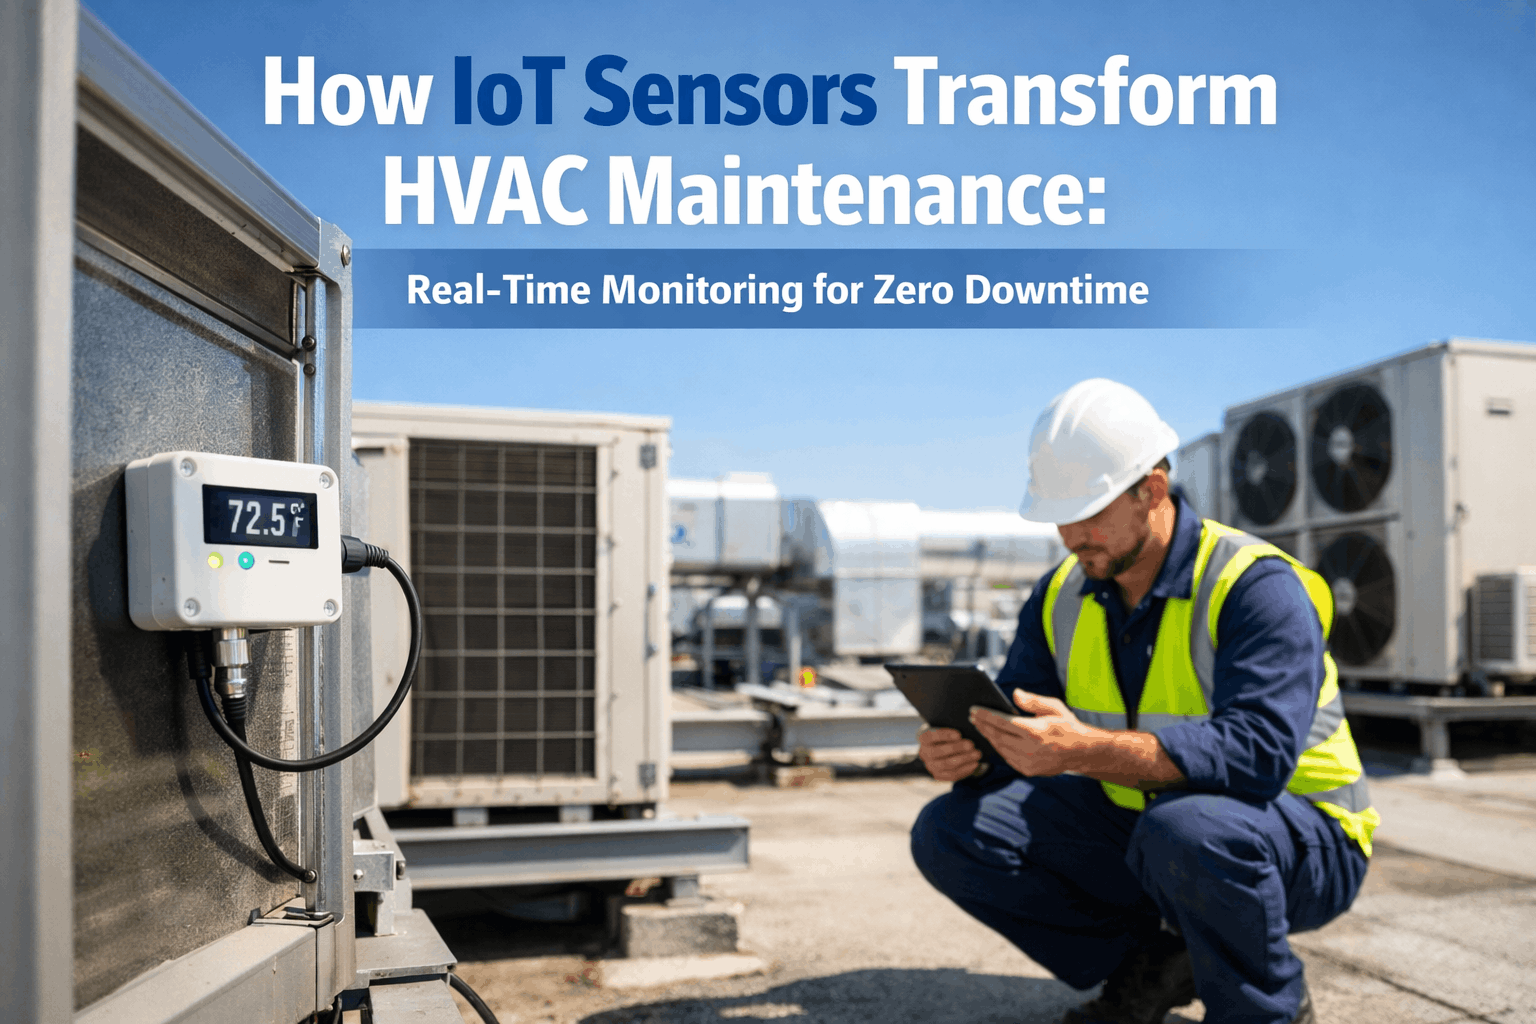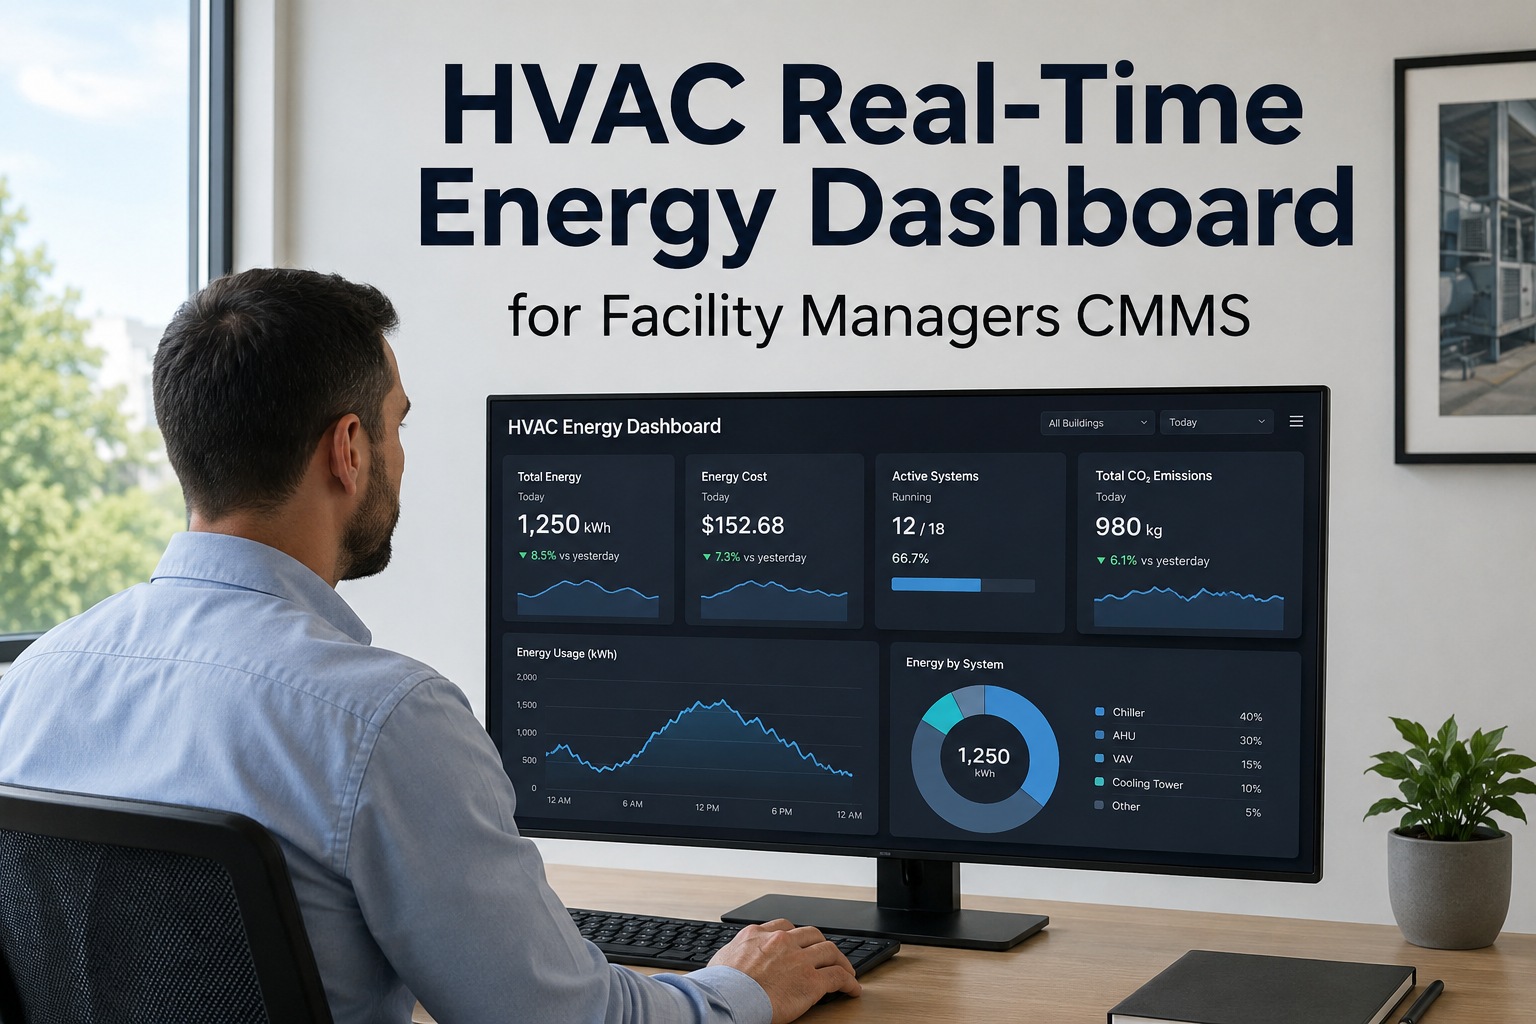
A real-time HVAC energy dashboard turns raw meter data into instant, actionable insight for facility managers chasing down waste, comfort complaints, and sustainability targets. Instead of waiting for a monthly utility bill to reveal a 20% consumption spike, teams using a CMMS-based energy dashboard can see live HVAC consumption, spot deviation from baseline within minutes, and trigger corrective work orders before the cost compounds. OxMaint's AI-powered CMMS and EAM platform unifies real-time HVAC monitoring with work-order automation, preventive scheduling, and asset analytics—so every kilowatt saved maps to a measurable reduction in downtime, labor, and energy spend. Ready to replace spreadsheet tracking with live energy intelligence? Start Free Trial and see your first dashboard in under an hour.
How much energy is your HVAC system quietly wasting right now?
Forty percent of commercial building energy goes to HVAC, and up to 30% of that is lost to undetected faults, setpoint drift, and dirty coils. A real-time HVAC energy dashboard built into your CMMS catches those losses the moment they start—so a single leaking AHU doesn't quietly add $8,000 to next quarter's utility bill.
What a real-time HVAC energy dashboard actually shows facility managers
An effective HVAC consumption dashboard pulls live data from BMS points, sub-meters, and IoT sensors—then visualizes it in a way that maintenance teams can act on in minutes, not days.
Live consumption by asset
Kilowatt readings per chiller, AHU, RTU, and pump updated every 60 seconds, mapped against each asset's rated load so you can see a 22 kW drift on Compressor #3 instantly.
Baseline deviation alerts
OxMaint learns each asset's normal kWh envelope and flags the moment consumption crosses the upper threshold—turning a slow efficiency bleed into an instant, actionable notification.
kWh per ton-hour efficiency
Real-time kW per ton of cooling lets you benchmark chillers against ASHRAE 90.1 efficiency targets and catch degrading COP before it costs a full cooling season.
Cost & carbon tracking
Live dollar burn-rate per HVAC zone plus Scope 2 emissions, so you can report to finance and sustainability teams from the same dashboard—no manual spreadsheet rollups.
HVAC dashboard configuration: a step-by-step guide for facility teams
Rolling out a CMMS real-time energy dashboard takes most facility teams 3–5 days when they follow this sequence. Skip a step and you end up with a dashboard nobody trusts.
Map assets & meter hierarchy
List every HVAC asset—chillers, boilers, AHUs, RTUs, pumps, cooling towers—and link each to its parent sub-meter and BMS point tag. A 180-asset plant typically has 40–60 sub-meters to reconcile.
Connect data sources via API
Pull BMS, Modbus, BACnet, and IoT sensor feeds into OxMaint using built-in connectors. Live polling at 60-second intervals gives sub-meter accuracy without flooding your database.
Establish baselines & thresholds
Let OxMaint's AI run 14 days of historical load data to learn each asset's normal energy envelope. Set deviation alerts at +10% (advisory) and +25% (critical auto-work-order).
Build role-specific views
Create one facility-wide view for the energy manager, zone-level views for building engineers, and a cost-summary tile for finance—so every stakeholder opens the dashboard and sees their number first.
Link alerts to work orders
Every critical deviation auto-generates a CMMS work order with asset ID, fault context, and assigned technician—closing the loop between detection and repair in under 30 minutes.
How much can a facility save with real-time HVAC monitoring?
Real-time HVAC energy monitoring pays for itself fast—typically within 4–8 months. The math is straightforward once you know your annual HVAC spend and your likely waste percentage.
Where Waste % is typically 15–30% (DOE benchmark) and Detection Efficiency is 60–85% with real-time CMMS monitoring versus 10–20% with monthly bill review alone.
A 180-asset commercial facility spending $42K/yr on HVAC energy
Net first-year savings: $5,475 — a 3.3× return. Payback achieved in 3.7 months, plus a 15–20% reduction in unplanned HVAC downtime.
| Facility Size | Annual HVAC Spend | Est. Waste (25%) | Savings w/ Real-Time Dashboard | Typical Payback |
|---|---|---|---|---|
| Small (<50K sq ft) | $18,000 | $4,500 | $3,375 | 5–7 months |
| Medium (50K–250K sq ft) | $42,000 | $10,500 | $7,875 | 3–5 months |
| Large (250K–1M sq ft) | $120,000 | $30,000 | $22,500 | 2–3 months |
| Campus (1M+ sq ft) | $350,000+ | $87,500+ | $65,000+ | 1–2 months |
How OxMaint's CMMS real-time energy dashboard solves HVAC waste
Most energy dashboards stop at visualization. OxMaint closes the loop—every energy deviation automatically becomes a work order, a parts check, and a verified repair, all inside one platform.
Auto-generated corrective work orders
When an AHU's kWh crosses the +25% threshold, OxMaint creates a work order with fault data, assigns the nearest qualified technician, and checks parts inventory—reducing response time from hours to under 30 minutes.
Cut unplanned downtime 30–50%Predictive failure alerts via AI
OxMaint's AI models analyze vibration, temperature, and energy trends to predict bearing failures and compressor degradation 7–21 days before they happen—so you fix it during a planned window, not an emergency.
Avoid 85% of catastrophic HVAC failuresSpare-parts linked to energy alerts
When a real-time energy spike points to a clogged filter or failing motor, OxMaint checks stock levels, reserves the part, and includes the bin location on the work order—eliminating 40% of repair delays.
Cut mean-time-to-repair by 35%Audit-ready energy & compliance reports
One-click reports for ISO 50001, ENERGY STAR Portfolio Manager, and internal ESG targets—pulling real consumption data, work-order history, and efficiency gains into a single, defensible document.
Eliminate 20+ hours of monthly reportingSpreadsheet tracking vs. CMMS real-time energy dashboard
If you're still tracking HVAC energy in Excel and reacting to monthly bills, you're flying blind for 30 days at a time. Here's what changes when visibility goes from monthly to minute-by-minute.
| Capability | Spreadsheets + Monthly Bills | OxMaint Real-Time CMMS Dashboard |
|---|---|---|
| Data refresh rate | 30 days (manual entry) | 60 seconds (automated API polling) |
| Fault detection latency | Days to weeks | Under 5 minutes |
| Auto work-order generation | None—manual entry required | Instant on threshold breach |
| Per-asset cost attribution | Estimated, not measured | Precise kWh & $ per asset, live |
| Predictive failure alerts | Not possible | AI-driven, 7–21 day advance warning |
| Audit & ESG reporting | 20+ hrs/month manual | One-click, always current |
| Typical energy waste recovered | 10–20% | 60–85% |
"Within six weeks of deploying OxMaint's real-time energy dashboard, we caught a fouled chiller tube bundle that was adding $1,900/month to our electric bill. The dashboard paid for itself on that one catch."
"We switched from Excel tracking to OxMaint and cut our HVAC energy spend 18% in the first year. The auto-work-order on energy deviations is the feature I didn't know I needed until I had it."
See OxMaint's real-time HVAC energy dashboard on your assets
Book a 30-minute demo and we'll connect your BMS data, show you live consumption per asset, and map out your expected savings—before you commit to anything.
HVAC real-time energy dashboard: frequently asked questions
What is a real-time HVAC energy dashboard?
A real-time HVAC energy dashboard is a live visualization tool that displays energy consumption, cost, and efficiency metrics for heating, ventilation, and air conditioning equipment—updated every 60 seconds or less. When built into a CMMS like OxMaint, it also links energy anomalies directly to corrective work orders, so facility managers can detect, diagnose, and repair efficiency losses without leaving the platform.
How does a CMMS real-time energy dashboard reduce HVAC costs?
It reduces costs by catching energy waste—setpoint drift, failing components, stuck dampper, dirty coils—the moment consumption deviates from baseline, rather than weeks later on a utility bill. Facilities typically recover 15–25% of their annual HVAC energy spend by acting on real-time alerts, with payback in 3–7 months. Start Free Trial to calculate your specific savings.
Can OxMaint connect to my existing BMS or IoT sensors?
Yes. OxMaint supports BACnet, Modbus, OPC-UA, and REST API integrations with all major building management systems, plus IoT sensor platforms. Setup typically takes 1–2 days for a mid-size facility, and OxMaint's team provides guided onboarding to map your meter hierarchy and asset tags during the process.
How long does it take to set up an HVAC energy dashboard?
Most facility teams go live in 3–5 business days: two days to map assets and connect data sources, one day to configure API feeds, one day to establish baselines, and one day to build role-specific views. OxMaint's AI then spends 14 days learning each asset's normal energy envelope before alerts go fully live.
What metrics should a facility energy dashboard track for HVAC?
At minimum, track live kWh per asset, cost per hour, kWh per ton-hour of cooling, deviation from baseline (% and $), and carbon equivalent. Advanced dashboards also track COP (coefficient of performance), EER, part-load efficiency, and runtime hours per asset—benchmarked against ASHRAE 90.1 standards to quantify how far each unit has drifted from rated efficiency.
Stop paying for HVAC energy you can't see
Every day without a real-time dashboard is another day of hidden waste, undetected faults, and inflated utility bills. See how OxMaint's CMMS turns live HVAC data into instant savings, automated work orders, and audit-ready reports.
Free 14-day trial · No credit card