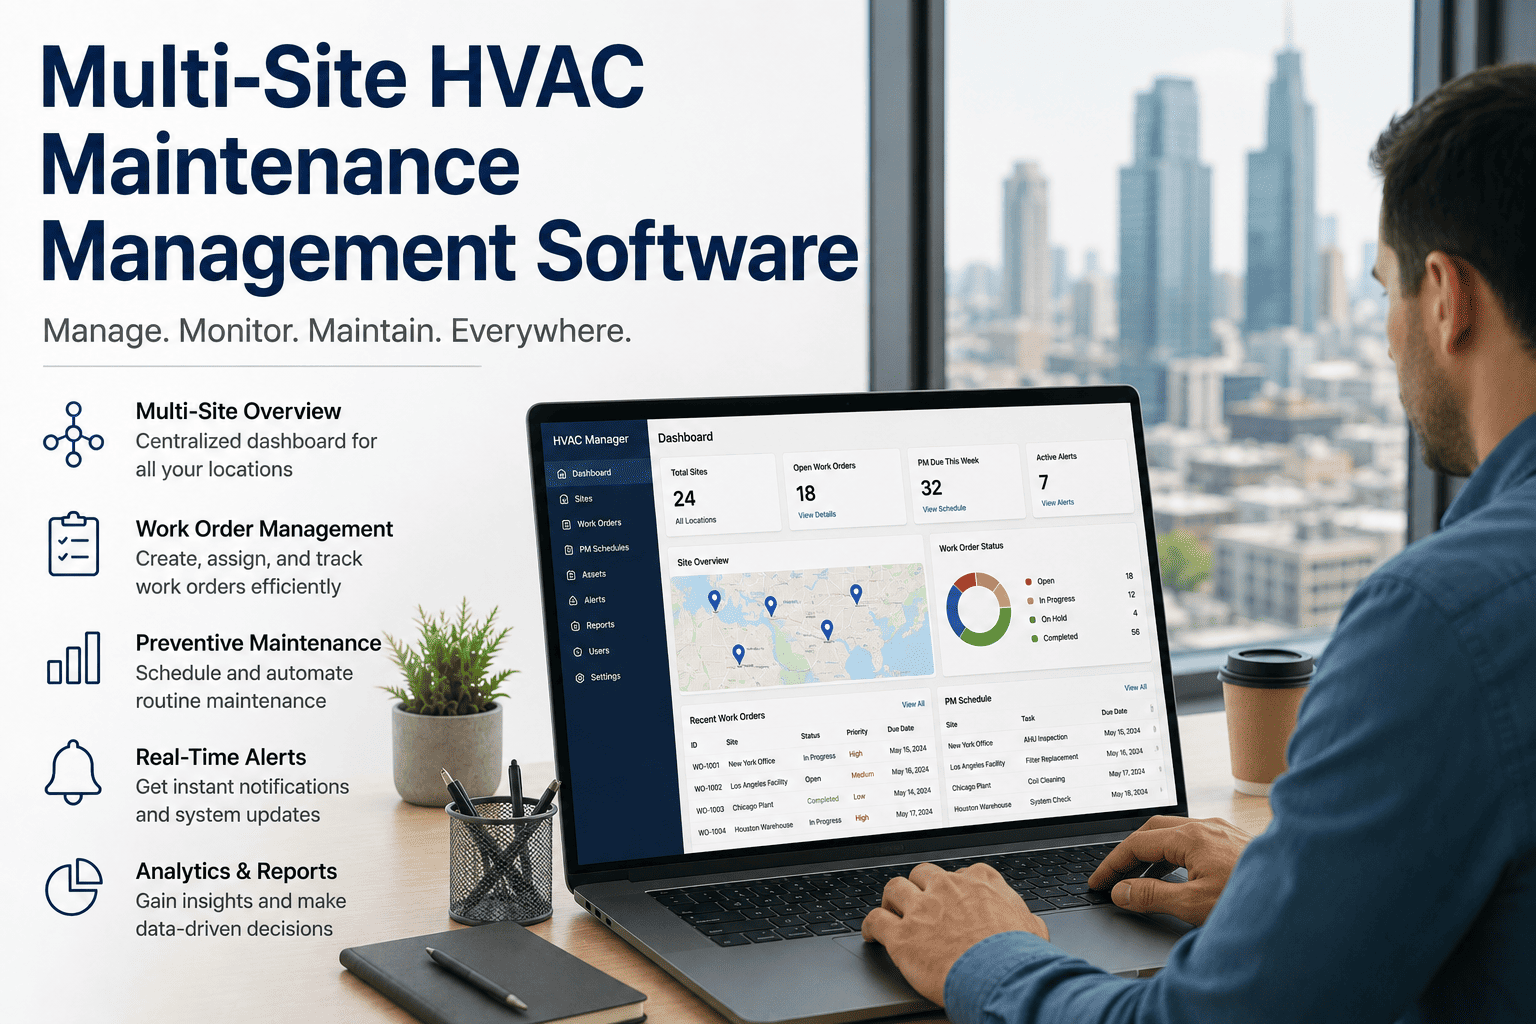
A facilities director managing 12 buildings across three cities has the same question every month when the energy bills arrive: which building is underperforming, which HVAC system is consuming 20% more than it should, and what can be done about it before next month's invoice. Without a benchmarking dashboard, that question takes three days of spreadsheet work to answer. With OxMaint's HVAC energy benchmarking dashboard, the answer is visible in seconds — across every building, every chiller, every AHU, and every energy zone in the portfolio — compared against baselines, peer buildings, and industry benchmarks, all in one place.
Blog · Energy Optimization · Analytics
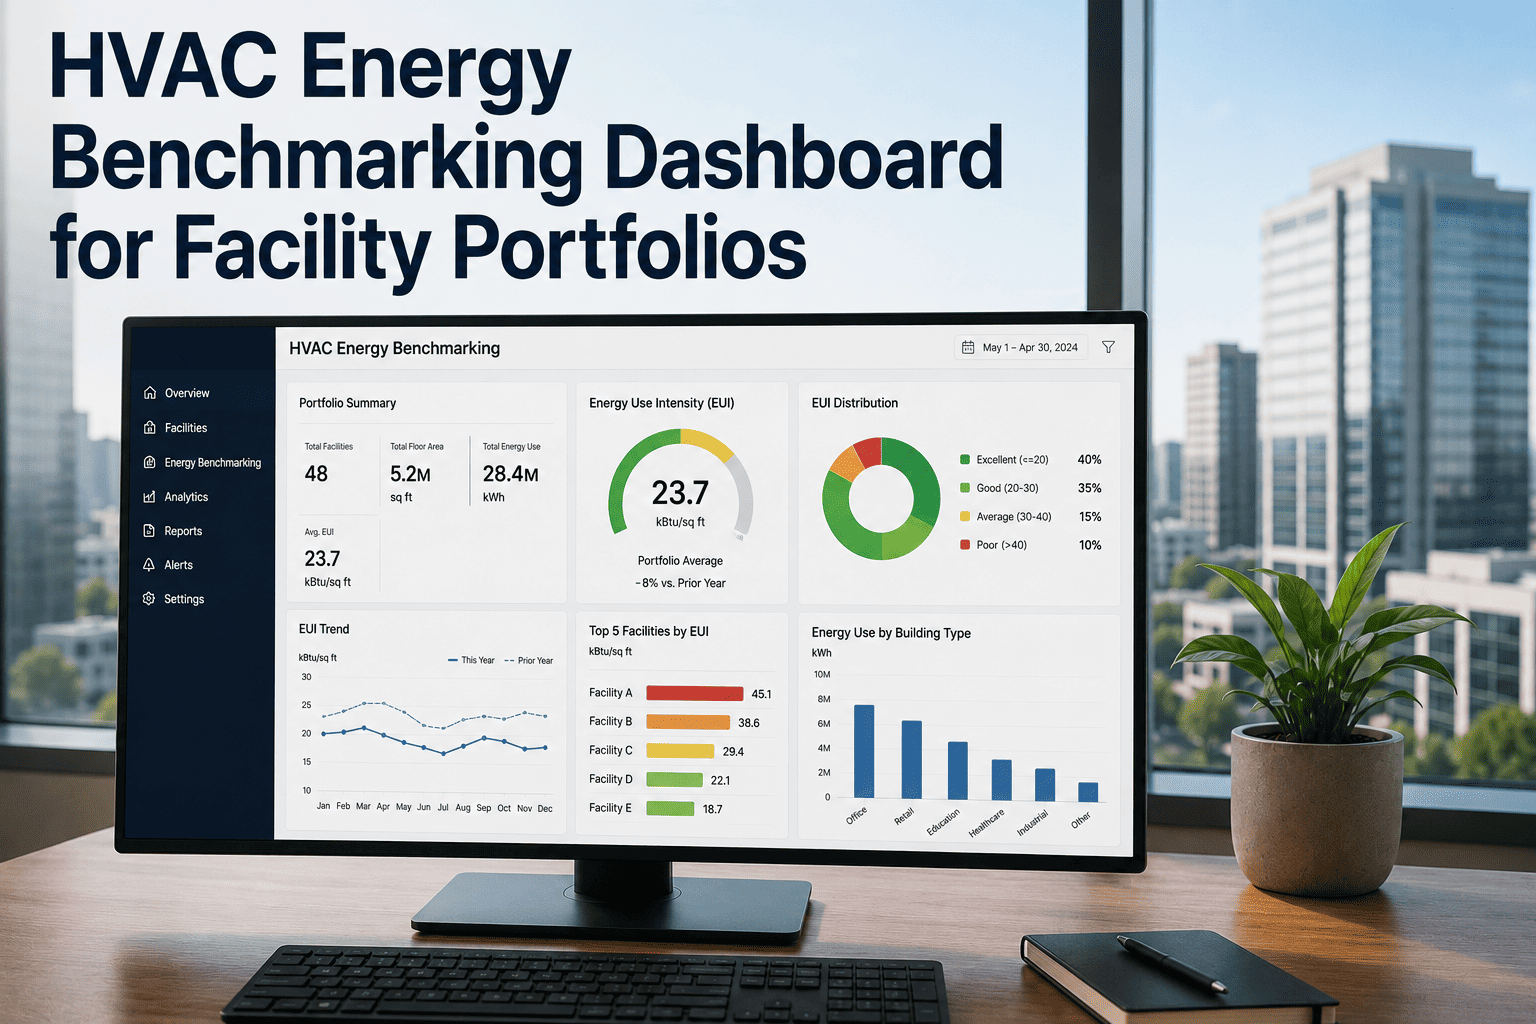
HVAC Energy Benchmarking Dashboard for Facility Portfolios
Multi-Site Benchmarking · Chiller kW/ton · EUI Tracking · HVAC KPIs · Cost vs Performance Analytics
Portfolio Energy Dashboard · May 2025
Site A · Chiller EUI
52 kWh/m²
Site B · Chiller EUI
78 kWh/m²
Site C · Chiller EUI
94 kWh/m²
Portfolio Benchmark
60 kWh/m²
40%
Of total building operating cost is HVAC energy — the single largest controllable expense
25%
Average HVAC energy waste in commercial buildings due to missed maintenance and undetected inefficiency
6 min
Time to identify worst-performing sites in a 20-building portfolio using OxMaint benchmarking dashboard
ROI
Energy benchmarking typically delivers 15–35% HVAC energy savings identified and actioned in Year 1
What OxMaint Benchmarks Across Your HVAC Portfolio
01
Chiller kW/ton Efficiency
Track cooling efficiency across every chiller in the portfolio — flagging units running above 0.65 kW/ton that indicate condenser fouling, refrigerant issues, or approaching end-of-life performance.
Industry benchmark: 0.45–0.60 kW/ton for well-maintained centrifugal chiller
02
Energy Use Intensity (EUI)
Compare HVAC energy per square metre across all buildings in the portfolio, normalised for occupancy and climate. EUI benchmarking identifies which sites are outliers before year-end audits.
Target: Below 60 kWh/m²/yr for commercial office HVAC systems
03
AHU Fan Energy Ratio
Fan energy as a fraction of total AHU output — rising ratio indicates filter loading, belt wear, or damper restriction that maintenance can resolve before the energy cost compounds over weeks and months.
Alert threshold: Fan kW rising 15% above 30-day baseline
04
Cooling Cost per Occupied Hour
Normalise HVAC energy cost against actual building occupancy — eliminating the distortion from varying occupancy levels when comparing cost performance across buildings in the portfolio.
Enables true peer comparison regardless of occupancy variation
05
HVAC-to-Total Energy Ratio
Track HVAC as a percentage of total building energy — a rising ratio in a stable occupancy building signals HVAC system degradation that is invisible when looking at absolute energy costs alone.
Typical commercial: HVAC = 35–42% of total building energy
06
Maintenance Cost per kWh Saved
Link PM completion rates directly to energy performance — proving the financial return of HVAC maintenance investment with actual before/after data from OxMaint work order records and energy readings.
Benchmark: Every $1 in HVAC PM returns $3–$6 in energy savings
Portfolio Energy Performance — Maintenance Correlation
Site A · Office Tower
96%
52 kWh/m²
-13% below
Optimised
Site B · Retail Mall
74%
78 kWh/m²
+30% above
$48,000/yr
Site C · Logistics Hub
52%
94 kWh/m²
+57% above
$112,000/yr
Site D · Hospital Wing
99%
61 kWh/m²
+2% above
$6,200/yr
Site E · University Campus
68%
83 kWh/m²
+38% above
$54,000/yr
Stop Reviewing Energy Bills. Start Managing Energy Performance.
OxMaint's energy benchmarking dashboard gives portfolio managers a live view of HVAC efficiency across every building, site, and asset — with direct linkage to maintenance records that proves the ROI of every PM dollar spent.
From Dashboard Insight to Maintenance Action — The OxMaint Loop
1
Dashboard Flags Anomaly
Site C chiller kW/ton rises 22% above baseline — flagged in portfolio dashboard as underperforming asset.
→
2
Root Cause Identified
OxMaint links energy deviation to PM record — condenser cleaning 9 months overdue, last WO shows fouling noted but not actioned.
→
3
Work Order Created
Priority PM work order raised for condenser clean — assigned, scheduled, and tracked through to completion with energy baseline reset.
→
4
Energy KPI Recovers
Post-clean kW/ton returns to 0.51 baseline. Dashboard shows $9,400/month energy cost reduction. Saving quantified against PM cost.
"
The fundamental problem with energy management in multi-site facilities portfolios is that energy data and maintenance data live in completely separate systems — so the person reviewing the energy bill has no visibility of whether the chiller was serviced last month, and the person scheduling maintenance has no feedback on whether the PM actually moved the energy needle. OxMaint is one of the few platforms I have seen that genuinely closes this loop by linking work order records to energy KPIs in the same dashboard. When a facilities director can see that Site C is $112,000 per year above benchmark and trace that directly to a 52% PM compliance rate, the maintenance investment decision becomes financially self-evident. That is the level of analytics that boards and CFOs respond to — not raw energy data, but the causal link between maintenance discipline and energy cost.
Dr. Anita Rajan, MRICS, ASHRAE Fellow
Director of Sustainability and Building Performance · International Real Estate Investment Trust · 28 Years Facility Energy Management and ESG Reporting · Fellow of ASHRAE · Member of the Royal Institution of Chartered Surveyors · Specialist in portfolio energy benchmarking, NABERS and LEED energy ratings, and HVAC performance-linked capital planning for institutional property portfolios
Frequently Asked Questions
How does OxMaint collect HVAC energy data for benchmarking across multiple buildings?
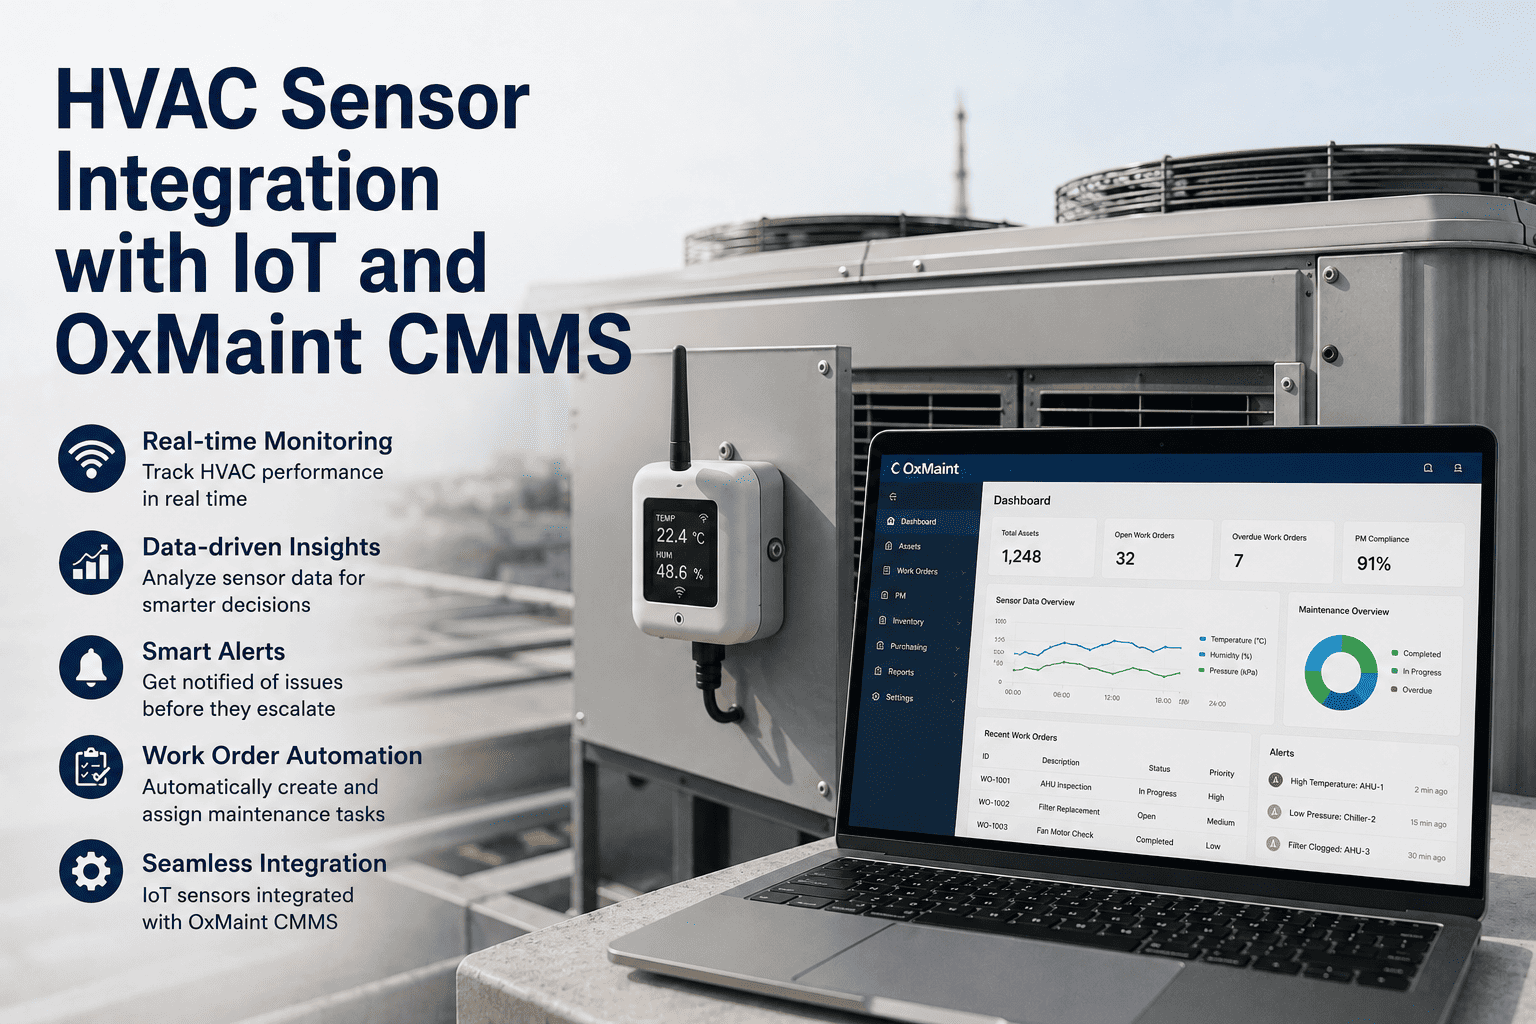
OxMaint collects energy data through three pathways depending on the metering infrastructure at each site: direct integration with smart sub-meters via API or BACnet/Modbus, manual meter reading entry by technicians as part of routine PM work orders, and import of utility bill data by CSV or API for sites without sub-metering. For sites with IoT sensors already connected, energy readings flow automatically at configurable intervals from 15 minutes to daily. Each energy reading is timestamped and linked to the relevant asset and site in the OxMaint database, enabling the benchmarking dashboard to compare like-for-like across the portfolio normalised for floor area, occupancy, and seasonal conditions.
Start a free trial to configure energy data collection for your portfolio.
Can OxMaint's benchmarking dashboard generate energy reports for ESG or sustainability reporting?
Yes — OxMaint's analytics module generates exportable energy reports in CSV, PDF, and structured data formats suitable for ESG disclosure, NABERS/ENERGY STAR rating submissions, and internal sustainability reporting. Reports can be configured to show HVAC energy by site, asset class, or time period, with year-on-year comparison, intensity metrics, and variance explanations linked to maintenance events. For portfolios with carbon reporting obligations, OxMaint can apply grid emission factors to calculate Scope 2 carbon from HVAC energy data and generate CO₂e metrics alongside kWh figures. Reports can be scheduled for automatic generation and distribution to relevant stakeholders on a monthly or quarterly basis.
Book a demo to see OxMaint's ESG energy reporting in action.
How does OxMaint link HVAC maintenance records to energy performance data in the same dashboard?
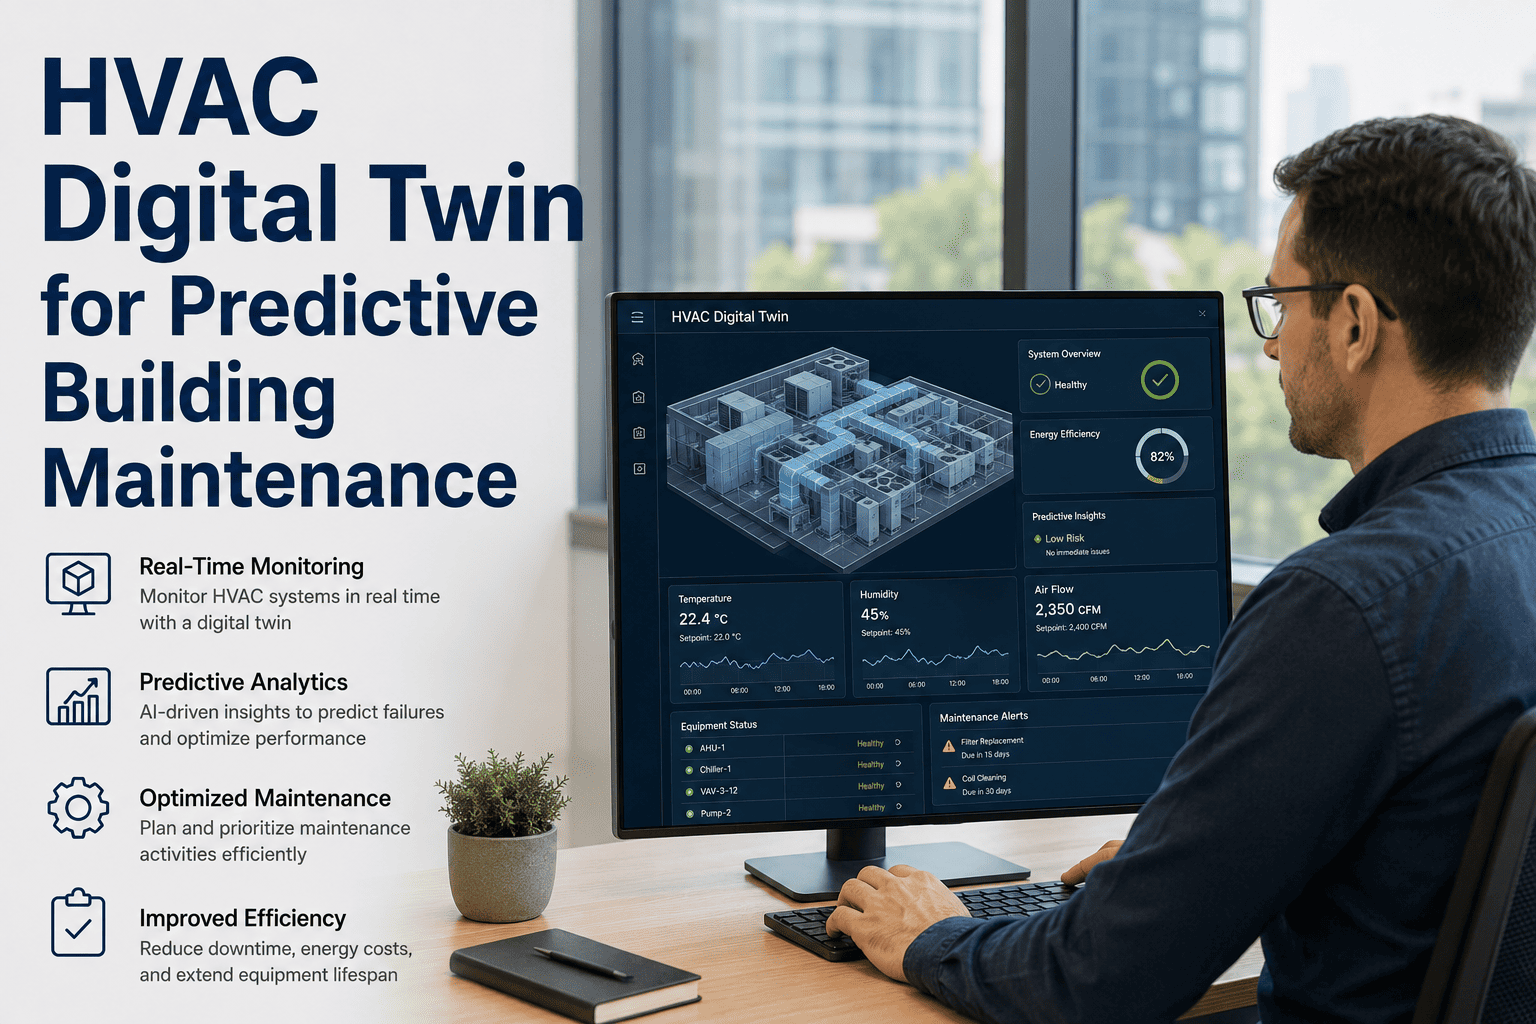
Every work order completed in OxMaint is timestamped and linked to the asset record. When energy data is collected for the same asset, OxMaint's analytics engine correlates maintenance events — such as a condenser clean, filter replacement, or refrigerant recharge — with the energy trend data for the days and weeks following the maintenance. This creates an automatic before/after energy view for each maintenance event, which populates the maintenance-to-energy ROI section of the benchmarking dashboard. Over time, the accumulated dataset builds a statistically valid picture of the energy impact of each maintenance task, enabling evidence-based decisions about PM frequency, asset replacement timing, and maintenance budget allocation.
Explore the maintenance-to-energy linkage with a free OxMaint trial.
OxMaint · HVAC Energy Benchmarking
Know Which Building Is Wasting Energy. Know Why. Fix It This Week.
OxMaint's energy benchmarking dashboard turns portfolio HVAC data into actionable maintenance priorities — giving facilities directors the evidence to justify maintenance investment and the tools to deliver measurable energy savings.