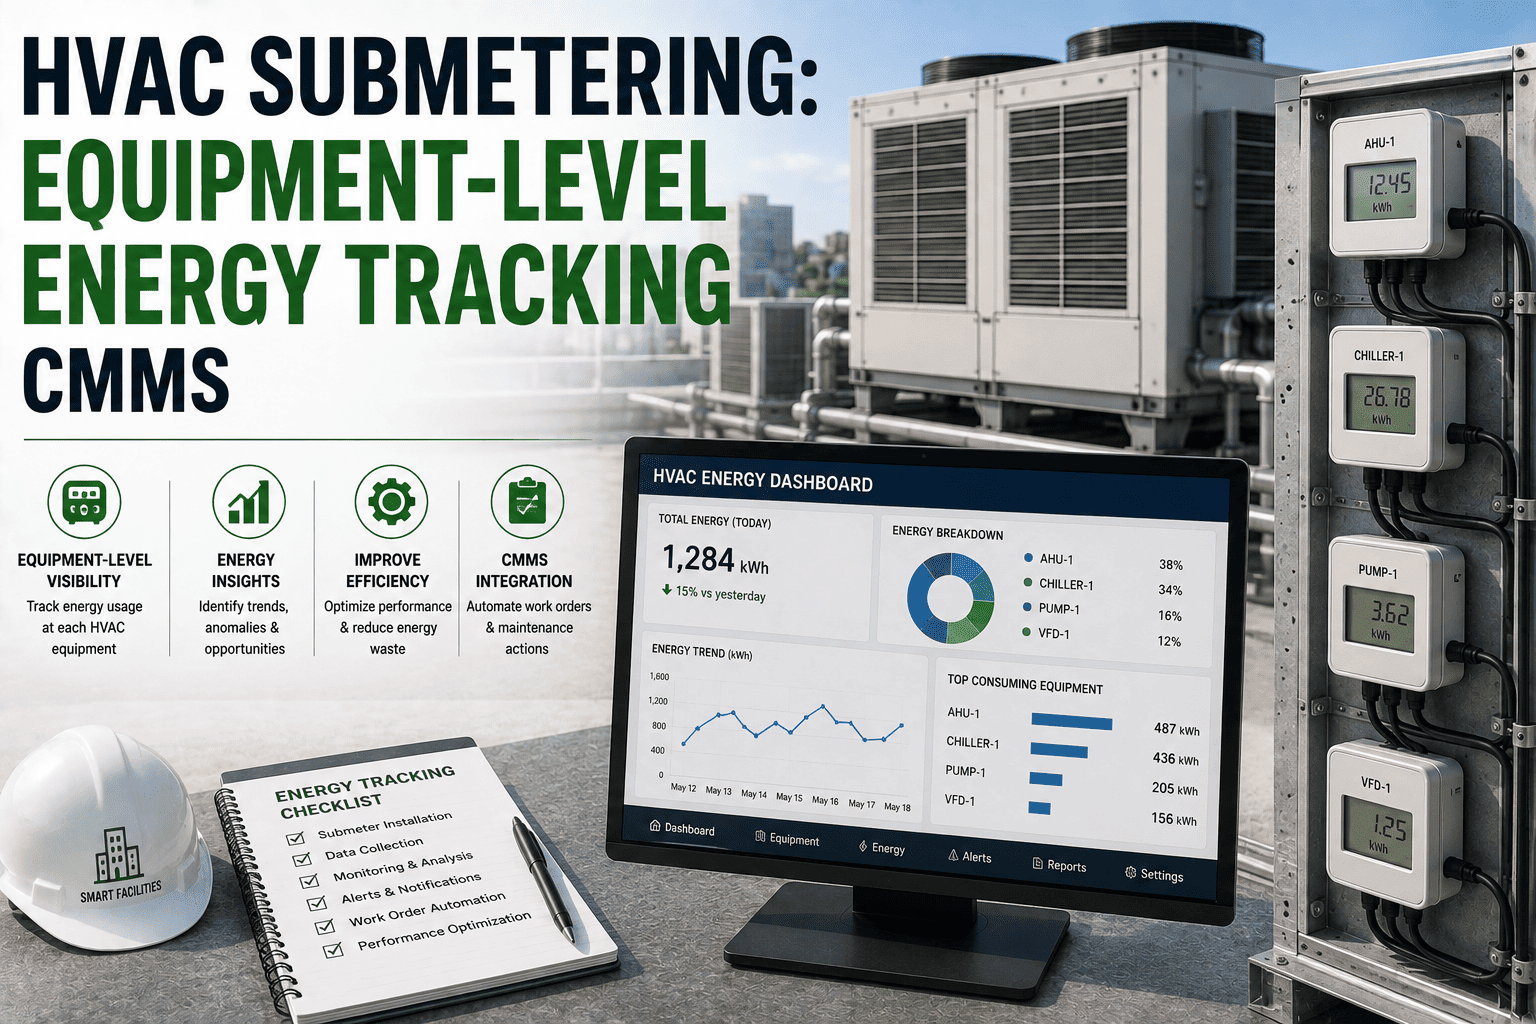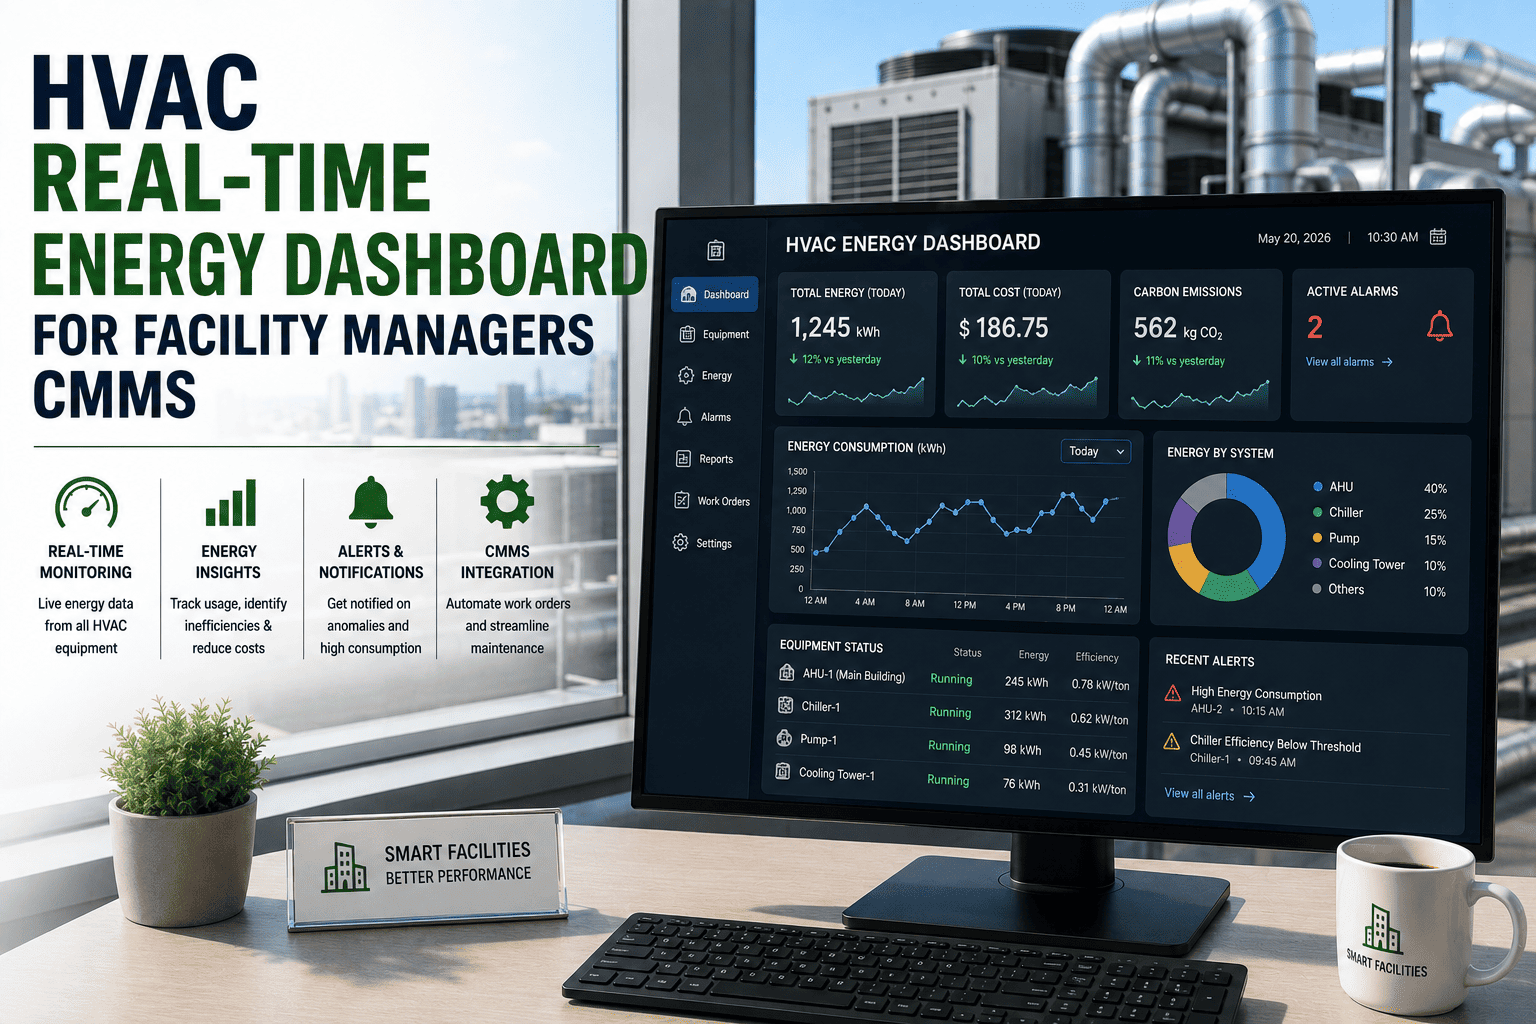
HVAC kWh per sqft is the single most useful energy intensity metric for benchmarking building performance, with commercial office buildings typically consuming 10–22 kWh per square foot annually for heating, ventilation and air conditioning alone. This HVAC energy benchmark guide breaks down industry comparison data by building type, shows you how to calculate and track kWh per square foot across a portfolio, and explains how a CMMS like OxMaint turns manual spreadsheet tracking into automated, portfolio-wide energy analytics. Whether you manage a single plant or 500+ facilities, knowing where you stand against the HVAC building benchmark is the first step toward cutting energy waste 15–30%. Ready to see it on your assets? Start Free Trial or read on for the full benchmark framework.
HVAC Energy Benchmark Guide
How does your HVAC kWh per square foot compare?
Most maintenance teams track HVAC energy in spreadsheets — if at all. OxMaint automates kWh/sqft benchmarking across every building, asset and meter in your portfolio so you can spot waste in days, not quarters.
The average commercial building overspends on HVAC energy by 15–30% simply because nobody benchmarks kWh per square foot consistently.
With the right CMMS, you can compare every building against industry benchmarks, flag outliers automatically, and tie energy intensity directly to preventive maintenance scheduling — so clean coils, calibrated sensors and optimized runtimes become measurable savings, not guesswork.
office median
with CMMS tracking
benchmark report
HVAC Building Benchmarks
HVAC kWh per square foot benchmarks by building type
ENERGY STAR, CBECS and ASHRAE data converge on these ranges. Use the median as your target and the high end as your alarm threshold — if a building exceeds the top of its range, an HVAC energy audit and CMMS-driven PM review should follow immediately.
| Building Type | Low (Efficient) | Median | High (Inefficient) | Primary HVAC Driver |
|---|---|---|---|---|
| Office — small (<50K sqft) | 8.5 | 13.2 | 19.0 | RTU fan + reheat |
| Office — large (>50K sqft) | 10.0 | 15.4 | 22.5 | Central chiller plant |
| Hospital / Healthcare | 18.0 | 24.7 | 33.0 | 24/7 ventilation + humidification |
| Retail / Mall | 7.0 | 11.8 | 17.5 | Door infiltration + lighting heat |
| K-12 School | 6.5 | 10.3 | 15.0 | Seasonal scheduling gaps |
| Warehouse / Distribution | 3.5 | 6.2 | 9.8 | Gas-unit heating |
| Data Center (cooling only) | 45.0 | 75.0 | 120+ | CRAC / CRAH redundancy |
| Lodging / Hotel | 9.0 | 14.6 | 21.0 | PTAC envelope losses |
| Manufacturing / Industrial | 12.0 | 20.5 | 32.0 | Process exhaust + make-up air |
Source ranges: ENERGY STAR Portfolio Manager, CBECS 2018, ASHRAE 90.1. Values reflect HVAC-only kWh; total site EUI is typically 1.6–2.2x higher.
Calculate kWh per SqFt
How to calculate HVAC energy intensity per square foot
The kWh per square foot formula is simple, but collecting clean submeter data is where most teams stall. Here is the exact formula and the three inputs you need — plus where CMMS automation replaces manual meter reads.
The Formula
Example: 185,000 kWh ÷ 12,000 sqft = 15.4 kWh/sqft — right at the large-office median.
Total HVAC kWh
Pull from utility main meters or HVAC-dedicated submeters. If you lack submetering, estimate HVAC's share (typically 40–60% of total building kWh) using load profiling.
Gross Floor Area
Use ANSI/BOMA gross square footage — all enclosed, conditioned space including mechanical rooms. Exclude unconditioned loading docks and parking structures.
Time Period
Always benchmark a full 12-month rolling window to normalize seasonal peaks. Monthly snapshots skew high in July and low in April — annualize before comparing.
Worked Example
Real-world scenario: cutting 22% from a 180-asset plant's HVAC energy
A 45,000-sqft precision-machining facility in Ohio was spending $52,000/yr on HVAC electricity — 21.8 kWh/sqft, well above the 20.5 industrial median. Here is what happened when they adopted CMMS-based energy tracking and PM optimization over six months.
BEFORE — Months 1–2
Reactive, spreadsheet-tracked
- 21.8 kWh/sqft — 6% above benchmark
- $52K annual HVAC energy cost
- Coils cleaned once per year, filter changes "when remembered"
- No submeter data; energy bills reviewed quarterly in a PDF
- 3 chillers running at 40% load each instead of 1 at 80%
AFTER — Months 3–6
CMMS-tracked, PM-optimized
- 17.0 kWh/sqft — 17% below benchmark
- $40.5K annualized HVAC energy cost
- Quarterly coil cleaning + monthly filter PMs auto-scheduled in OxMaint
- Submeter feeds into CMMS dashboard; outliers flagged in real time
- Staged chiller sequence optimized; 1 unit handles base load
$11,500/yr saved · 22% kWh/sqft reduction · payback in 4.2 months · ROI 286% in year one
CMMS Energy Tracking
Why HVAC energy benchmarking needs CMMS — not spreadsheets
Spreadsheets tell you what happened last quarter. A CMMS tells you what is happening right now and what to fix next. Here are the four capabilities that make the difference between benchmarking theater and real energy savings.
Automated meter data capture
OxMaint ingests kWh data from BMS, submeters and utility APIs on a schedule you define — hourly, daily or monthly. No more clipboard reads, no more stale spreadsheets. Every asset's energy intensity is always current.
Outcome: 90% reduction in manual data-collection time
Benchmark comparison dashboards
Each building's kWh/sqft is auto-plotted against its industry benchmark range. Buildings above the high threshold trigger an alert and a recommended PM work-order sequence — coil cleaning, sensor calibration, economizer check.
Outcome: spot energy waste within 48 hours instead of one quarter
PM-to-energy linkage
When a preventive maintenance task is completed — filter change, belt tension, coil clean — OxMaint logs the before/after kWh delta so you can prove which PMs actually save energy and justify the maintenance budget.
Outcome: quantify ROI on every PM and cut energy 15–30%
Predictive energy alerts
OxMaint's AI models learn each asset's normal kWh signature. When consumption drifts 10–15% above baseline — a fouled condenser, a stuck damper, a failing VFD — the system auto-generates a work order before the utility bill arrives.
Outcome: catch HVAC faults 2–4 weeks earlier than meter review
kWh Benchmark CMMS in Action
How OxMaint helps you hit — and beat — the HVAC energy benchmark
OxMaint maps each of its core CMMS/EAM modules directly to a measurable energy outcome. Here is the capability-to-result chain that turns benchmark data into action.
Asset hierarchy + submeter mapping
Link every meter, RTU, chiller and AHU to its parent building and floor area. OxMaint auto-calculates kWh/sqft per asset, per zone and per building — no manual math.
Impact: portfolio-wide benchmark in one dashboard
Preventive maintenance scheduling
Auto-generate PM work orders for coil cleaning, filter replacement, sensor calibration and economizer inspection at OEM-recommended intervals — the PMs that most directly reduce HVAC kWh/sqft.
Impact: 15–30% reduction in HVAC energy intensity
Predictive maintenance analytics
AI detects energy-consumption anomalies — a chiller drawing 12% more kWh than its learned baseline — and opens a work order with likely-cause diagnostics before the drift becomes a 30% spike.
Impact: catch faults 2–4 weeks early, cut unplanned downtime 30–50%
Maintenance analytics + reporting
Export ENERGY STAR-ready kWh/sqft reports for every building. Track energy-vs-PM correlation, prove compliance with ISO 50001 / ASHRAE 90.1, and justify next year's maintenance budget with hard dollar savings.
Impact: audit-ready in minutes, not days
Energy Savings Breakdown
Where the 15–30% HVAC energy savings actually come from
When you deploy a CMMS to track and optimize HVAC kWh per square foot, the savings are not abstract — they map to specific, measurable maintenance actions. Here is the typical savings stack from CMMS-driven HVAC energy management.
Coil & condenser cleaning
Fouled evaporator and condenser coils can increase compressor kWh by 10–30%. Quarterly PM-cleaning schedules in OxMaint keep heat-transfer surfaces at design efficiency.
Filter replacement optimization
Dirty filters raise fan static pressure and kW draw. OxMaint auto-schedules filter changes based on pressure-drop data, not calendar guesses — cutting fan energy 3–8%.
Economizer & damper repair
A stuck economizer damper wastes free cooling. OxMaint PM checklists flag faulty actuators and link the repair to a measured kWh delta — proving the savings.
Sensor calibration
A CO₂ or temperature sensor drifting 2°F can over-cool an entire zone. OxMaint schedules quarterly calibration PMs and tracks the before/after energy signature.
Setpoint & schedule tuning
OxMaint work orders for seasonal setpoint adjustments and unoccupied setbacks ensure HVAC isn't conditioning empty buildings — a common 5–10% waste source.
Belt, bearing & motor PM
Worn belts and failing bearings increase motor kW. OxMaint vibration and thermal PMs catch mechanical drag early, keeping motor efficiency at nameplate levels.
"OxMaint's submeter integration let us benchmark all 14 buildings in one dashboard. We found two facilities running 28% above the healthcare median and fixed economizer faults within a month — $34K in annual savings we didn't know existed."
"We switched from Excel energy logs to OxMaint and cut our HVAC kWh/sqft from 19.2 to 14.8 in eight months. The PM-to-energy linkage is the killer feature — we can finally show the CFO which maintenance tasks save real money."
See OxMaint benchmark your HVAC kWh per square foot — live
Book a 30-minute demo and we'll load your building data, calculate your kWh/sqft against industry benchmarks, and show you exactly which PMs will close the gap.
FAQ
HVAC kWh per square foot benchmark — frequently asked questions
What is a good HVAC kWh per square foot?
A "good" HVAC kWh per square foot depends on building type and climate, but for a commercial office the benchmark range is 10–22 kWh/sqft annually, with 15.4 as the median. Healthcare facilities run higher (18–33) due to 24/7 ventilation, while warehouses are lowest (3.5–9.8). Anything below your building type's median is considered efficient; anything above the high-end threshold warrants an immediate energy audit and PM review.
How do you calculate kWh per square foot for HVAC?
Divide total HVAC electricity consumption (in kWh) over a 12-month period by the gross conditioned floor area in square feet. For example, 185,000 kWh ÷ 12,000 sqft = 15.4 kWh/sqft. If you don't have dedicated HVAC submetering, estimate HVAC's share as 40–60% of total building kWh. A CMMS like OxMaint automates this by ingesting meter data directly — see how on OxMaint or book a walkthrough.
How much can CMMS-based energy tracking save on HVAC costs?
Facilities that implement CMMS-driven HVAC energy tracking and preventive maintenance typically reduce kWh per square foot by 15–30%, translating to $0.15–$0.45 per sqft in annual savings. The largest contributors are coil cleaning (5–12%), filter optimization (3–8%), economizer repair (4–10%) and setpoint tuning (3–9%). Most deployments pay back in 3–6 months.
What's the difference between HVAC kWh/sqft and building EUI?
HVAC kWh per square foot measures only the heating, ventilation and air conditioning portion of electricity use. Energy Use Intensity (EUI) measures total site energy (electricity + gas + steam + oil) converted to kBtu per sqft. HVAC kWh/sqft is more actionable for maintenance teams because it isolates the equipment they control, while EUI is the standard metric for whole-building benchmarking and ENERGY STAR scoring.
How often should I benchmark HVAC energy intensity?
Benchmark at least quarterly, but ideally monthly or continuously. Annual snapshots miss seasonal drift, failing equipment and schedule creep. With a CMMS, you can track kWh/sqft in real time and receive automated alerts when any building exceeds its benchmark threshold. Schedule a demo at OxMaint's calendar to see continuous benchmarking on your portfolio.
Stop guessing. Start benchmarking HVAC energy with OxMaint.
Join the maintenance teams who've cut HVAC kWh per square foot by 15–30% with automated CMMS energy tracking, preventive maintenance and predictive analytics.
Free 14-day trial · No credit card