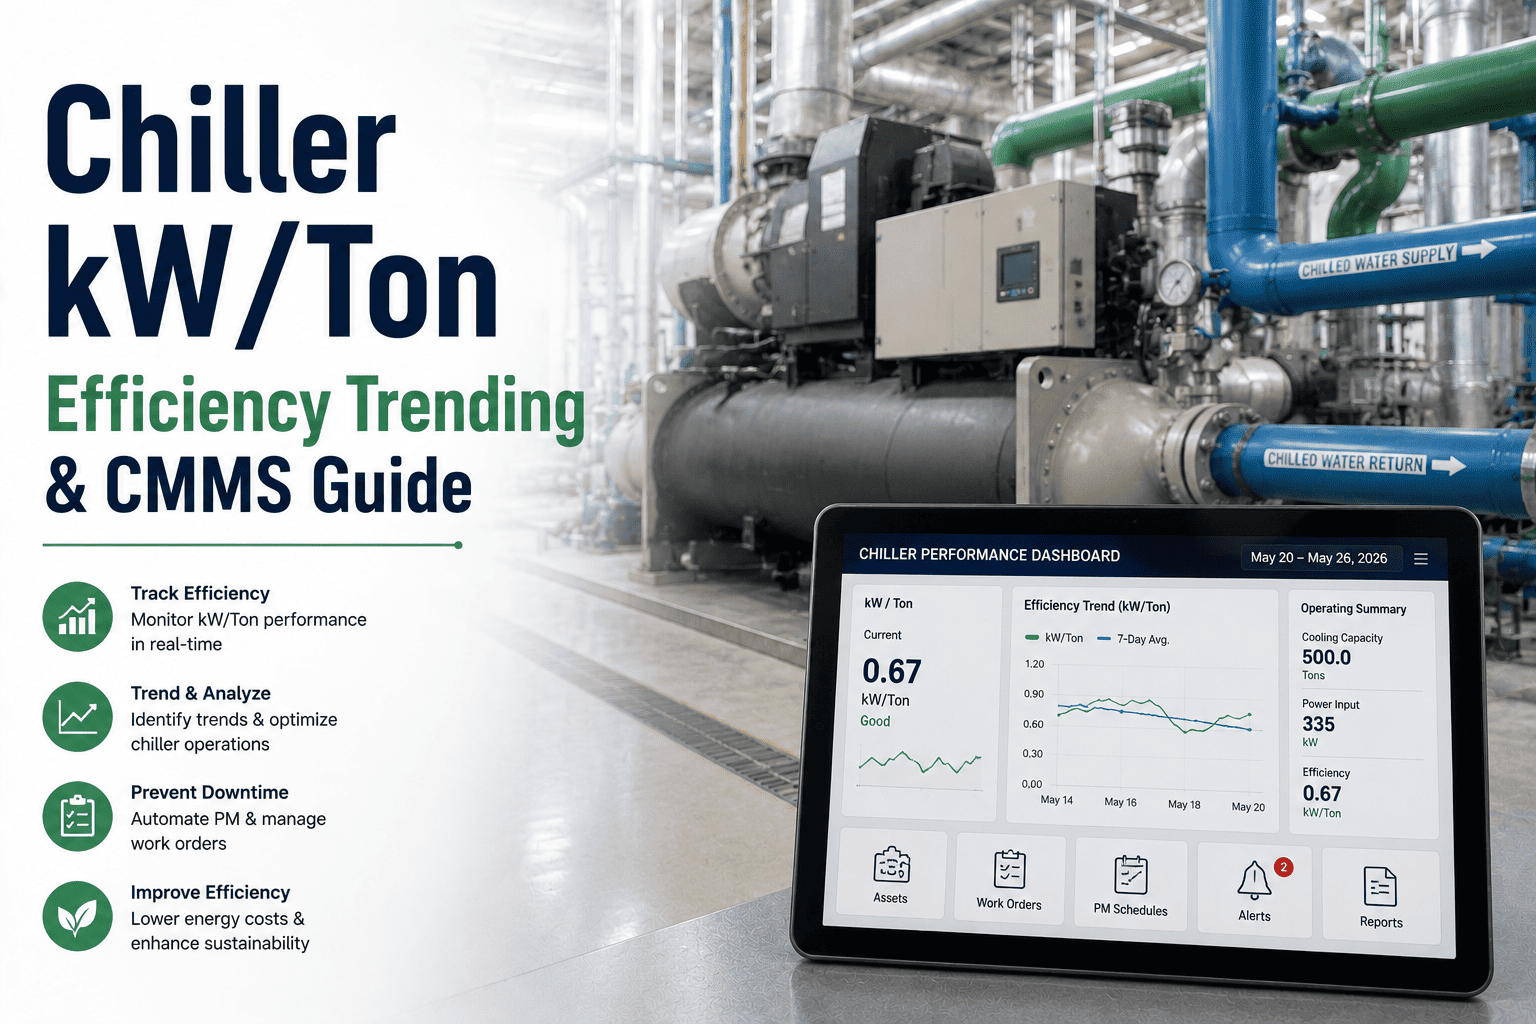
Chiller kW per ton efficiency trending is the single most important metric for controlling energy costs in large HVAC plants — a centrifugal chiller operating above 0.8 kW/ton is quietly bleeding thousands of dollars per month. By continuously tracking chiller efficiency against an established baseline and triggering automated deviation alerts, maintenance teams can catch tube fouling, refrigerant undercharge, and approach-temperature drift before they escalate into major energy waste or unplanned downtime. Modern CMMS platforms like OxMaint make it possible to automate this entire workflow — from kW/ton data capture to work-order generation — so your reliability team stays ahead of efficiency losses. Ready to stop guessing and start trending? Start Free Trial and see your chiller data come alive in minutes.
Is a drift above 0.8 kW/ton draining your energy budget?
Most plants discover chiller inefficiency only after the utility bill spikes. OxMaint continuously tracks chiller kW per ton against your baseline, detects deviation early, and auto-generates corrective work orders — so you catch fouling and refrigerant loss before they cost five figures a month.
What is chiller kW per ton and why trending matters
Chiller kW per ton is the ratio of electrical power input (kilowatts) to cooling capacity output (tons of refrigeration). It is the definitive chiller energy efficiency metric — lower is better. A modern centrifugal chiller at full load typically runs 0.55–0.65 kW/ton; an older or degraded unit can climb past 0.85 kW/ton. At that level, a 500-ton chiller running 4,000 hours per year wastes over $23,000 annually in excess energy compared to baseline performance.
A single kW/ton reading is just a snapshot. Chiller efficiency trending — logging kW/ton daily or hourly and plotting it against a baseline — reveals gradual degradation that point-in-time readings miss. Tube fouling, non-condensables in the refrigerant, condenser water flow restriction, and cooling tower fill degradation each push kW/ton upward slowly enough that operators adapt without noticing. Automated CMMS-based trending makes the drift visible and actionable within days, not months.
How to set a kW/ton baseline and detect deviation
Establishing a reliable baseline requires logging chiller performance under steady-state conditions for 2–4 weeks after a clean-and-inspect cycle. Record kW/ton at 25%, 50%, 75%, and 100% load to capture the chiller's efficiency curve. Once the baseline is set, any sustained deviation of 0.05 kW/ton or more signals that something has changed — and automated CMMS kW ton monitoring should trigger an investigation work order immediately.
Step-by-step: building a chiller efficiency trending program
Clean, inspect, and record baseline
Complete a full tube clean and refrigerant charge verification. Log kW/ton at four load points for 2–4 weeks. This becomes your reference curve inside the CMMS asset record.
Automate continuous kW/ton data capture
Connect BMS or meter data to the CMMS so kW/ton is calculated every 15 minutes. Eliminate manual spreadsheet logging — it misses weekends, nights, and transient load spikes.
Set deviation alerts at 0.05 kW/ton
Configure the CMMS to alert the reliability team when rolling 24-hour average kW/ton exceeds baseline by 0.05 or more. The alert auto-creates a diagnostic work order with checklists for approach temperature, refrigerant charge, and water flow.
Review monthly trend reports
Monthly kW/ton trend charts reveal whether corrections held or degradation is recurring. Share reports with facilities leadership to demonstrate maintenance ROI and justify capital replacements.
The hidden cost of ignoring chiller efficiency tracking
A 180-asset pharmaceutical plant in the Midwest operated two 600-ton centrifugal chillers with no kW/ton trending beyond monthly utility bill reviews. Over eight months, condenser tube fouling pushed average efficiency from 0.62 kW/ton to 0.81 kW/ton — a 31% increase in energy consumption per ton-hour. The plant spent an extra $38,400 on electricity before the annual PM inspection caught the issue. With automated CMMS-based chiller efficiency monitoring and a 0.05 deviation alert, the fouling would have been detected in week 3 — capping the waste at under $4,000 and preventing a downstream capacity shortfall during peak production.
How OxMaint streamlines chiller efficiency CMMS workflows
OxMaint turns kW/ton trending from a manual reporting exercise into an automated, closed-loop maintenance process. Four capabilities map directly to the chiller efficiency problem — each with a measurable outcome for your reliability team.
Automated kW/ton deviation alerts
OxMaint ingests meter and BMS data, calculates kW/ton in real time, and auto-generates a diagnostic work order the moment deviation exceeds your threshold — no spreadsheet exports, no delayed discovery.
Outcome: Catch efficiency drift 80% faster than manual monthly reviewsBaseline tracking per asset
Every chiller asset record stores its baseline kW/ton curve at 25/50/75/100% load. Trend charts overlay current performance so reliability engineers see degradation at a glance during weekly reviews.
Outcome: 5–15% energy savings recovered through early corrective actionPredictive maintenance triggers
OxMaint's AI engine correlates kW/ton drift with approach temperature, oil analysis, and vibration trends to predict tube fouling vs. refrigerant issues — routing the right technician with the right checklist.
Outcome: Cut unplanned chiller downtime 30–50%Audit-ready efficiency reports
Monthly kW/ton trend reports, deviation history, and corrective work-order trails are generated automatically — ready for ISO 50001, ENERGY STAR, and internal sustainability audits without manual compilation.
Outcome: Eliminate 12+ hours per month of manual reportingChiller performance kW/ton comparison by condition
| Chiller Condition | Typical kW/ton | Deviation from Baseline | Annual Cost Impact (500-ton, 4,000 hr) | Recommended Action |
|---|---|---|---|---|
| Optimized, newly commissioned | 0.55–0.62 | Baseline | $0 | Maintain PM schedule |
| Minor tube fouling | 0.65–0.70 | +0.05–0.08 | $6,200–$10,000 | Brush cleaning within 30 days |
| Significant fouling + low charge | 0.75–0.82 | +0.13–0.20 | $16,000–$24,000 | Immediate corrective WO |
| Severe degradation | 0.85+ | +0.23+ | $28,000+ | Emergency service + root-cause analysis |
See OxMaint trend your chillers in real time
Book a 30-minute demo and we'll connect your chiller data, configure kW/ton baselines, and show you deviation alerts firing live on your assets.
Chiller kW/ton efficiency trending — frequently asked questions
What is a good kW/ton for a centrifugal chiller?
A modern, well-maintained centrifugal chiller typically operates at 0.55–0.65 kW/ton at full load. Older units or those with tube fouling, low refrigerant charge, or restricted condenser water flow can drift to 0.75–0.85 kW/ton or higher. A sustained reading above 0.8 kW/ton on a unit rated below 0.65 warrants immediate investigation. Start Free Trial to begin tracking your chiller kW per ton automatically.
How is chiller kW per ton calculated?
kW per ton equals the chiller's electrical power input in kilowatts divided by its cooling capacity in tons of refrigeration. For example, if a chiller draws 420 kW while producing 600 tons of cooling, the efficiency is 420 ÷ 600 = 0.70 kW/ton. Capacity is typically derived from chilled-water flow rate and temperature difference, while power input comes from the chiller's electrical meter.
How often should chiller efficiency trending data be reviewed?
Data should be captured automatically every 15 minutes and reviewed on rolling 24-hour and weekly averages. A formal monthly trend report comparing current kW/ton to baseline should be shared with facilities leadership. Any single deviation exceeding 0.05 kW/ton from baseline should trigger an immediate diagnostic work order rather than waiting for the monthly review.
Can a CMMS automate chiller kW/ton monitoring and alerts?
Yes — a CMMS like OxMaint can ingest meter or BMS data, calculate kW/ton in real time, compare it against the stored baseline, and automatically generate a corrective work order when deviation exceeds a configured threshold. This eliminates manual spreadsheet tracking and ensures deviation is caught within hours rather than weeks. Book a Demo to see automated kW/ton alerts on your chillers.
What causes chiller kW/ton to increase over time?
The most common causes are condenser and evaporator tube fouling, refrigerant undercharge or non-condensables in the system, restricted condenser water flow, degraded cooling tower fill, and worn compressor internals. Each of these reduces heat-transfer efficiency, forcing the compressor to work harder and draw more power per ton of cooling. Regular water-treatment PM, tube cleaning, and approach-temperature monitoring keep kW/ton near baseline.
Stop paying for chiller inefficiency you can't see
OxMaint connects your meter data, builds kW/ton baselines, and fires deviation alerts the moment your chillers drift — so your team acts in hours, not months.
Free 14-day trial · No credit card