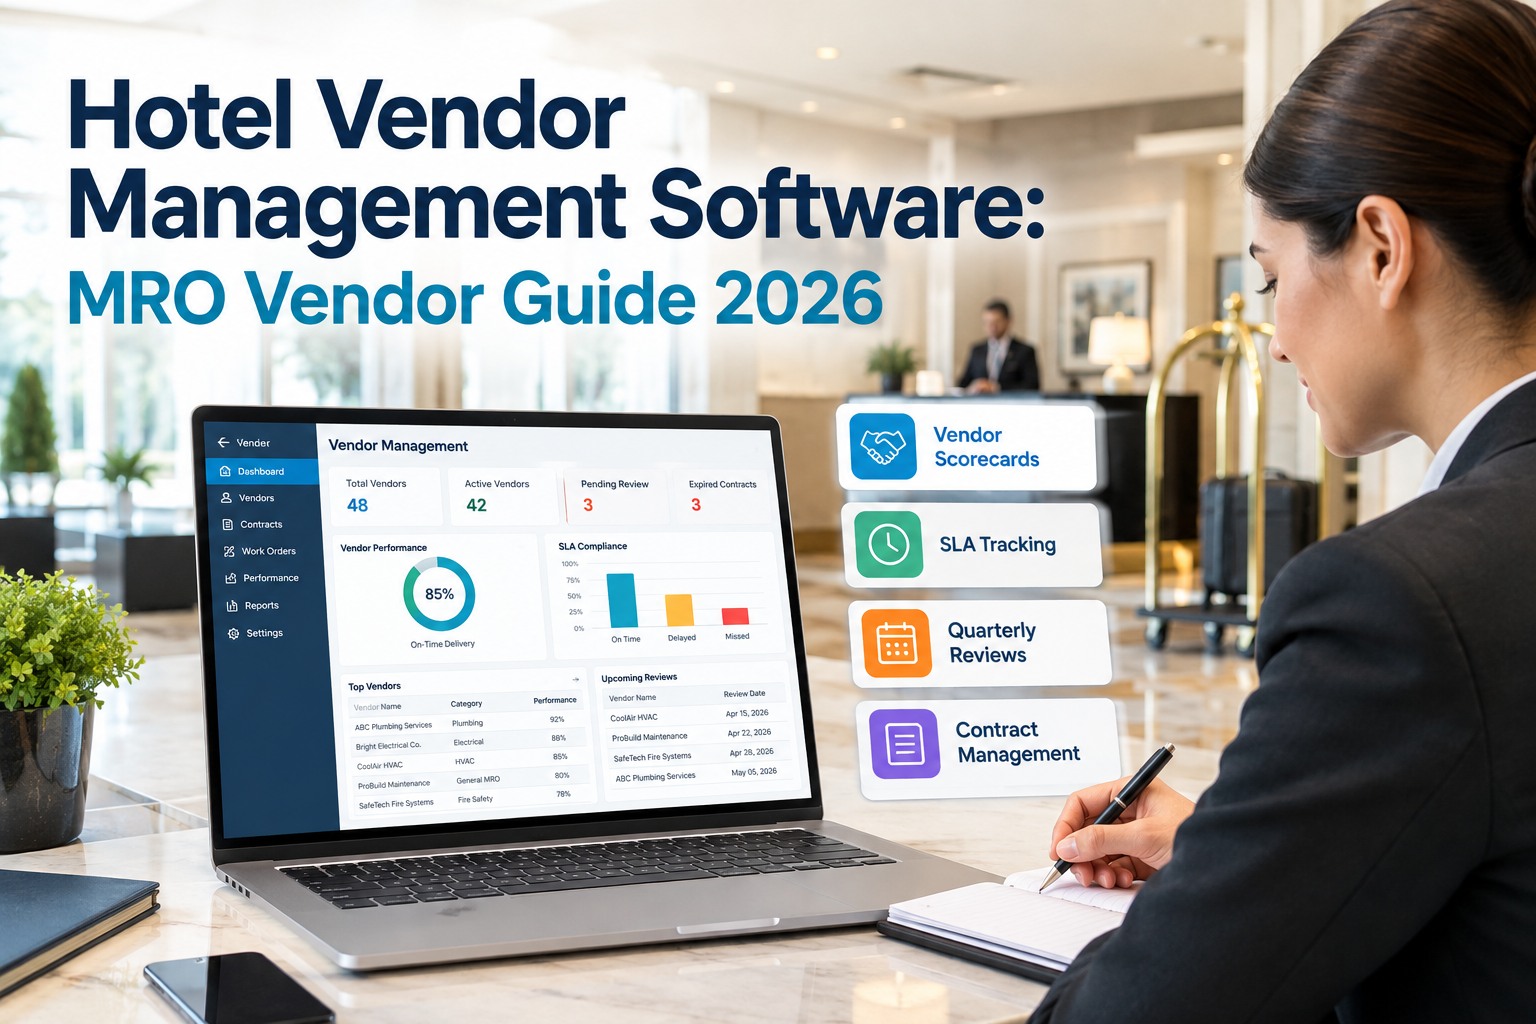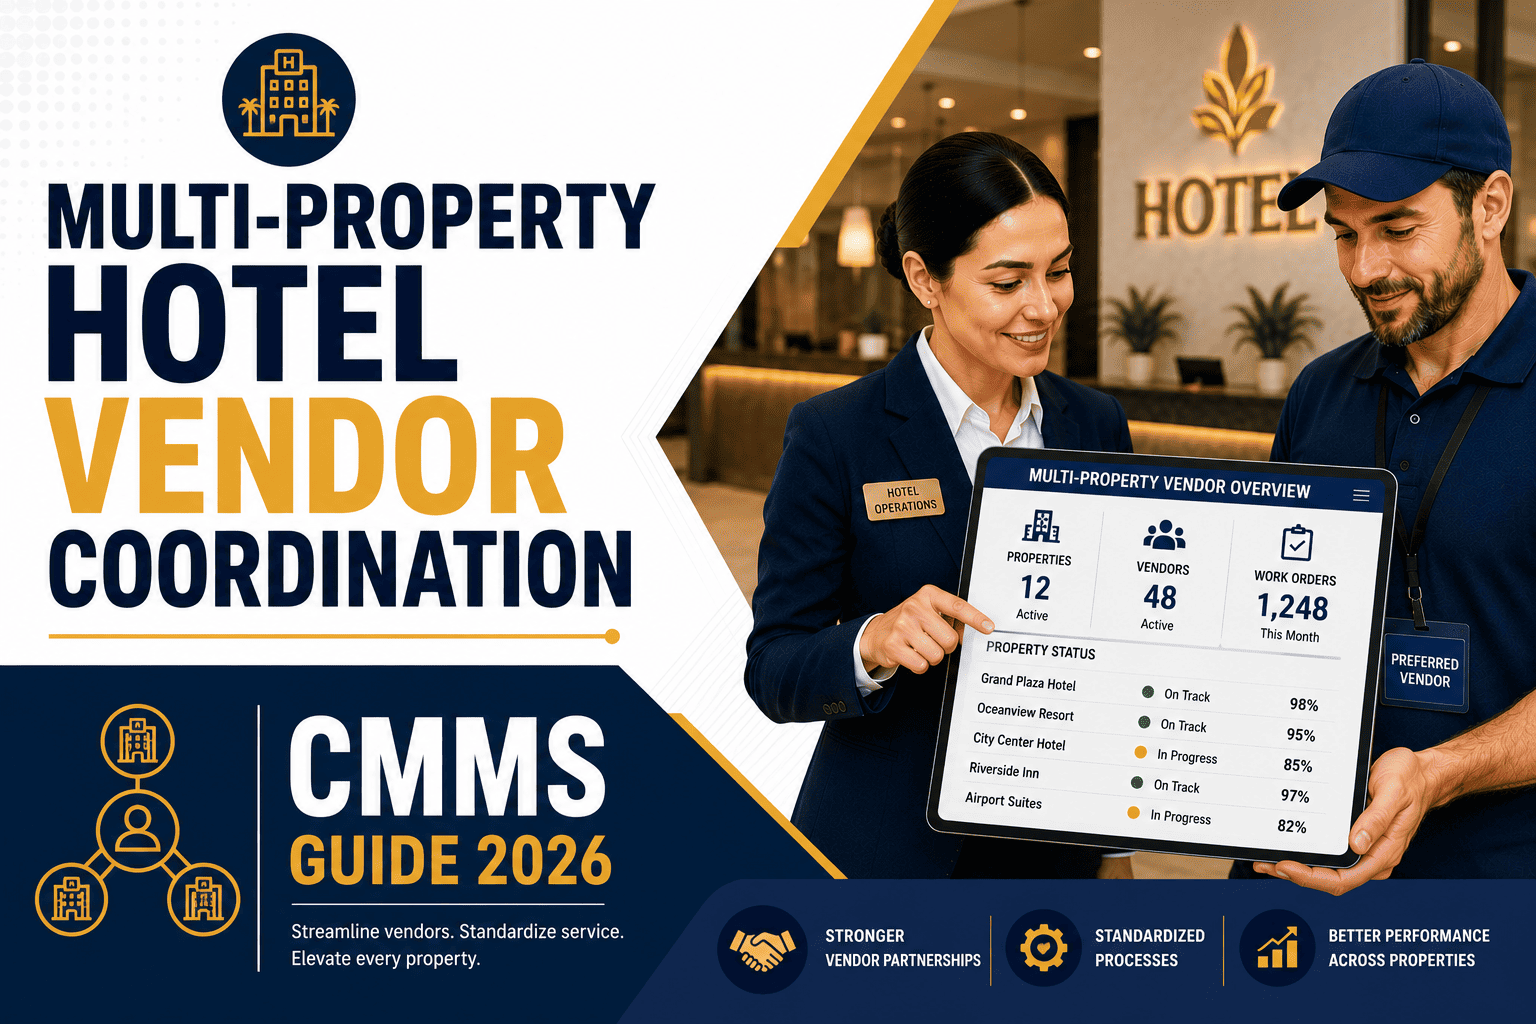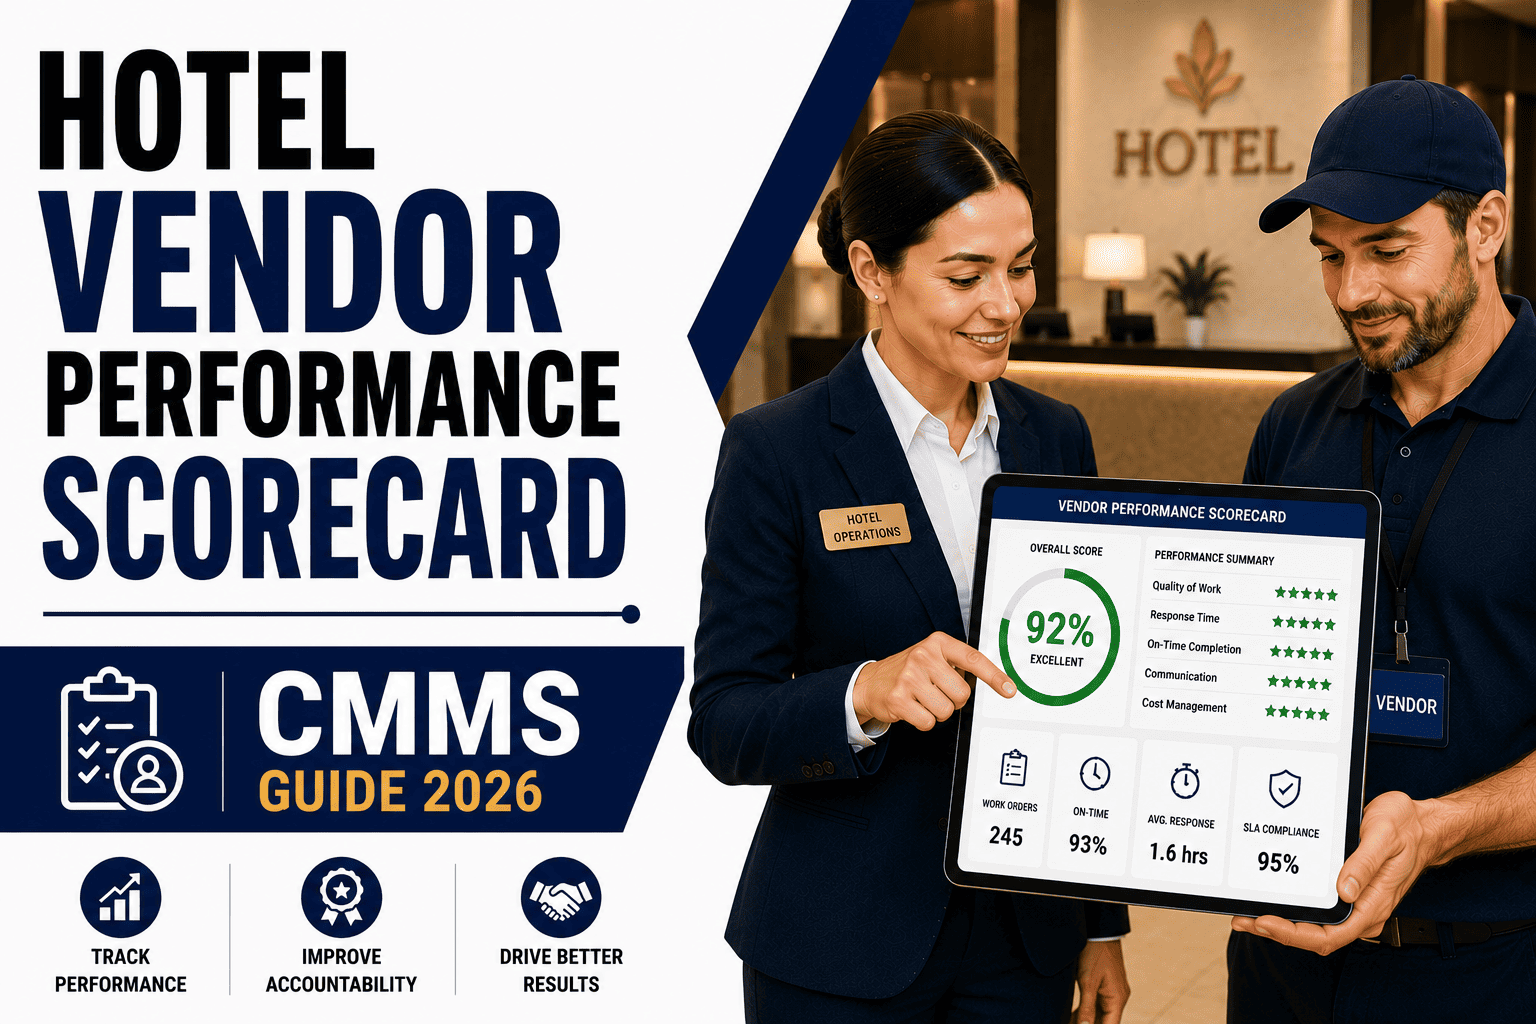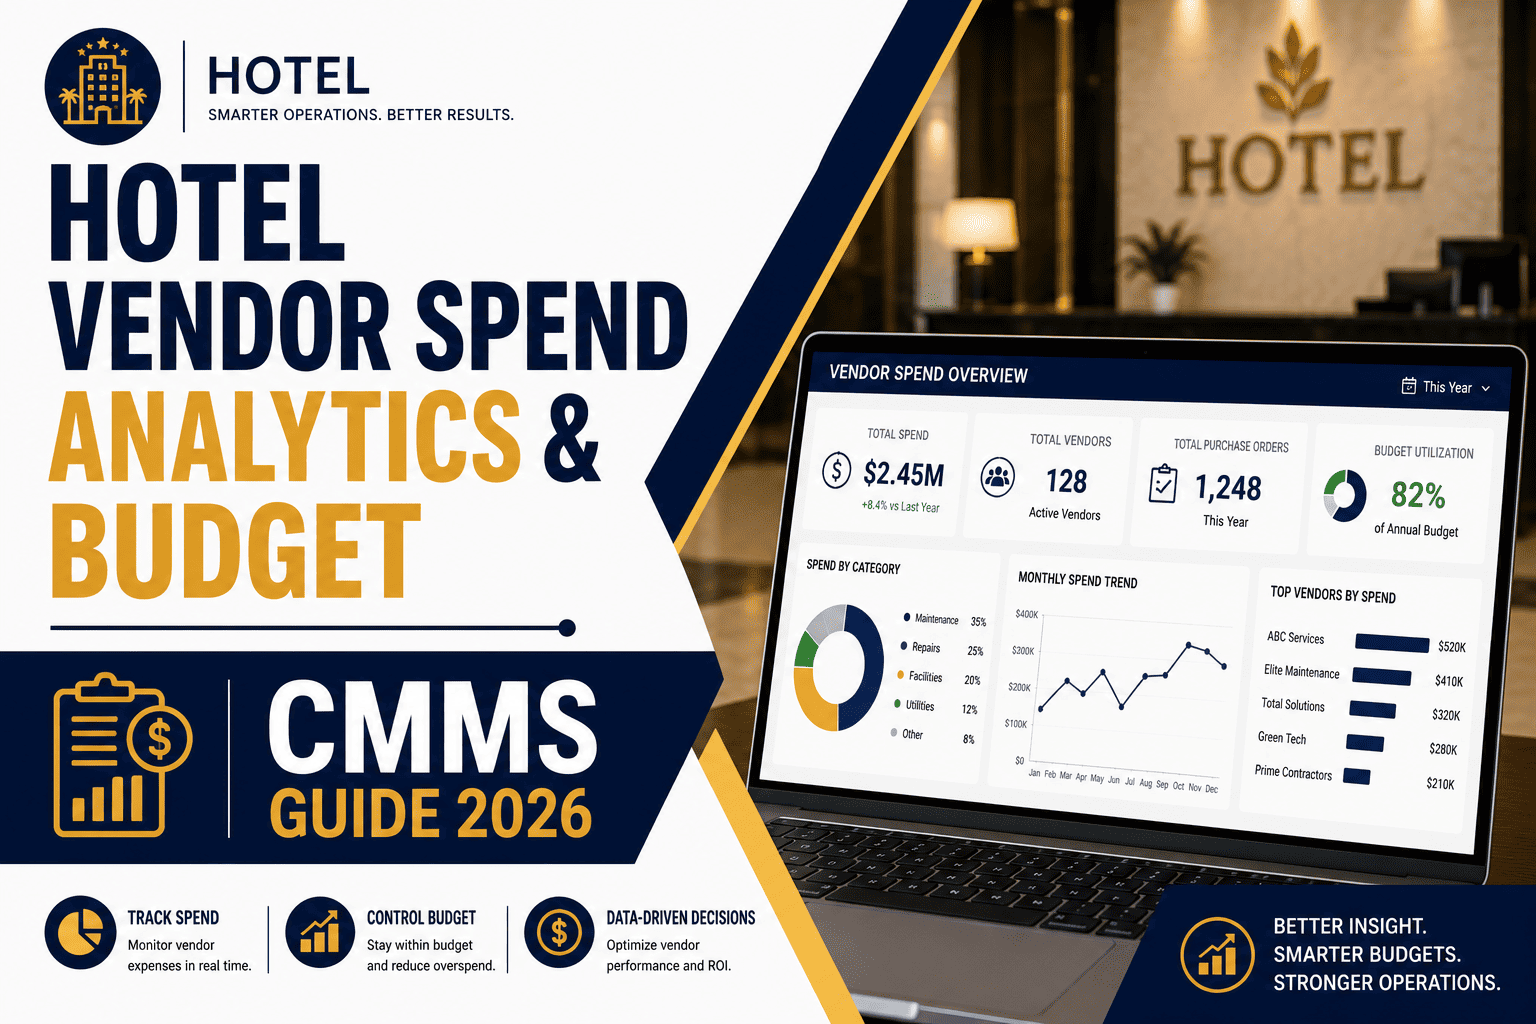
Hotel vendor spend analytics turns scattered contractor invoices across multiple properties into a single, auditable budget picture — and when paired with a budget CMMS built for hotel operations, it becomes one of the fastest ways to find 8–14% in documented savings. This 2026 spend analytics guide covers how GMs, directors of engineering and regional VPs categorize total contractor spend by trade and property, benchmark vendors against each other, and use CMMS-based vendor cost reporting to close budget-variance gaps before quarter-end. Whether you manage a single full-service hotel or a 40-property portfolio, the framework below shows exactly how to consolidate, analyze and act on vendor data — and how OxMaint automates the entire workflow. Ready to replace spreadsheets with real spend intelligence? Start Free Trial and see your vendor data unified in under 48 hours.
Can you see every contractor dollar — by trade, by property, by month?
Most hotel portfolios lose 8–14% of annual vendor spend to duplicate invoices, unbudgeted emergency calls and untracked rate creep across properties. A budget CMMS with built-in spend analytics surfaces those dollars in minutes, not quarters.
Why hotel vendor spend analytics is the highest-ROI capability you haven't built yet
A 250-room full-service hotel typically spends $180K–$420K per year on outside contractors — HVAC, plumbing, electrical, pest control, elevator, fire-life-safety, landscaping and pool. Across a 15-property portfolio that exceeds $3M. Yet most engineering and facilities teams track that spend in three disconnected places: AP software (invoices), Excel spreadsheets (budgets) and work-order logs (paper or siloed CMMS). The result is predictable: budget-variance surprises at month-end, duplicate payments, rate creep nobody catches, and zero benchmark data to negotiate better contracts.
The fix isn't more spreadsheets — it's a CMMS with vendor spend analytics built into the work-order lifecycle. When every contractor work order carries a cost category, a vendor ID, a property tag and a budget code, you get real-time spend visibility the moment an invoice is approved, not 30 days later. That's the core premise of this guide: clean data in, documented savings out.
How to categorize total contractor spend by trade and property
Vendor spend analytics starts with a consistent trade taxonomy applied across every property. Without it, you can't benchmark an HVAC vendor at Hotel A against an HVAC vendor at Hotel B — and you certainly can't tell regional management where the money is going. The framework below is the industry-standard categorization used by hotel engineering teams running a budget CMMS.
Mechanical & HVAC
Chiller service, boiler repair, RTU replacement, PTAC maintenance, refrigeration. Typically 28–35% of contractor spend in a full-service hotel. Tag every work order with the specific asset ID for true cost-to-serve tracking.
Plumbing & Water
Leak response, drain clearing, water heater service, backflow testing, pool equipment. Emergency calls dominate — a CMMS with PM scheduling cuts this category 20–30% by shifting to planned work.
Electrical & Life-Safety
Panel work, generator service, fire alarm testing, sprinkler inspection, emergency lighting. Compliance-driven — missed inspections risk fines and guest-safety liability. Track by compliance code and due date.
Vertical Transport
Elevator service contracts, escalator maintenance, dumbwaiter repair. Often the single largest line item — $25K–$60K per elevator annually. Category-level benchmarking exposes contract overcharges fast.
Janitorial, Pest & Landscaping
Recurring service contracts — high volume, low per-invoice value, easy to lose in the noise. A CMMS with scheduled-work-order templates auto-flags rate increases the moment a new invoice deviates from the baseline.
Specialty & General
Roofing, painting, flooring, AV, kitchen equipment, laundry. Catch-all for one-off projects — tag with a capital-vs-operating flag so project spend never distorts your recurring maintenance budget variance.
Finding vendor consolidation opportunities across your hotel portfolio
A 12-property hotel group often has 4–6 different HVAC vendors, 3 plumbing contractors and 2 elevator service companies — none of whom know the portfolio's total spend exists. Consolidating to 1–2 preferred vendors per trade across the portfolio typically yields 10–18% rate reductions through volume negotiation, plus reduced admin overhead and standardized SLA terms. But you can't consolidate what you can't see. Here's the worked example:
Map every active vendor by trade and property
Pull 12 months of AP data and cross-reference against work-order logs. You'll find ghost vendors (still in AP, no recent work), duplicate vendors (same trade, different names) and shadow vendors (working without a master service agreement).
Benchmark unit-cost rates across the portfolio
Compare hourly rates, trip charges and per-asset service costs for identical work. The spread is usually shocking — one property paying $185/hr for HVAC while another pays $135/hr for the same certification level.
Negotiate portfolio-level contracts with top 2 per trade
Bring documented spend volume to the table. A vendor seeing $260K in guaranteed annual work across 12 properties will cut rates 10–18% and accept standardized SLA terms — impossible to negotiate when spend is fragmented.
Load preferred-vendor list into your CMMS
Every work order must auto-assign to an approved vendor at the negotiated rate. Unapproved vendors trigger an approval workflow — this single control eliminates shadow spending within 60 days.
CMMS hotel budget variance tracking: benchmark vendors against each other
Budget variance in hotel maintenance isn't just "we spent more than planned" — it's a diagnostic signal. A 15% positive variance in plumbing at Property B might mean aging infrastructure needs capital replacement, or it might mean the vendor is overcharging for emergency calls. A budget CMMS with spend analytics turns that variance into an actionable comparison. The table below shows the kind of benchmark report OxMaint generates automatically — something most hotel teams build by hand in Excel each month, if they build it at all.
| Trade Category | Annual Budget | YTD Actual | Variance % | Vendor Count | Top Vendor Share | Action Flag |
|---|---|---|---|---|---|---|
| Mechanical / HVAC | $108,000 | $97,200 | -10.0% | 5 | 52% | Consolidate to 2 |
| Plumbing & Water | $54,000 | $71,800 | +32.9% | 4 | 61% | Investigate PM gaps |
| Electrical & Life-Safety | $42,000 | $39,100 | -6.9% | 3 | 70% | On track |
| Vertical Transport | $132,000 | $145,200 | +10.0% | 2 | 88% | Review contract terms |
| Janitorial & Pest | $36,000 | $37,400 | +3.9% | 6 | 34% | Consolidate to 3 |
| Specialty / General | $48,000 | $62,500 | +30.2% | 9 | 22% | Capital vs opex review |
The plumbing variance (+32.9%) is the immediate red flag. With a budget CMMS, you drill from that number to the underlying work orders in two clicks — and discover that 68% of the overspend is emergency leak response at two properties with aging water heaters that should have been replaced under capital budget. That insight shifts $18K from reactive opex to planned capex, and the variance becomes a capital-planning input rather than a budget surprise.
How OxMaint's CMMS turns vendor spend data into documented budget savings
OxMaint is an AI-powered CMMS and EAM platform built for maintenance and reliability teams — and its vendor spend analytics module was designed specifically for multi-property hotel operations. Every work order, every invoice, every asset and every budget code lives in one system, so spend analytics isn't a separate report you run at month-end — it's a live dashboard your GMs, directors of engineering and regional VPs see in real time. Here's how the pieces map to measurable outcomes:
Real-time vendor spend dashboard
Every approved invoice updates the spend dashboard by trade, property, vendor and budget code — no month-end export needed. GMs see budget variance the day it happens, not 30 days later.
Vendor benchmarking & rate alerts
OxMaint auto-compares hourly rates, trip charges and per-asset costs across all vendors in a trade category — and flags any invoice that exceeds the portfolio average by a threshold you set.
Approved-vendor workflow controls
Work orders auto-route to preferred vendors at contracted rates. Any unapproved vendor triggers an approval chain — eliminating shadow spending and off-contract invoices portfolio-wide.
Predictive maintenance to shift reactive → planned
OxMaint's AI analyzes asset history and sensor data to predict failures before they become emergency calls — the single biggest driver of plumbing and HVAC budget overruns in hotels.
"Within the first quarter on OxMaint, we found $61,000 in vendor overspend across our 14-property portfolio — duplicate HVAC contracts at three hotels and a plumbing vendor charging 40% above the portfolio average. The spend dashboard paid for the platform in six weeks."
From spreadsheets to spend analytics: a 4-month rollout timeline
Most hotel portfolios assume a CMMS implementation takes 6–12 months. OxMaint's guided onboarding gets a multi-property team live on vendor spend analytics in 90–120 days — because the platform's AI-assisted asset import, vendor migration and work-order template library handle the heavy lifting that traditionally stalls deployments.
Data foundation & asset import
Import asset registers, vendor lists, historical work orders and budget codes. OxMaint's AI auto-cleans duplicate assets, maps vendor names and categorizes 12 months of spend by trade in under 48 hours.
Work-order workflows live
Every property goes live on digital work orders with vendor assignment, cost capture and budget-code tagging. Paper work orders retired. GMs get real-time spend visibility dashboards.
First spend analytics review
Run the first portfolio-wide vendor benchmark report. Identify consolidation targets, rate outliers and budget-variance drivers. Begin preferred-vendor negotiations with documented spend data.
Consolidation & PM optimization
Execute vendor consolidation. Launch predictive maintenance schedules on top failure assets. Documented savings begin hitting the P&L — typically $30K–$80K in the first quarter post-optimization.
See OxMaint's vendor spend analytics on your hotel's data
Book a 30-minute demo and we'll load a sample of your vendor spend into the dashboard live — you'll see budget variance, consolidation opportunities and rate benchmarks before the call ends.
Hotel vendor spend analytics & budget CMMS: frequently asked questions
What is hotel vendor spend analytics and why does it matter in 2026?
Hotel vendor spend analytics is the process of consolidating, categorizing and benchmarking all contractor spending across a hotel portfolio — by trade, property, vendor and budget code. In 2026 it matters because contractor costs have risen 12–18% since 2022 while hotel operating margins remain thin, making untracked spend a direct threat to NOI. A CMMS with built-in spend analytics turns this from a manual month-end exercise into a real-time dashboard.
How does a budget CMMS track hotel vendor spend differently than Excel?
A budget CMMS captures cost data at the source — the work order — rather than relying on AP data exported to spreadsheets after the fact. Every contractor work order in OxMaint carries a vendor ID, trade category, property tag, asset ID and budget code, so spend is categorized the moment an invoice is approved. Excel can't do this because it has no connection to the work-order lifecycle; you're always reconciling after the money is spent.
How much can a hotel save with vendor spend analytics and consolidation?
Most hotel portfolios find 8–14% in documented annual savings within the first 90 days of implementing spend analytics. The breakdown is typically 10–18% from vendor consolidation, 20–30% from shifting emergency calls to preventive maintenance, and 5–8% from eliminating duplicate or off-contract invoices. For a 12-property portfolio spending $1.2M on contractors, that's $96K–$168K recovered annually. Start Free Trial to see your numbers.
What's the difference between budget variance and spend variance in hotel maintenance?
Budget variance compares actual spend against the planned budget for a period — the number your GM and regional VP care about. Spend variance compares current spend against a benchmark (prior year, portfolio average or per-unit cost) — the number your engineering team uses to find inefficiencies. A good CMMS dashboard shows both: budget variance flags where you're over plan, spend analytics explains why.
How long does it take to implement a CMMS for hotel vendor spend tracking?
With OxMaint, a typical multi-property hotel portfolio goes live on vendor spend analytics in 90–120 days. The AI-assisted onboarding handles asset import, vendor list cleanup and 12-month spend categorization within the first 30 days. Full work-order workflows, dashboards and the first benchmark report are live by Month 3. Book a Demo to see a tailored implementation plan for your portfolio.
Stop guessing where your contractor dollars go
Join the hotel engineering teams using OxMaint to track every vendor dollar, benchmark every trade and close budget-variance gaps before they hit the P&L.
Free 14-day trial · No credit card