Most hotel engineering teams know what they spend. Very few know whether what they spend is too much, too little, or in the wrong places. Maintenance cost per room is the single most useful number for answering that question — and most properties either do not track it, or track it in ways that make comparison impossible. This guide breaks down the benchmarks, explains what drives costs above or below them, and shows how a CMMS gives you the visibility to act on the numbers. Sign up free or book a demo to see your maintenance costs tracked automatically from day one.
Industry Benchmarks: Maintenance Cost Per Room Per Year
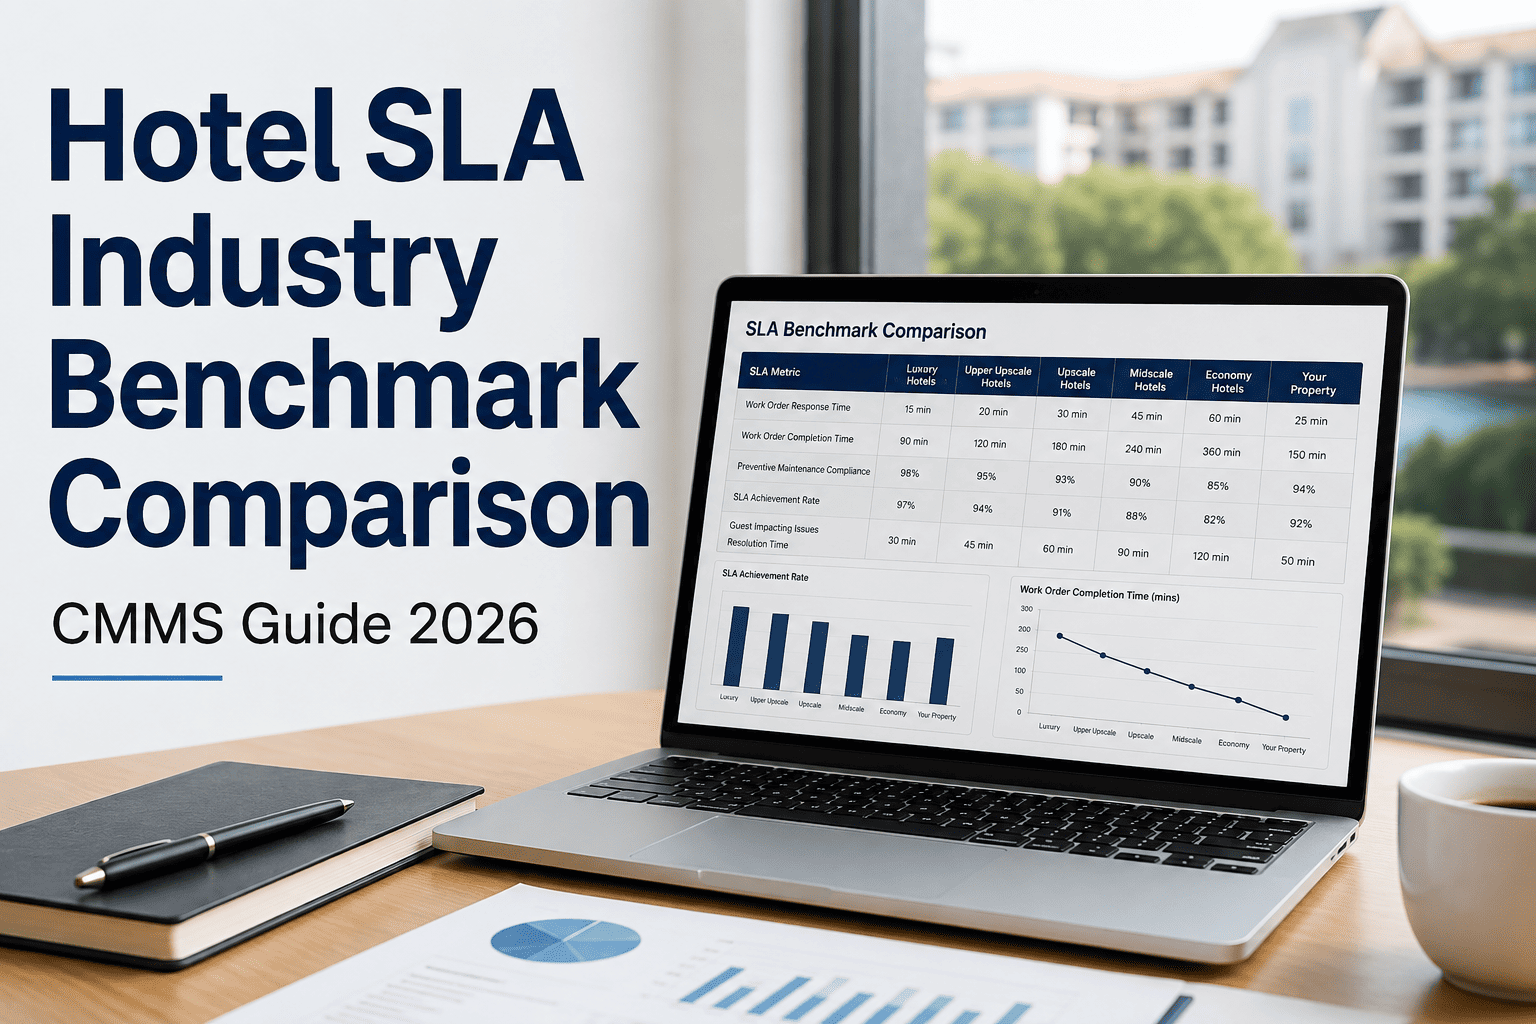
Maintenance cost per room per year varies significantly by property type, age, location, and service level. The figures below are widely cited reference points used by hotel operators and asset managers to assess operational efficiency. They cover direct maintenance spend — labor, parts, and contractors — but exclude capital expenditure and major refurbishment programs.
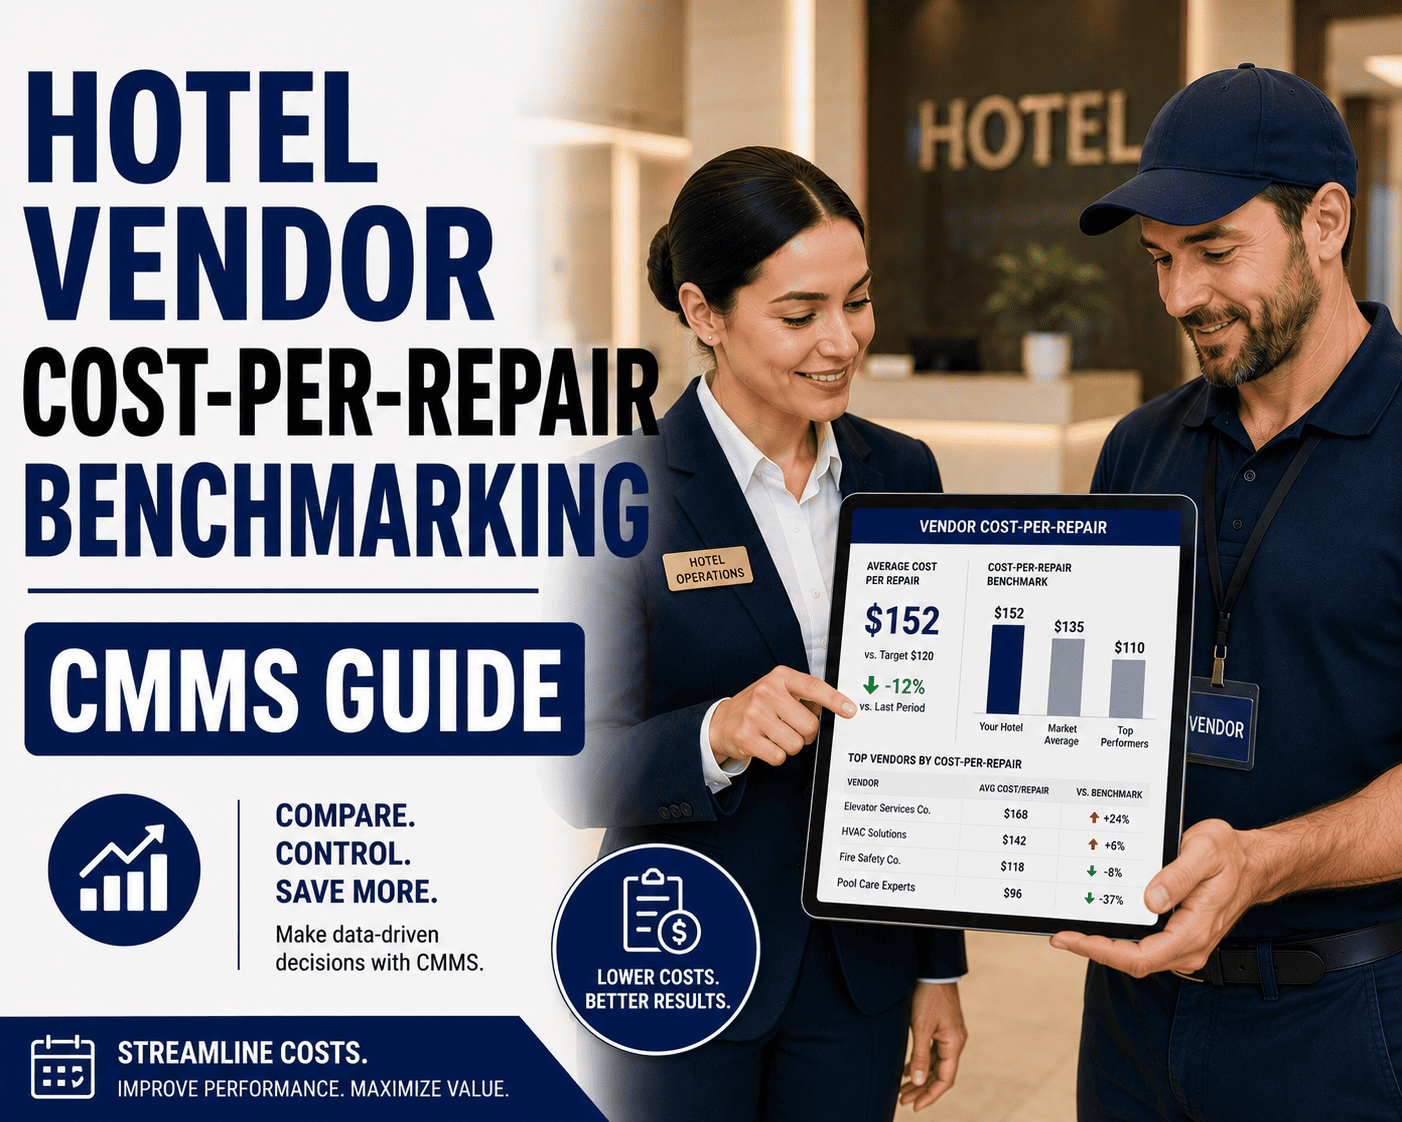
If your cost per room sits significantly above your segment benchmark, the gap is almost always explained by one of three things: a reactive maintenance ratio that is too high, parts and contractor spend that is not tied to work orders, or labor hours that are not tracked against specific assets. A CMMS solves all three by making every cost visible and attributable. Start free with OxMaint and begin capturing the data that makes benchmarking meaningful.
How to Calculate Your Maintenance Cost Per Room
What Drives Maintenance Costs Above Benchmark
The KPIs That Sit Behind Cost Per Room
How CMMS Reduces Cost Per Room
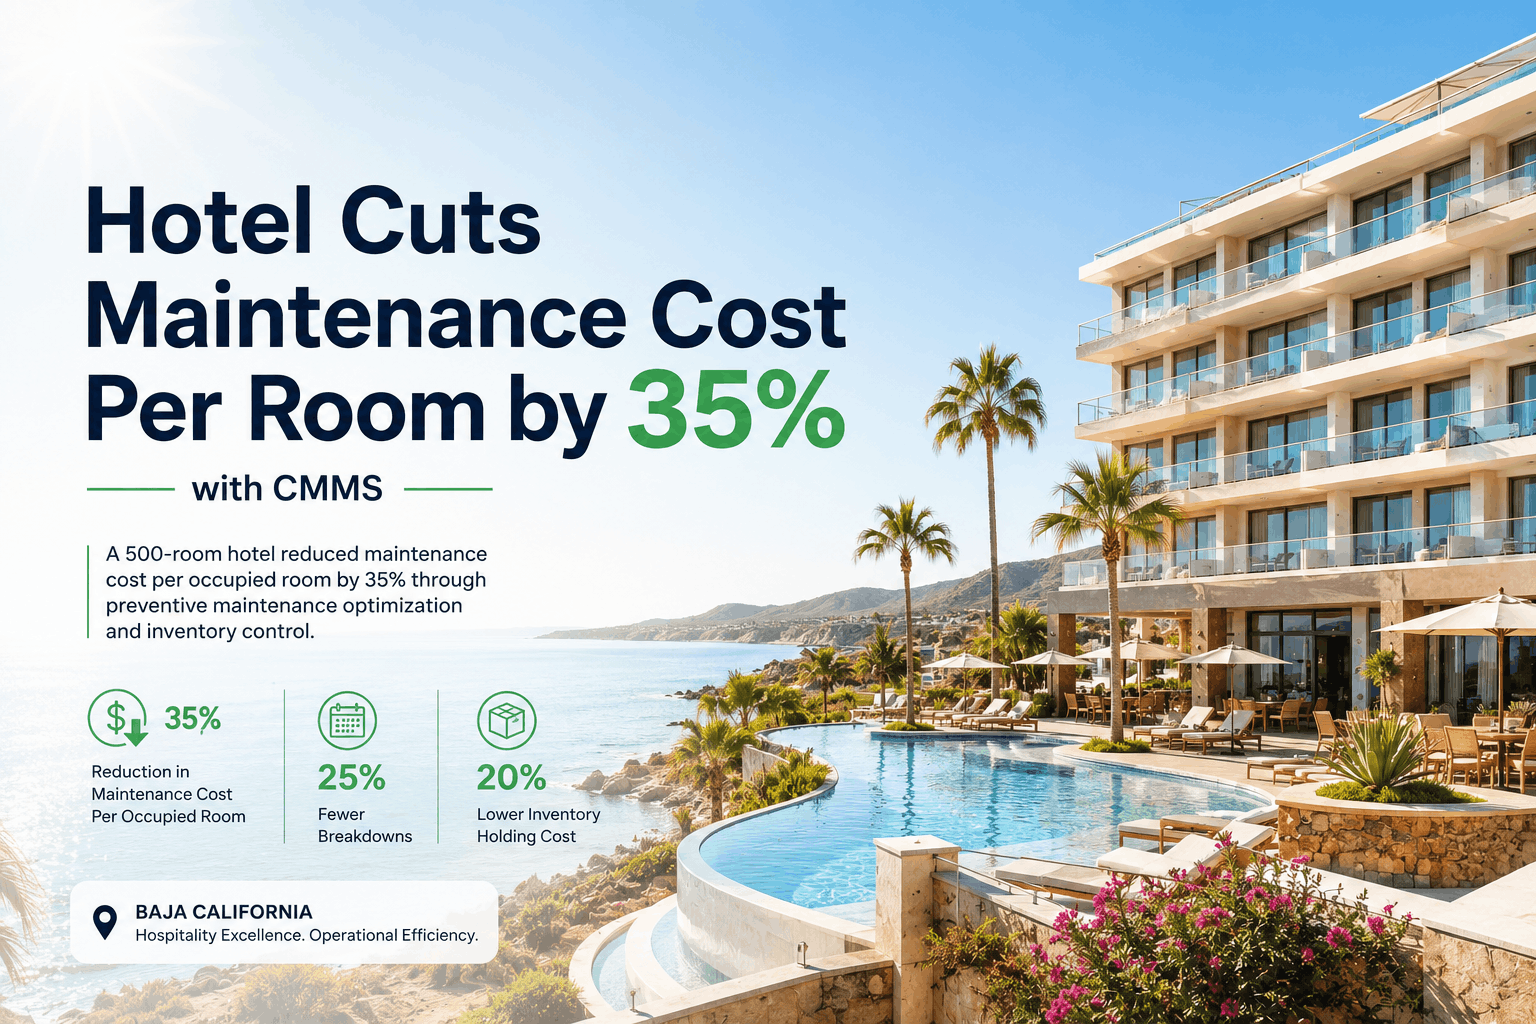
The cost reduction from a CMMS is not theoretical — it follows directly from three operational changes. First, preventive maintenance completion rates rise because tasks are generated, assigned, and tracked automatically. When more work happens on schedule, less work happens as emergency repairs at premium cost. Properties that shift from 60% reactive to 40% reactive typically see a 20 to 30 percent reduction in total maintenance spend within the first year.
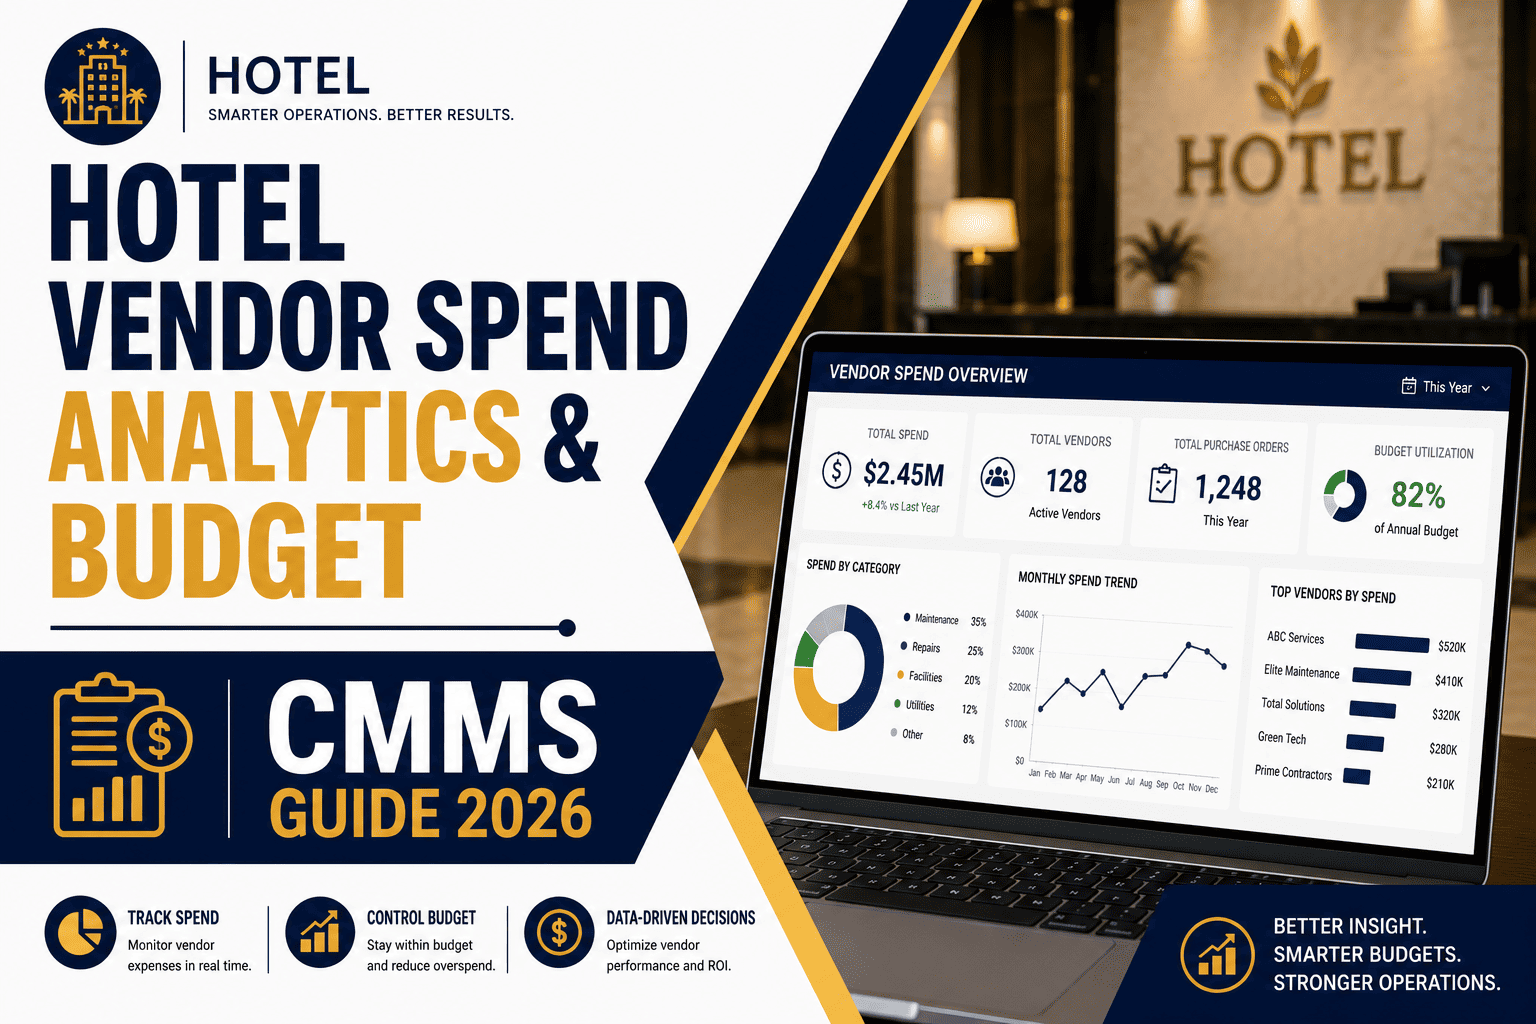
Second, parts and contractor spend becomes attributable. Every purchase is linked to a work order, every work order is linked to an asset, and every asset accumulates a cost history that reveals which equipment is consuming disproportionate budget. This visibility alone enables smarter procurement decisions, better contractor scope control, and earlier identification of assets that are cheaper to replace than to maintain.
Third, labor is deployed more efficiently. Technicians with a structured daily schedule and mobile work orders spend less time on coordination, travel between tasks, and hunting for parts. OxMaint customers consistently report 30 to 40 percent improvement in tasks completed per technician per day — which translates directly into lower cost per work order and lower cost per room. Book a demo to see the cost analytics dashboard in action, or sign up free and start tracking your numbers today.
Cost Reduction: What Hotels Achieve
Frequently Asked Questions
What is a good maintenance cost per room benchmark for a full-service hotel?
Full-service and upscale hotels typically spend between $1,200 and $2,000 per room per year on direct maintenance costs. Properties above $2,500 per room should examine their reactive maintenance ratio, contractor spend, and parts procurement process, as these are the most common sources of above-benchmark cost.
How does OxMaint track maintenance cost per room?
OxMaint links labor hours, parts consumed, and contractor invoices to specific work orders and assets. The cost analytics dashboard aggregates this data by room, floor, asset category, or property — giving you real-time cost per room figures without any manual calculation or spreadsheet work.
What reactive-to-planned maintenance ratio should hotels target?
Industry best practice targets a reactive ratio below 40% of total maintenance hours — meaning at least 60% of work should be planned and preventive. Most hotels running without a structured CMMS operate at 60 to 80% reactive, which is the primary driver of above-benchmark maintenance cost.
How quickly will a CMMS reduce my maintenance cost per room?
Most properties begin to see measurable cost reductions within 90 days of deploying a structured PM program. The reactive-to-planned ratio shift drives the fastest savings, with parts and labor efficiency gains building over the following six to twelve months as asset history accumulates.
Can OxMaint generate cost reports for ownership and asset management reporting?
Yes. OxMaint generates exportable maintenance cost reports by property, asset category, time period, and cost type — formatted for ownership reporting, asset management reviews, and management company performance presentations. All reports pull from live work order and inventory data with no manual compilation required.