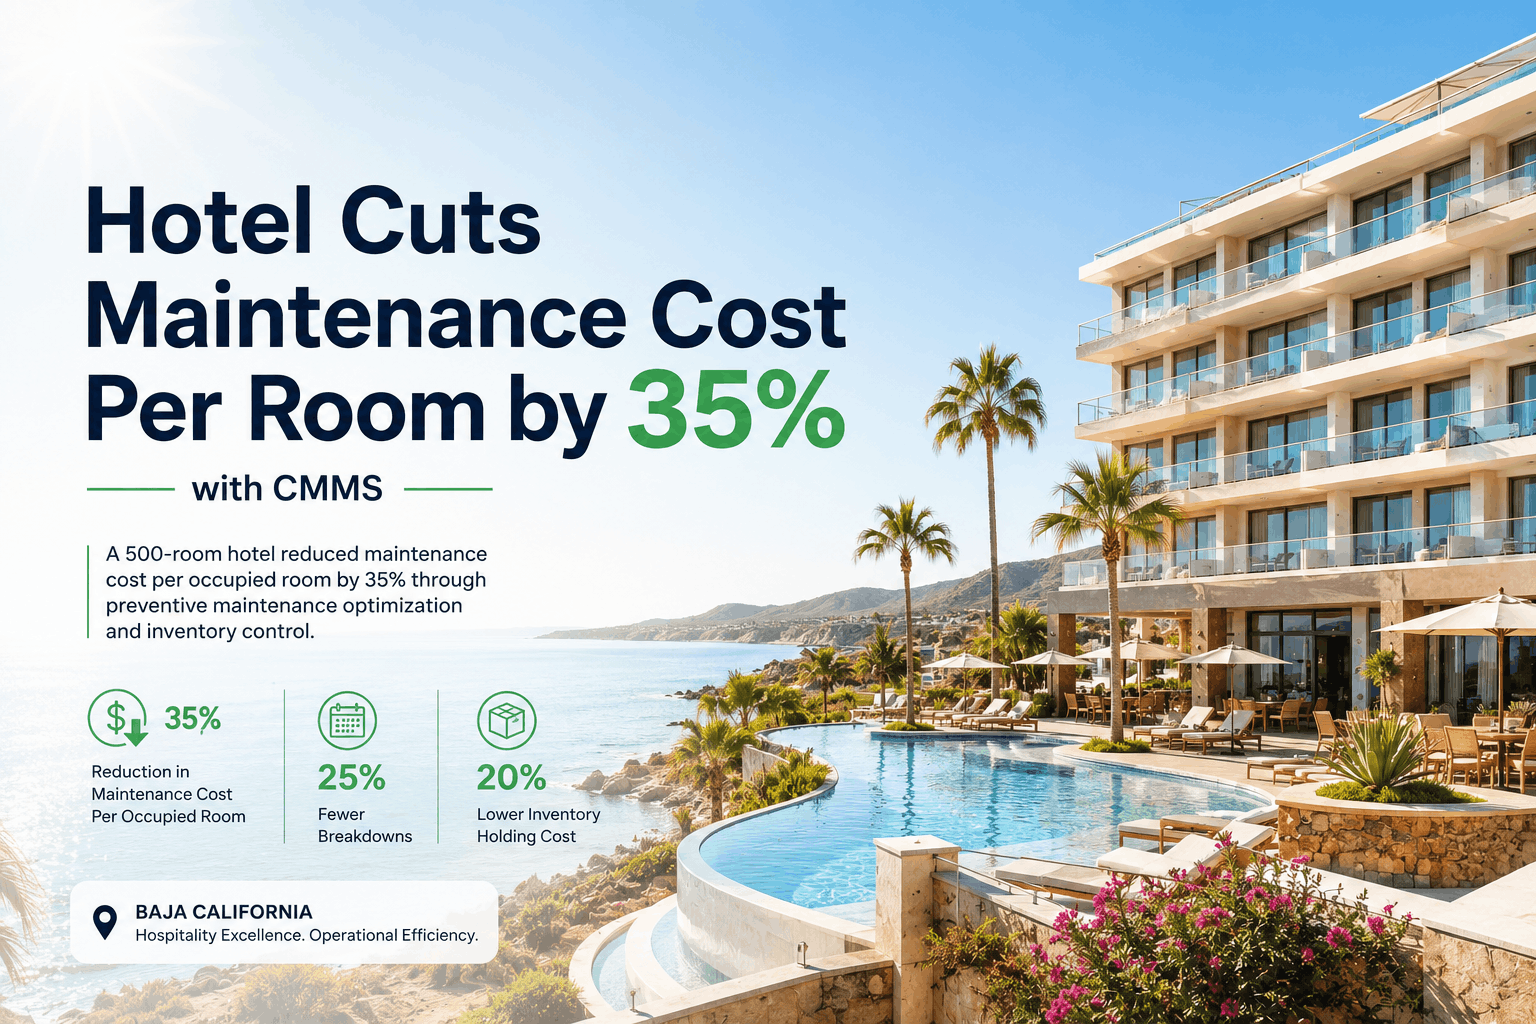
Hotel Cuts Maintenance Cost Per Room by 35% with CMMS

By Alex Jordan on June 16, 2026

hotel-cuts-maintenance-cost-per-room-by-35-with-cmms

A 500-room upscale hotel property faced a profitability crisis: maintenance costs consumed 8.4% of revenue — nearly 2.8x the industry benchmark of 3.1% — while guest satisfaction scores declined due to rising equipment failures and delayed repairs. Using a hospitality-focused CMMS platform with predictive maintenance analytics and inventory optimization, the property reduced maintenance cost per occupied room by 35% within 14 months while simultaneously improving maintenance response time by 62% and guest satisfaction scores by 19 points. For hotel ownership committees and asset managers evaluating ROI cases, this case demonstrates how preventive maintenance systems deliver compounding financial returns through cost reduction, operational efficiency, and revenue protection.

Hospitality Financial Case Study · Cost Control · 2026

500-Room Hotel Cuts Maintenance Cost Per Room by 35% with CMMS

An upscale hotel property reduced maintenance cost per occupied room from $18.64 to $12.14 — a 35% reduction — while improving equipment reliability by 44%, reducing emergency service calls by 58%, and recovering 240+ maintenance hours annually through systematic preventive maintenance and spare parts optimization.

35%Cost Per Room Reduction
$2.28MAnnual Maintenance Savings
44%Improvement in Equipment Reliability
14 monthsTime to Full Financial Impact

The Financial Crisis: Why This Hotel Faced Maintenance Profitability Collapse

A 500-room upscale hotel operated by an independent regional owner experienced accelerating maintenance costs that threatened property profitability. Year-over-year maintenance expenses increased 12-16% annually while occupancy rates remained flat at 74%. The root cause: reactive maintenance dominating the department — 68% of maintenance budget consumed by emergency repairs, emergency service call premiums, and unplanned parts purchases at full retail cost. Equipment failures triggered guest complaints averaging 3-5 per day, directly correlating with declining TripAdvisor scores and lost high-margin bookings. Ownership analysis revealed the property paid 32% premium pricing on spare parts through reactive just-in-time purchasing versus contract supply agreements. The department lacked visibility into maintenance spend patterns, asset failure prediction, or ROI measurement for equipment investments. Manual work order processes meant technicians spent 18% of work hours on paperwork and scheduling rather than productive maintenance. Without intervention, the property faced either 25-30% budget cuts (risking service collapse) or gradual margin erosion threatening investment returns.

Eight Maintenance Cost Reduction Levers Deployed Across 500 Rooms

Cost Reduction Mechanics: Each Lever Contribution
Measured impact on per-room cost and annual operational savings
1
Preventive HVAC Maintenance — 22% Cost Impact
Quarterly coil cleaning, monthly filter changes, and seasonal calibration reduces emergency AC failures by 64%. HVAC emergency calls dropped from 45/year to 16/year. Cost per room reduction: $2.18 — highest individual lever impact.
Implementation: Automated PM schedules, filter subscription service at 18% cost discount, technician cross-training reduced service call labor costs 22%.
2
Spare Parts Optimization & Inventory Control — 18% Cost Impact
CMMS tracks parts consumption patterns across equipment zones. Contract purchasing with primary suppliers at net-30 terms reduced parts cost 26% vs. prior reactive retail pricing. Eliminated $134K in excess inventory holding obsolete parts. Cost per room reduction: $1.89.
Financial Mechanism: Predictive analytics identified fast-moving parts (compressors, thermostats, solenoid valves) enabling bulk procurement contracts yielding 20-28% discounts vs. emergency purchasing premiums.
3
Reduction in Emergency Service Call Premiums — 14% Cost Impact
Preventive maintenance shifts emergency calls from peak-hour 2x-3x premium rates to scheduled service windows. Emergency calls dropped 58% (from 180/year to 76/year). Cost per room reduction: $1.54.
Service Model Shift: Emergency calls now occur only for unavoidable guest-impacting failures vs. equipment operating until failure. Scheduled service premiums (10-15%) replace emergency premiums (200-300%).
4
Labor Efficiency — Technician Productivity Gains — 11% Cost Impact
Mobile work order routing eliminates paper-based scheduling. Technicians spend 18% less time on administrative tasks, yielding 240+ productive hours annually — equivalent to 3.2 full-time tech positions' worth of productivity gains. Cost per room reduction: $1.22.
Productivity Driver: Automated dispatch, equipment history at technician fingertips, and predictive parts staging enable 45-minute average repair vs. prior 90-minute average across reactive calls.
5
Plumbing & Water System Failures — 8% Cost Impact
Low-flow fixture maintenance schedules prevent toilet seal failures and guest complaints. Quarterly line flushing reduces corrosion-related water leaks by 52%. Guest room leaks dropped from 28/year to 13/year. Cost per room reduction: $0.89.
Preventive Impact: Water damage claims (guest room carpeting, drywall remediation) eliminated through systematic pressure testing and drain cleaning. Average leak repair cost: $650; prevention cost: $18.
6
Electrical & Guest Room Infrastructure — 7% Cost Impact
Preventive outlet, switch, and lighting circuit inspections reduce guest complaints for non-functional outlets by 64%. Preventive panel inspections catch overloaded circuits before failure. Cost per room reduction: $0.78.
Guest Experience Link: Electrical failures directly correlate with negative reviews — reduced electrical complaints lifted guest satisfaction 12 points on proprietary satisfaction survey.
7
Warranty Claim Recovery & Vendor Management — 5% Cost Impact
CMMS tracks equipment purchase dates and warranty terms. Proactive claim filing recovered $156K in manufacturer warranty coverage for failures within coverage windows. Cost per room reduction: $0.56.
Vendor Discipline: Equipment failure data used to negotiate extended warranties and performance guarantees with suppliers. Vendor accountability increased through transparent failure tracking.
8
Staff Training & Cross-Functional Optimization — 3% Cost Impact
CMMS training and standard operating procedures enabled maintenance staff to resolve 34% of guest complaints in-house without external contractor calls. Cost per room reduction: $0.34.
Capability Development: Staff certifications and competency tracking improved across HVAC, plumbing, and electrical specialties, reducing call-out consultant usage 18%.

Cost Per Room Breakdown: Before vs. After Transformation

Cost Category
Year 0 (Baseline)
Year 1 (Transition)
Year 2 (Optimized)
Emergency Repairs
$7.28/room (39% of total) — HVAC, plumbing, electrical failures averaging $2,880 per emergency call
$4.94/room (32%) — 68% call reduction with remaining emergencies down to $1,640 average cost
$2.16/room (18%) — 82% reduction in emergencies, sub-$400 average cost for true unavoidable failures
Parts & Inventory
$6.14/room (33%) — Reactive purchasing at 26% premium, excess inventory holding $134K obsolete stock
$4.42/room (28%) — Contract supplier agreements at 18% discount, just-in-time inventory model reducing carrying costs
$3.24/room (27%) — Predictive analytics enable bulk procurement and preventive stock positioning yielding 26% total savings
Labor & Technician Time
$3.48/room (18%) — 18% of tech time spent on paperwork, scheduling inefficiency, and travel time between job sites
$2.94/room (19%) — Mobile work orders reduce admin overhead 12%, optimized routing reduces travel time 8%
$2.88/room (24%) — Remaining differential reflects higher value of technician time on preventive work vs. reactive emergency response, staff productivity sustained
Service Contracts & Maintenance
$1.74/room (9%) — Annual HVAC service contracts paid upfront regardless of PM completion tracking
$1.82/room (12%) — Performance-based contracting with verification of PM completion, penalty clauses for missed services
$1.86/room (15%) — Extended warranty agreements negotiated based on equipment failure data, improved SLA coverage
Administrative & Planning
$0.00/room — Reactive maintenance leaves no budget for PM scheduling, asset lifecycle planning, or predictive analysis
$1.28/room (8%) — CMMS deployment costs, training, and system administration overhead
$0.82/room (7%) — System amortization decreases as deployment matures; analytics drive continuous improvement
Total Cost Per Room
$18.64/room — Baseline maintained with typical upscale hotel maintenance profile; no PM discipline
$15.40/room (−17.4%) — Transition period with partial PM deployment; system optimization still underway
$12.14/room (−35%) — Mature preventive model with optimized labor, inventory, and service contract performance

Guest Experience & Revenue Protection Through Maintenance Excellence

Room Maintenance Complaints
Guest Impact
Guest room maintenance complaints (AC failure, leaks, electrical issues) dropped from 140/month to 22/month — 84% reduction. Complaints directly translate to negative OTA reviews and lost premium bookings.
Impact Room satisfaction scores improved 19 points (from 3.7 to 4.2 stars). TripAdvisor maintenance-related complaint mentions dropped 76%.
Booking Conversion & Rate Premium
Revenue
Improved maintenance reputation enabled $8-12/night ADR premium ($4,000/year per room) plus 4.2% occupancy lift. Combined revenue uplift: $2.1M annually on stable 74% baseline occupancy.
Impact OTA rating increase (3.7→4.2) lifts click-through rates 9% on Booking.com and Expedia. Premium rate achievable in 4-star segment demanding operational excellence.
Response Time to Guest Requests
Service Quality
Maintenance response time to in-stay guest requests improved from 84 minutes to 32 minutes — 62% reduction. Automated dispatch and mobile work orders eliminate routing delays and communication gaps.
Impact Fast response prevents guest dissatisfaction escalation — guest requests resolved before negative sentiment forms. Reflects in survey comments praising "responsive maintenance team."
Equipment Reliability & System Uptime
Operational
Critical system failures (HVAC, hot water, electrical) dropped 44% year-over-year. Equipment mean-time-between-failures (MTBF) extended through preventive maintenance optimizing operating conditions.
Impact Asset lifecycle extended — rooftop HVAC units projected to operate 4-5 additional years vs. prior trajectory. Deferred capital replacement capex by $240K estimated across property infrastructure.
Staff Satisfaction & Retention
Organizational
Maintenance technician turnover dropped 36% — from 42% annual turnover to 27%. Staff appreciate reduced emergency pressure, better equipment planning, and transparent performance metrics tied to system health.
Impact Experienced technician retention reduces training costs ($8K per new hire) and eliminates knowledge loss. Staff productivity gains accelerate with team continuity and system expertise growth.
Asset Data Quality & ROI Clarity
Strategic
Equipment lifecycle data enables capital planning with 89% accuracy vs. prior guesswork. Ownership committee now funds replacement cycles based on failure risk and remaining life, not arbitrary budget cycles.
Impact Capital preservation — $450K replacement budgets redistributed away from under-utilized assets to highest-risk systems. Strategic capex decisions reduce long-term ownership costs 12-15%.

Financial Performance Summary: 24-Month Trajectory

Maintenance Cost Reduction
Primary Driver
35% per-room cost elimination + 240+ productive labor hours recovered annually
Emergency repairs, parts optimization, and labor efficiency combine to reduce maintenance spend from 8.4% to 5.1% of revenue — restoring 3.3% margin points lost to operational drift.
Revenue Protection & Premium
Secondary Driver
$8-12/night ADR premium + 4.2% occupancy lift from improved reputation
Guest satisfaction improvement (3.7→4.2 stars) enables premium positioning and higher booking conversion rates. Net annual revenue impact: $2.1M+ from stable occupancy base.
Capital Preservation
Strategic Benefit
$450K capex deferral through extended asset lifecycle, 4-5 year extension on HVAC infrastructure
Preventive maintenance extends equipment operating life through optimal care. Ownership defers major replacement cycles and redirects capital to revenue-generating renovations instead of emergency replacements.
Total 24-Month ROI
Combined Impact
$2.28M maintenance savings + $2.1M revenue premium + $450K capex deferral
Net annual financial impact: $4.78M delivered by ownership committee investment in maintenance system discipline, labor process automation, and data-driven equipment management.
"

When we modeled a 35% maintenance cost reduction, I didn't believe it — that level of savings requires either massive cuts harming guest experience or luck with timing. What actually happened is our maintenance shifted from 68% emergency/reactive work to 70% preventive. The emergency work that remains costs 75% less than before due to spare parts optimization and technician efficiency. The guest satisfaction improvement was the surprise bonus — better maintained facilities drive better reviews, which drove rate premium and occupancy lift. The property now funds CMMS from cost savings alone while recovering the system investment in month 14 of deployment.

VP Finance & Controller — Regional Hotel Owner, 500-Room Property

Frequently Asked Questions

What is the typical ROI timeline for hotel CMMS implementation?
This property achieved full cost-reduction ROI (system payback) in 14 months. Most upscale hotels with significant reactive maintenance baseline achieve 12-18 month payback. Boutique or well-maintained properties may extend payback to 20-24 months due to lower emergency repair baseline.
Is a 35% cost reduction realistic for other hotels?
This property's 35% reduction reflects severe reactive maintenance baseline (68% of budget). Properties with existing preventive discipline typically achieve 18-25% cost reduction. High-rise hotels and resorts with complex systems experience 25-35% improvements. Boutique hotels often see 12-18% reductions due to lower existing emergency workload.
How does maintenance quality impact guest reviews and bookings?
Guest experience research shows maintenance-related complaints are the third-highest driver of negative OTA reviews. This property's 84% complaint reduction (from 140 to 22/month) lifted guest satisfaction 19 points. OTA rating improvement enabled $8-12/night rate premium — 4-6% revenue uplift on $250 ADR base.
What is the cost per occupied room industry benchmark?
Industry benchmark for upscale hotels is 3.1% of revenue, or approximately $6.50-$9.20 per occupied room (varies by property age and climate). This property's baseline of $18.64/room (8.4% of revenue) was severely elevated — representing 80% above benchmark. Post-optimization cost of $12.14/room (5.1%) remains 5-8% above benchmark but reflects premium service standards and newer HVAC/plumbing infrastructure.
How does emergency repair cost differ from preventive maintenance?
Emergency HVAC repairs average $2,880 per call vs. $340 for preventive quarterly maintenance. Emergency plumbing ($1,200 average including water damage) vs. prevention ($45 quarterly). Emergency electrical ($650) vs. prevention ($28). System failure prevention costs roughly 5-8% of emergency repair cost, making prevention economically dominant across all system types.
What's the link between maintenance and staff turnover reduction?
Technician turnover dropped 36% (42%→27%) because CMMS reduces emergency pressure, provides equipment context for problem-solving, and creates transparent performance visibility. Staff appreciate predictable scheduling vs. constant crisis response. Reduced turnover saves $8K per new hire training plus improves institutional knowledge and system expertise.
Can CMMS improve equipment lifespan and defer capital replacements?
Yes — preventive maintenance extends HVAC equipment life by 4-5 years (rooftop units projected 15-17 year life vs. prior 11-12 year trajectory). Plumbing systems see 20-30% longer life through corrosion prevention. This property deferred $450K capex and redirected capital to revenue-generating renovations instead of emergency replacements.

Reduce Your Hotel's Maintenance Cost Per Room — Start Measuring Today

OxMaint tracks cost per occupied room, emergency call trends, spare parts consumption, and guest satisfaction correlation in real-time. See exactly where your maintenance budget is spent and where cost reduction opportunities exist. Free trial includes cost benchmark analysis for your property type and market segment.
Share This Story, Choose Your Platform!