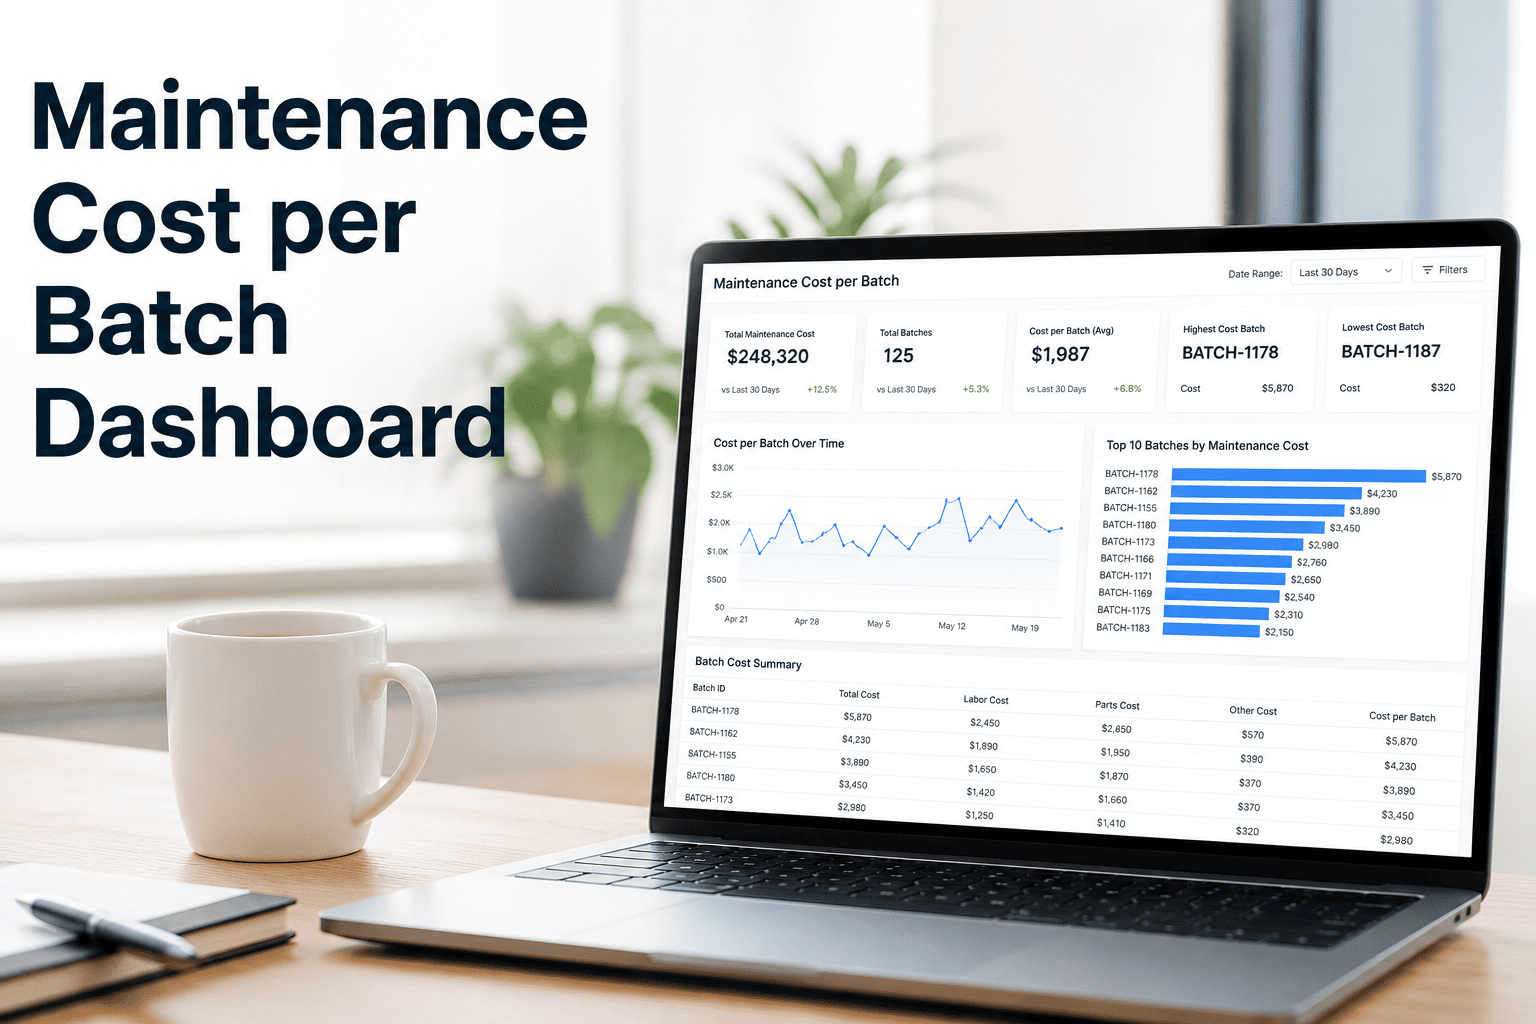
Pharmaceutical maintenance teams have always tracked equipment uptime, PM compliance, and work order closure rates — but when the CFO asks how much does maintenance actually cost per batch on Line 4 versus Line 7, most CMMS systems go silent. That gap between operational data and financial accountability is costing mid-size pharma manufacturers an estimated $420,000 per unplanned shutdown per line (Siemens True Cost of Downtime, 2024), with batch-loss incidents in sterile manufacturing reaching up to $9 million per event. A Maintenance Cost per Batch Dashboard in OxMaint connects your work order costs, labor hours, spare parts consumption, and utility spend directly to your batch records — giving operations and finance a shared number instead of two separate spreadsheets. When you can see that Suite B bioreactor maintenance costs $2,400 per batch while Suite D runs at $890, you stop guessing and start optimizing. Book a demo to see how OxMaint surfaces maintenance cost per batch across your lines, suites, and sites.
Pharma Executive ROI / Finance & Operations
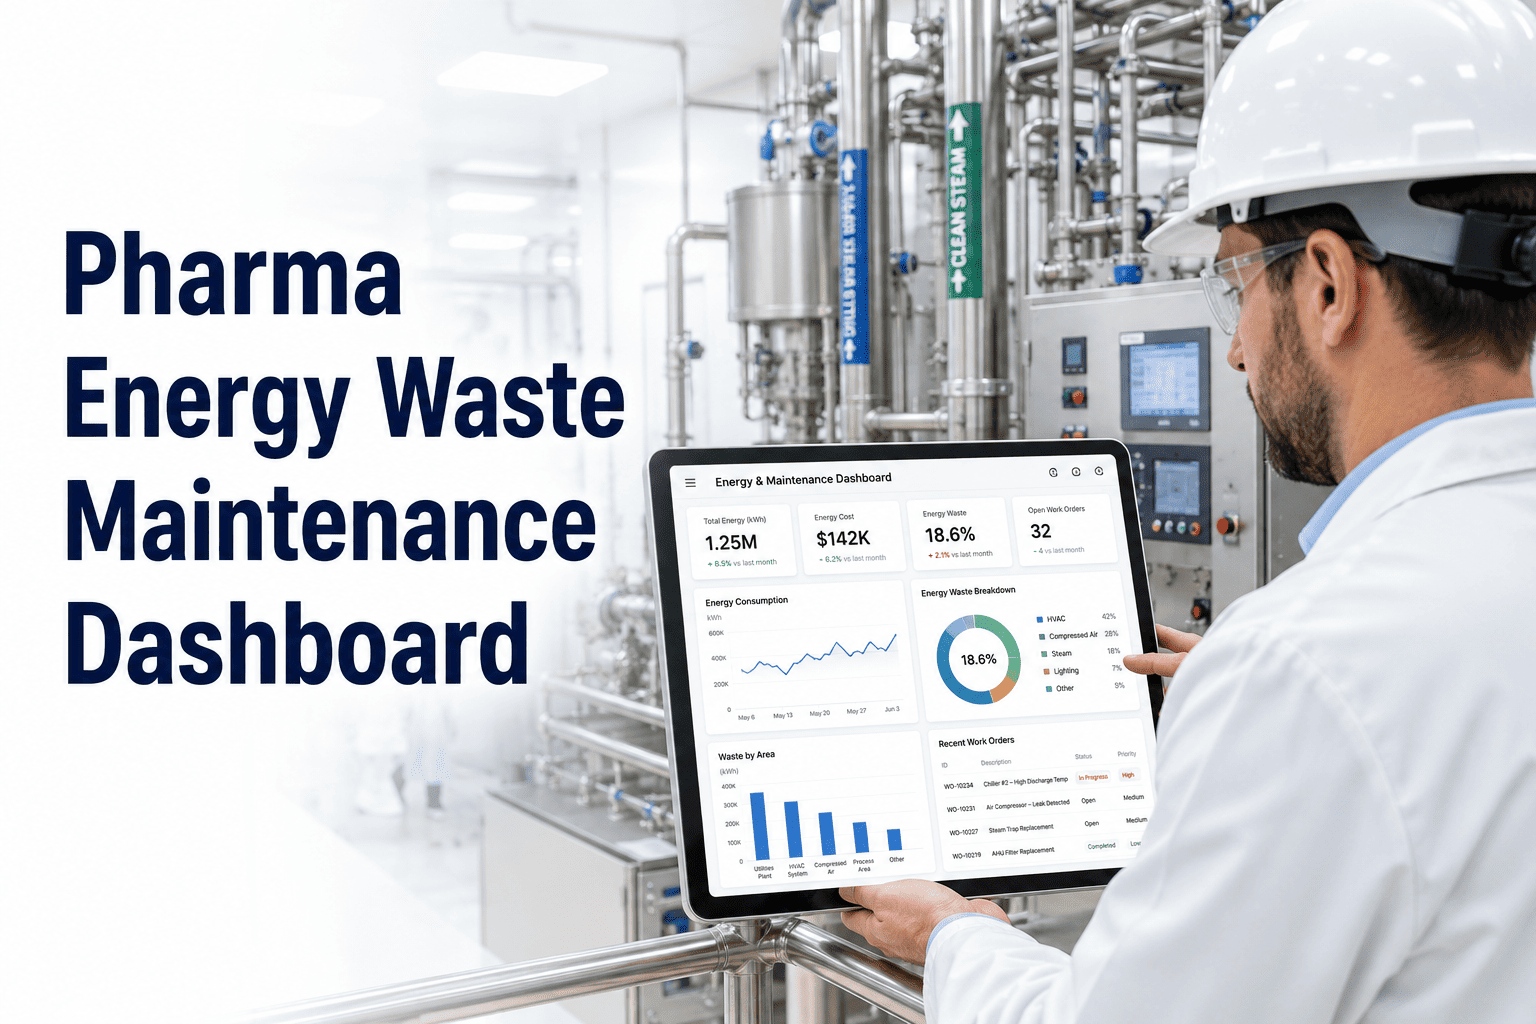
Maintenance Cost per Batch Dashboard for Pharma Operations
When finance asks what maintenance costs per batch — by line, suite, product family, utility system, or site — your CMMS should already have the answer. OxMaint connects every work order, parts spend, and labor hour to the batch it protected or disrupted.
$420K
Avg cost per unplanned shutdown per pharma line
$9M
Max batch-loss risk per sterile manufacturing incident
20%
Avg staffed time lost to unplanned breakdowns in pharma
35%
Industry average OEE — well below the 85% world-class benchmark
Why Maintenance Cost per Batch Is the KPI Finance Has Been Asking For
Maintenance budgets in pharma are approved globally but spent locally — by line, by suite, by shift, by product campaign. Without batch-level cost attribution, the VP of Finance sees a $4.2M annual maintenance line item. The VP of Operations sees 312 closed work orders. Neither sees that Product Family A consumes 3.8x more maintenance spend per batch than Product Family B — a structural cost problem hiding in plain sight.
Without Batch Cost Attribution
Total maintenance spend: $4.2M — no line breakdown
PM compliance: 87% — no product campaign context
Unplanned work orders: 94 — no batch impact mapped
Spare parts consumption: $610K — no allocation by suite
With OxMaint Cost per Batch Dashboard
Line 4: $1,840/batch | Line 7: $690/batch — 2.7x gap flagged
Product Family A: $2,400/batch — flagged for cost review
Suite B bioreactor: 38% of unplanned spend — root cause visible
HVAC utility: $124/batch allocated to sterile suites
5 Dimensions OxMaint Tracks in the Cost per Batch Dashboard
Maintenance cost is not one number. It is five overlapping cost streams that need to be visible individually and in combination before you can act on them.
01
By Production Line
Planned PM cost, unplanned CM cost, and labor hours per batch run on each line. Identifies lines with structurally higher maintenance intensity before budget season.
02
By Manufacturing Suite
Suite-level cost allocation separates sterile fill-finish, fermentation, and packaging maintenance spend. Critical for multi-product sites where suite scheduling affects batch economics.
03
By Utility System
HVAC, purified water, clean steam, and compressed air maintenance costs allocated per batch consumed. Utility maintenance is often invisible in product cost — until a utility failure kills a batch.
04
By Product Family
Biologics vs small molecule, sterile vs oral solid — each product type drives different equipment stress and maintenance frequency. Product cost models are incomplete without this allocation.
05
By Site
Multi-site pharma organisations compare maintenance cost per batch across North America, Europe, and Asia sites — identifying which sites are over-maintained, under-maintained, or structurally inefficient.
Connect Finance + Operations
Your CFO Wants Cost per Batch. Your CMMS Should Already Have It.
OxMaint links every work order, technician hour, and spare part to the production line and batch it was executed for — generating a live cost per batch view that finance and operations can act on together.
Benchmark: Maintenance Cost per Batch by Pharma Segment
Industry cost benchmarks vary significantly by product type and manufacturing complexity. The table below reflects 2024–2025 industry data for fully allocated maintenance cost per batch including PM labour, parts, utilities maintenance share, and corrective maintenance.
| Pharma Segment |
Avg Maintenance Cost / Batch |
% Unplanned vs Planned |
Primary Cost Driver |
OEE Benchmark |
| Sterile Fill-Finish (biologics) |
$2,800 – $4,200 |
42% unplanned |
HVAC + clean utilities |
38–52% |
| Oral Solid Dosage (OSD) |
$480 – $920 |
28% unplanned |
Compression + coating equipment |
55–68% |
| Fermentation / Upstream Bioprocess |
$3,100 – $6,800 |
51% unplanned |
Bioreactors + agitator seals |
35–48% |
| API Synthesis (chemical) |
$1,200 – $2,400 |
35% unplanned |
Reactor agitators + pumps |
48–62% |
| Packaging / Secondary |
$160 – $340 |
22% unplanned |
Line changeover + sensor wear |
60–72% |
Sources: Siemens True Cost of Downtime 2024 | DrugPatentWatch 2025 | OxMaint deployment analysis | SCW.ai OEE Benchmark 2026
How the Dashboard Is Built: OxMaint Data Flow
1
Work Order Closure with Batch Tag
Every corrective and preventive work order in OxMaint captures the production line, suite, and batch number active at time of execution — creating the foundational cost-to-batch linkage.
2
Labour + Parts Cost Capture
Technician hours (at loaded labour rates) and parts consumed are recorded per work order — giving a fully loaded cost figure that finance accepts without manual reconciliation.
3
Utility Cost Allocation
HVAC, purified water, and compressed air maintenance costs are allocated across suites by runtime hours per batch — distributing indirect maintenance costs that are otherwise invisible in product costings.
4
Dashboard Aggregation
OxMaint aggregates cost per batch by line, suite, product family, utility, and site — with trend views showing whether cost per batch is rising, stable, or improving over rolling 3, 6, and 12-month windows.
5
Finance-Ready Export
Cost per batch data exports in formats compatible with SAP, Oracle, and Excel-based standard costing systems — ending the manual data reconciliation that delays monthly operations reviews.
Expert Review
RS
The single biggest gap in pharmaceutical maintenance reporting is the missing link between work order cost and batch record. Sites that close this gap — even partially — typically find that 15–20% of their maintenance spend is concentrated in 8–10% of their asset base, and that concentration is almost always invisible until you run the numbers at batch level. Finance stops questioning the maintenance budget the moment you can show them cost per batch trending down.
Rajesh Subramanian
Director of Technical Operations, Biopharma — 19 years in pharma manufacturing operations, former site reliability lead at a top-10 CDM
Frequently Asked Questions
Get Your Cost per Batch Report
Stop Estimating. Start Knowing What Maintenance Costs Per Batch — By Line, Suite, and Site.
OxMaint connects your work orders, labour, parts, and utility maintenance costs directly to your batch records — giving operations and finance a shared, accurate cost per batch dashboard that drives budget decisions, not just reporting cycles.