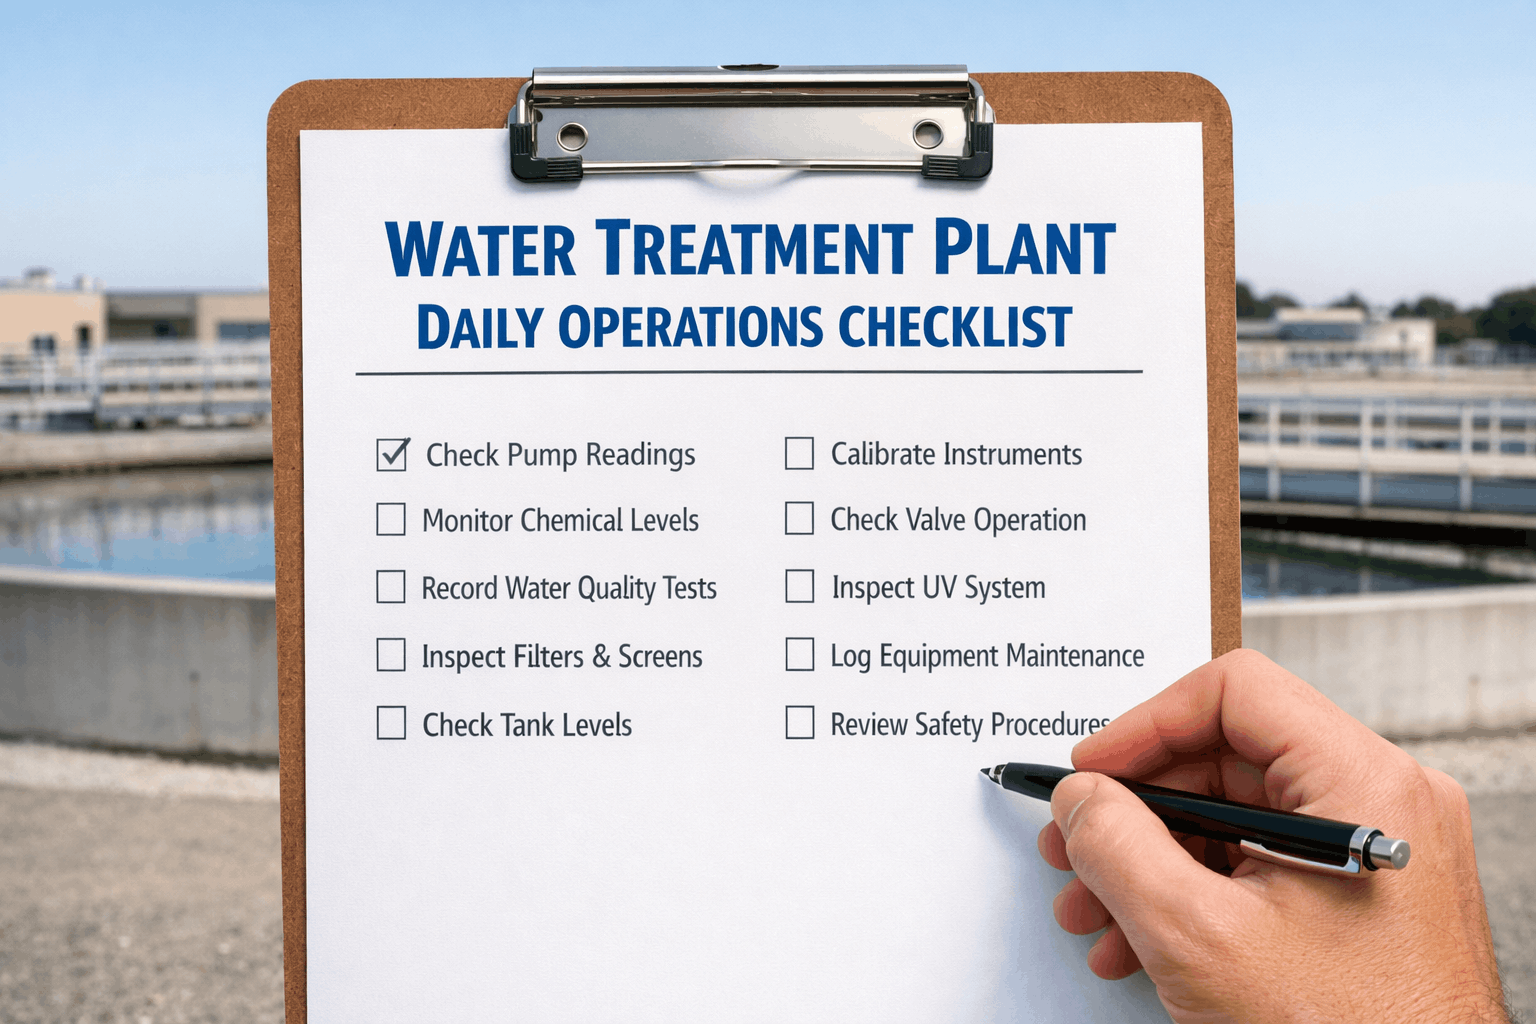
When a water treatment plant operator misses a critical chlorine residual reading, the consequences cascade rapidly—boil-water advisories disrupt thousands of households, EPA violations trigger costly enforcement actions, and public confidence in municipal water safety erodes overnight. A single skipped pH adjustment, an overlooked turbidity spike, or incomplete backwash documentation can transform a routine shift into a regulatory crisis that takes months to resolve.
This guide provides water treatment plant operators and facility managers with a comprehensive daily operations checklist covering process monitoring, chemical dosing verification, equipment inspection, and water quality testing protocols that ensure EPA Safe Drinking Water Act compliance. Departments ready to modernize their plant operations can start building their digital water treatment management system today.
Water treatment plants are more than utility facilities; they are the frontline defense protecting public health. Treating daily operations documentation with the same urgency as emergency response or capital improvements is essential for modern municipal water management.
Impact of Operations Documentation Failures
Public Health Protection
Critical Zone: Disinfection, filtration, chemical dosing systems
Risk Factor: Waterborne pathogens cause 7.2M illnesses annually in the US
Failure Impact: Contamination events, boil-water advisories, disease outbreaks
Urgency: Immediate corrective action required (Category 1 priority)
EPA Regulatory Compliance
Critical Zone: SDWA monitoring, DBP limits, turbidity standards, CT calculations
Function: Defensible documentation proving treatment adequacy
Failure Impact: NOVs, consent orders, fines up to $59,017/day per violation
Urgency: High priority documentation (same-shift completion required)
Operational Continuity
Critical Zone: Pumps, chemical feed systems, SCADA, filters, clarifiers
Function: Consistent treatment quality across all operator shifts
Failure Impact: Equipment failures, treatment upsets, unplanned shutdowns
Urgency: Standard maintenance cycle (24-48 hour target)
Don't risk EPA violations or public health emergencies. Implement systematic daily operations tracking and automated compliance documentation to catch treatment deviations before they become crises.
Systematic daily monitoring prevents treatment failures by ensuring compliance with EPA Safe Drinking Water Act requirements and state primacy agency regulations. This checklist guides operators through critical monitoring points from source water intake through finished water distribution.
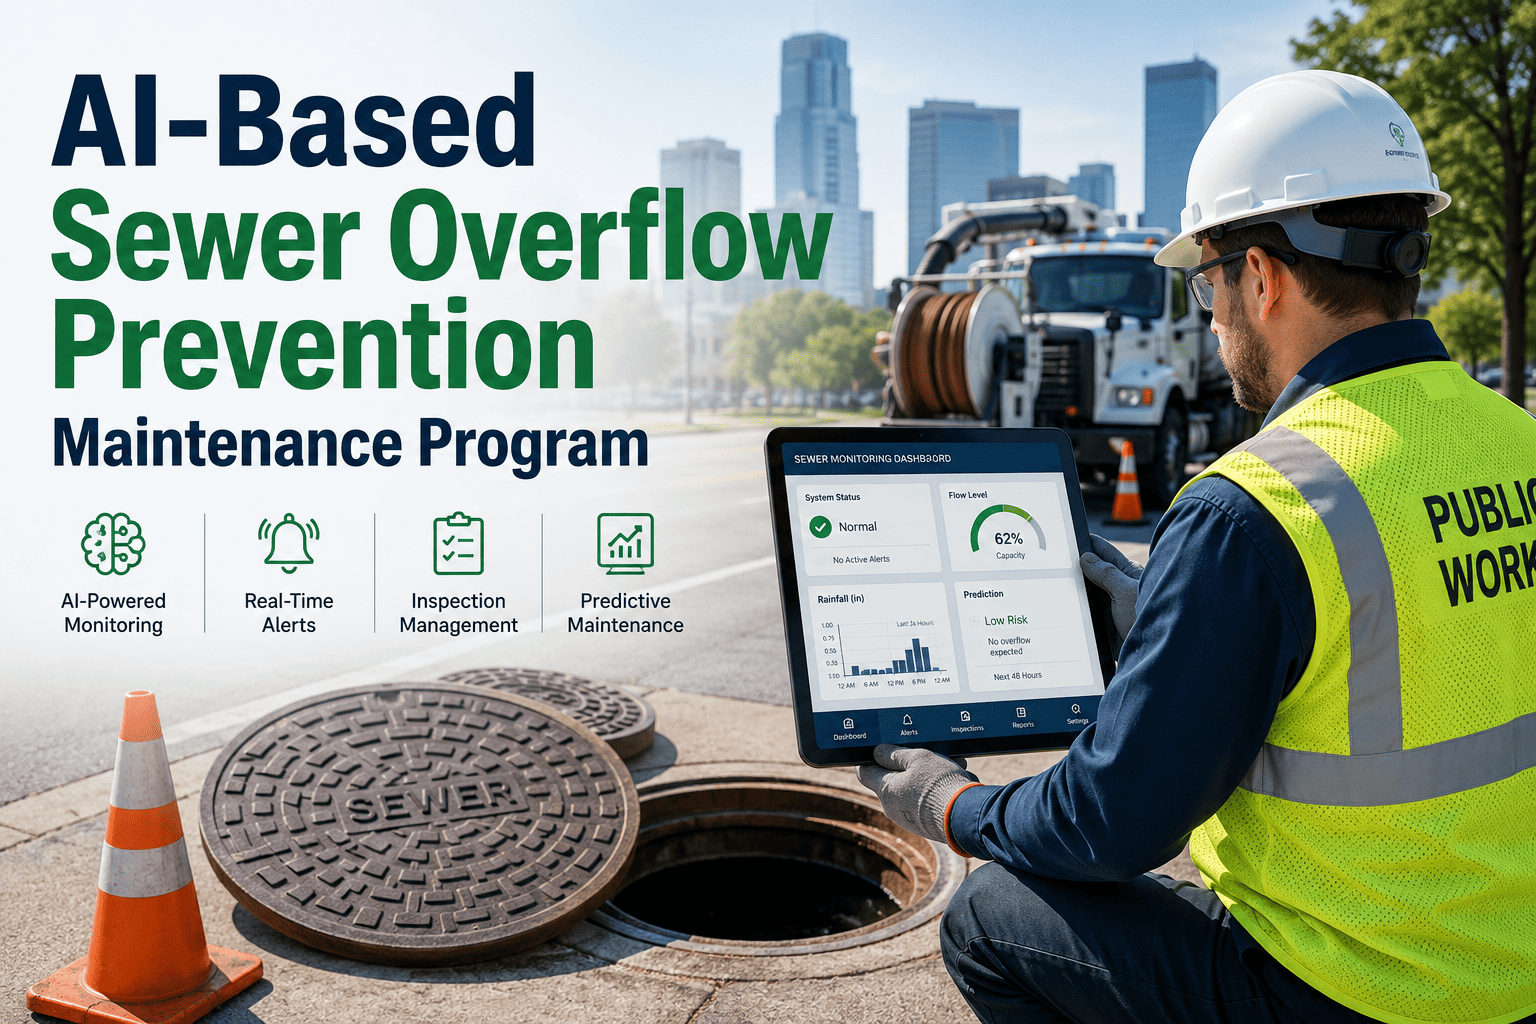
Modern water treatment management systems allow municipalities to move from "fix it when it breaks" to "fix it before it fails." Digital logs and data analytics provide real-time insights into treatment process health and equipment condition.
Smart Water Treatment Analytics
1
Filter Performance Trending
Track filter run times, head loss progression, and effluent turbidity patterns to predict optimal backwash timing. Algorithms identify filter media degradation before treatment quality is compromised, automating backwash scheduling.
ROI: Extends filter media life 20-30%; prevents turbidity exceedances
2
Chemical Usage Optimization
Monitor coagulant, disinfectant, and pH adjustment chemical consumption against raw water quality variations. Predictive dosing models reduce chemical waste by 15-25% while maintaining treatment targets automatically.
ROI: Reduces chemical costs; minimizes disinfection byproduct formation
3
Equipment Health Monitoring
Vibration analysis, bearing temperature trends, and motor amperage patterns forecast pump and blower failures 30-60 days in advance. Planned replacements during low-demand periods eliminate emergency shutdowns.
ROI: Eliminates unplanned downtime; extends equipment lifecycle 25%
4
Compliance Trend Analysis
Aggregate water quality data to identify emerging compliance risks before violations occur. Trending analysis detects gradual shifts in turbidity, disinfectant residuals, or DBP precursors enabling proactive process adjustments.
ROI: Prevents EPA violations; maintains clean compliance record
Automated Treatment Deviation Response Workflow
1
SCADA detects turbidity spike or chlorine residual drop during monitoring
→
2
System auto-creates priority work order with parameter data and trending
→
3
Alert dispatched to duty operator with corrective action procedure
→
4
Operator adjusts dosing, documents actions, uploads verification readings
→
5
System logs resolution with timestamp and updates compliance dashboard
See smart water treatment management in action. Book a demo showing how integrating SCADA data with CMMS automates your entire plant operations and compliance workflow.
Book Custom Demo →
Standardization ensures treatment quality and regulatory compliance across all operator shifts. These SOPs guide crews through routine monitoring, emergency response, and seasonal process adjustments to ensure consistent water quality regardless of who is on duty.
✓ Review previous shift operator log for anomalies, adjustments, or pending issues
✓ Verify all SCADA alarms are acknowledged and active alarm conditions addressed
✓ Conduct plant walkthrough checking all treatment processes visually
✓ Confirm chemical feed systems are operating and day tanks have adequate levels
✓ Record all initial readings: flows, pressures, turbidities, chlorine residuals
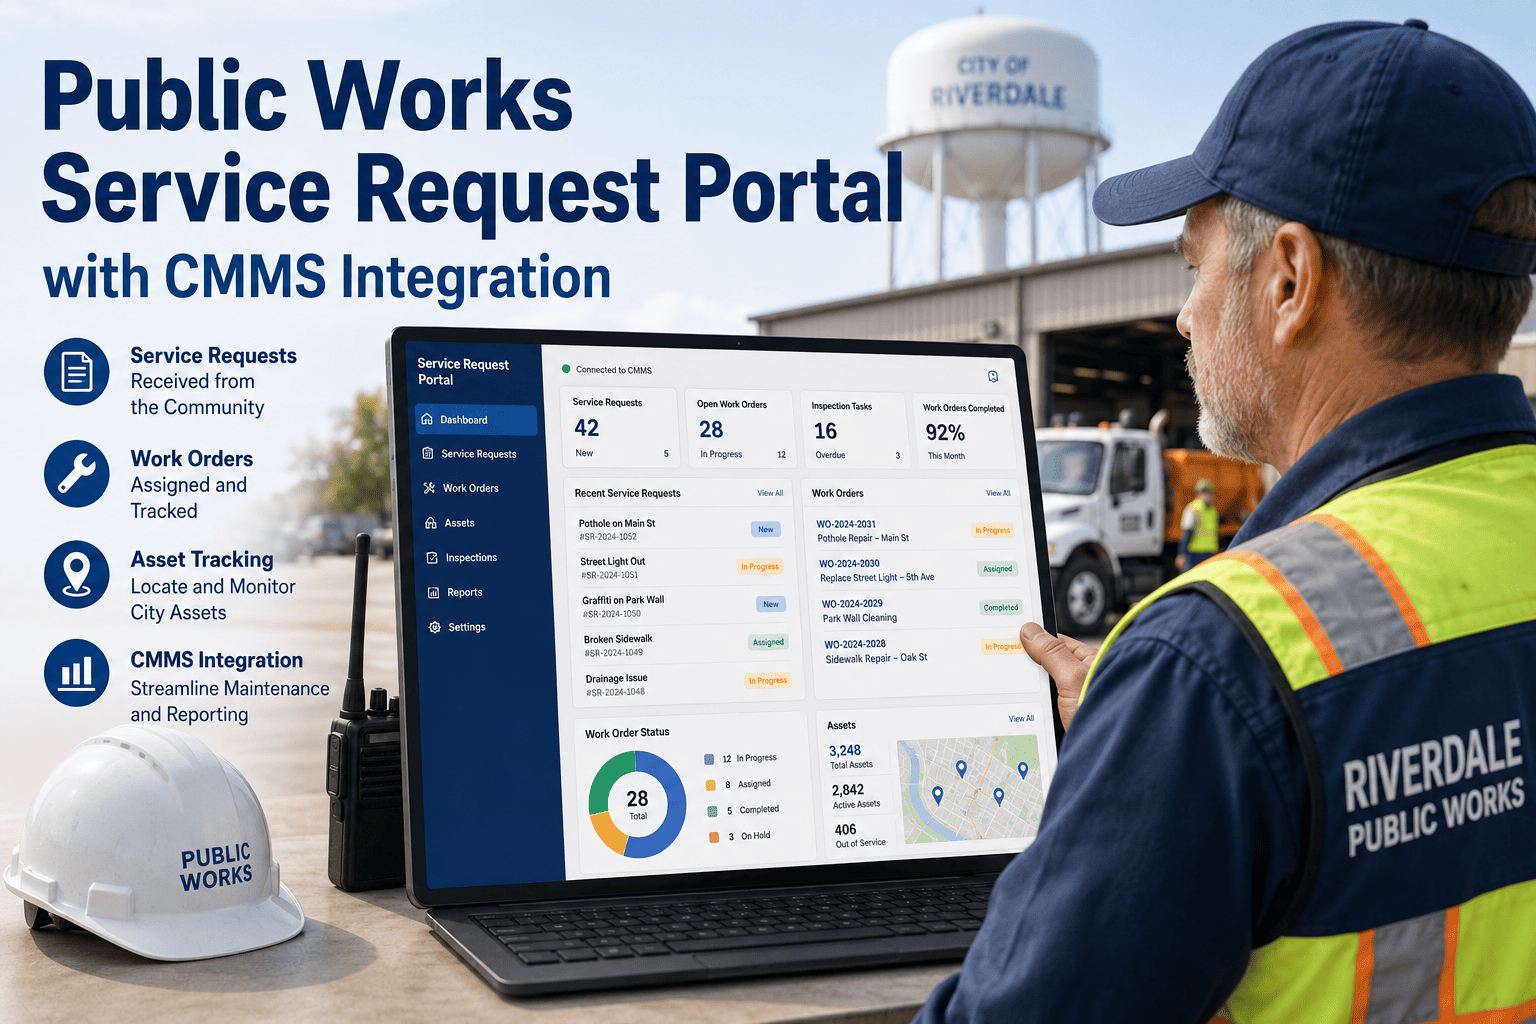
✓ Log shift start in CMMS with operator name, time, and initial conditions noted
✓ Immediately increase chlorine dosing if residual drops below minimum CT requirement
✓ Take filter offline if individual effluent turbidity exceeds 1.0 NTU
✓ Notify plant supervisor and state primacy agency per notification timeline
✓ Collect grab samples for laboratory confirmation of online analyzer readings
✓ Document all actions taken with timestamps in incident response log
✓ Initiate public notification procedures if required by violation tier level
✓ Increase raw water monitoring frequency to hourly during turbidity events
✓ Perform jar tests to optimize coagulant dose for changing raw water quality
✓ Adjust filter backwash frequency based on accelerated head loss buildup
✓ Verify sedimentation basin performance and increase sludge removal if needed
✓ Pre-position additional chemical inventory for sustained high-demand treatment
✓ Brief all operators on modified procedures and escalation thresholds
Streamline Plant Operations with Smart Asset Management
Oxmaint CMMS integrates SCADA monitoring, digital operator logs, and automated compliance reporting to streamline water treatment operations, reducing violations and improving treatment reliability.
Trusted by water utilities and treatment facilities nationwide
Water treatment plant operations are governed by extensive federal and state regulations designed to protect public health. Daily operations documentation must prove continuous compliance with drinking water standards and treatment technique requirements.
Surface Water Treatment Rule (SWTR) compliance
Disinfection Byproduct Rules (Stage 1 & 2 DBP)
Lead and Copper Rule monitoring
Total Coliform Rule / Revised TCR
Automated: Daily logs map directly to EPA reporting requirements
Turbidity monitoring (individual & combined filter)
CT calculation documentation for disinfection
Filter performance and backwash records
Operator certification compliance
Automated: CT values auto-calculated from flow and residual data
OSHA chemical handling and PPE requirements
Chlorine gas emergency response (RMP)
Chemical inventory and SDS documentation
Spill prevention and containment verification
Automated: Chemical usage tracked with automatic reorder alerts
Monthly operating reports (MORs)
Annual water quality consumer confidence reports
Sanitary survey preparation documentation
Violation notification and public notice procedures
Automated: MOR data auto-populated from daily digital logs
→ Import existing plant assets (pumps, filters, chemical systems) into CMMS
→ Conduct field audit to verify equipment conditions and calibration status
→ Set up QR code tagging on all critical treatment equipment for instant scanning
→ Create digital operations log forms based on EPA and state requirements
→ Define critical parameters and alarm thresholds for automated monitoring
Milestone: 100% digital inventory of plant assets; digital log forms deployed
→ Deploy mobile app to all treatment plant operators across shifts
→ Train staff on digital data entry, photo documentation, and work order creation
→ Configure automated recurring inspection and sampling schedules
→ Standardize failure codes (e.g., "High Turbidity", "Low Cl2 Residual", "Pump Fault")
→ Run parallel operations: digital and paper logs side-by-side for validation
Milestone: Operators using tablets; first digital shift logs completed and verified
→ Integrate SCADA data feeds for automated parameter logging and alarm triggers
→ Connect chemical inventory tracking with automatic reorder point notifications
→ Establish predictive maintenance algorithms for critical equipment
→ Generate first automated Monthly Operating Report for state submission
→ Full cutover to digital operations with paper backup eliminated
Milestone: Automated compliance reporting; predictive maintenance active; full digital operations
A reactive approach to water treatment operations—relying on paper logs that nobody reviews until an audit or violation—is both negligent and expensive. The modern standard demands continuous digital monitoring where treatment deviations trigger immediate corrective actions and every operator decision is documented with defensible timestamps and verification data.
By implementing digital checklists, mobile operator workflows, and predictive analytics, municipalities can drastically improve treatment reliability and compliance posture. Operators stop scrambling to reconstruct shift notes and start executing data-driven process optimization. Documentation shifts from lost paper logs and illegible handwriting to comprehensive digital records that prove regulatory compliance automatically.
The technology to protect your community's drinking water supply exists today. Whether managing a 1 MGD package plant or a 100 MGD regional facility, the path to operational excellence starts with better data and better processes. For a personalized assessment of your plant operations strategy, request a consultation with our water treatment operations specialists.
How often should water treatment plant operators record process data?
At minimum, critical parameters like chlorine residual and turbidity should be recorded every 4 hours (three times per shift). However, best practice is hourly monitoring for disinfection parameters and continuous online monitoring with SCADA for turbidity. During treatment upsets or high raw water turbidity events, monitoring frequency should increase to every 15-30 minutes until conditions stabilize.
What are the most common EPA violations at water treatment plants?
Monitoring and reporting violations are the most frequent—not necessarily treatment failures, but failure to properly document and report required parameters. Missing turbidity readings, incomplete CT calculations, and late submission of monthly operating reports account for the majority of violations. A digital CMMS with automated logging eliminates most monitoring violations by ensuring no required reading is missed.
How does a CMMS improve EPA compliance at water treatment plants?
A CMMS automates the three pillars of compliance: monitoring (scheduled reminders ensure no readings are missed), documentation (timestamped digital records with operator verification create an immutable audit trail), and reporting (monthly operating reports auto-populate from daily data). During sanitary surveys, inspectors receive organized digital records instead of boxes of paper logs, significantly improving audit outcomes.
What is a CT value and why must it be documented daily?
CT value is the product of disinfectant Concentration (C, in mg/L) multiplied by contact Time (T, in minutes). It measures disinfection effectiveness against pathogens like Giardia and viruses. EPA requires daily CT documentation proving adequate disinfection is maintained. A CMMS can auto-calculate CT from online chlorine residual and flow data, ensuring continuous compliance without manual computation errors.
What should operators do when turbidity exceeds regulatory limits?
If individual filter effluent turbidity exceeds 1.0 NTU, that filter must be taken offline immediately. If combined filter effluent exceeds 0.3 NTU (or the plant's specific permit limit), operators must increase coagulant dosing, reduce flow rates, and notify their supervisor. Turbidity exceedances exceeding 1.0 NTU on combined effluent require Tier 1 public notification within 24 hours. All actions must be documented with timestamps for regulatory defense.