A freezer compressor in a Nebraska protein plant tripped on high discharge pressure at 2 a.m. on a Saturday, and the on-call tech found the condenser fan belt had been slipping for weeks. Nobody had logged a pressure reading in eleven days because the paper sheet on the compressor room wall had run out of rows. The room held four zones of frozen product, and the plant had six hours before internal temperature became a food safety event. Suction and discharge pressure are the earliest, cheapest signal a refrigeration system gives before it fails, but only if someone is reading them against a baseline and not just writing numbers down. A structured pressure PM program run through a CMMS turns that wall-mounted logsheet into a trend line engineers can act on before the alarm fires, and you can see how that trend line gets built by exploring the platform at app.oxmaint.ai.
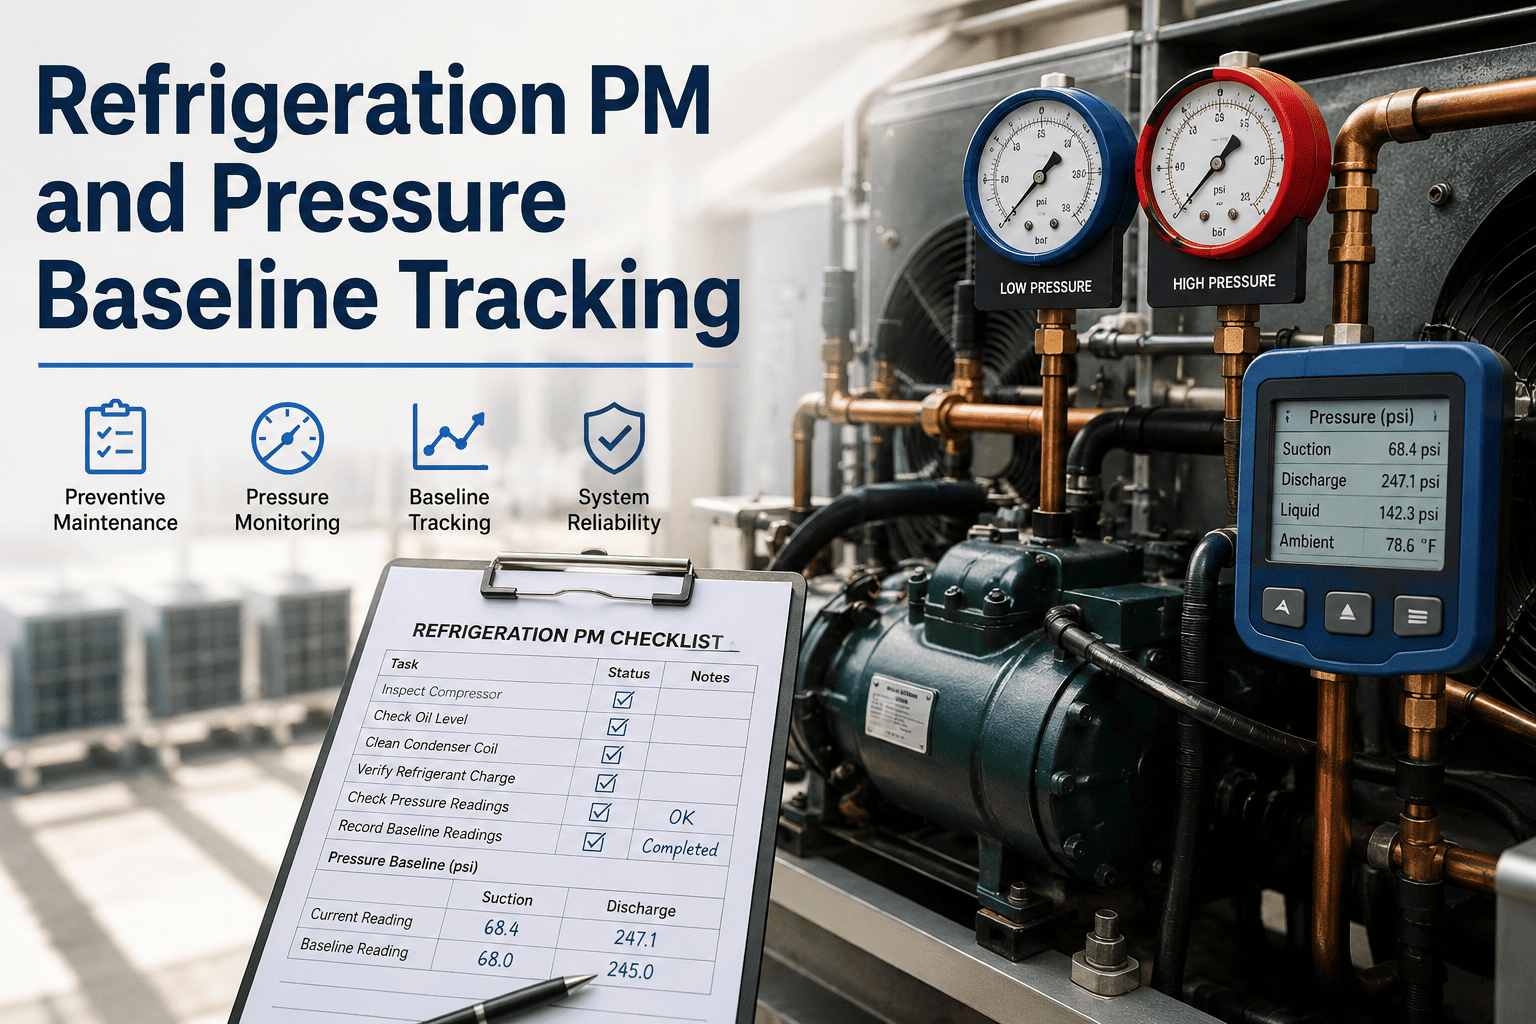
Refrigeration PM and Pressure Baseline Tracking
Suction and discharge pressure recorded on every circuit, compared against baseline automatically, and scheduled through your CMMS so a slow leak or a fouled condenser shows up as a trend line, not a 2 a.m. alarm.
What Pressure Drift Is Actually Telling You
Suction and discharge pressure are not two numbers on a gauge, they are a live readout of everything happening inside the circuit, refrigerant charge, condenser cleanliness, valve wear, and moisture in the oil. When a plant logs pressure without comparing it to a documented baseline, the reading is just a number. Compared against baseline, the same reading becomes an early failure signal weeks before a compressor trips.
The Four Readings Every Circuit PM Should Capture
A pressure PM that only records one gauge misses the story. These four readings, taken together at every compressor and cross-checked against the last logged value, are what separate a real diagnostic routine from a box-ticking walk-through.
A steady downward drift across several logs points to a refrigerant leak or a restricted liquid line long before low pressure trips the safety.
Rising discharge pressure against a flat suction reading is the clearest sign of condenser fouling or non-condensable gas buildup.
The gap between oil supply and crankcase pressure should stay within a tight band; a shrinking differential warns of bearing wear ahead of a trip.
Superheat and subcooling turn raw pressure into a charge and airflow diagnosis, catching undercharge or overcharge that pressure alone hides.
Baseline Pressure Ranges by Temperature Zone
Baseline ranges are specific to refrigerant, ambient condition, and design load, so treat this as a starting reference point, not a substitute for your system's commissioning data. What matters operationally is that every circuit has a documented baseline logged at commissioning, and every reading after that is checked against it, not against memory.
| Zone Type | Typical Suction Range | Typical Discharge Range | Log Frequency |
|---|---|---|---|
| Freezer / blast (-20 to -10°F) | Low, refrigerant-specific | Moderate to high | 2x per shift |
| Cooler / dock (32 to 40°F) | Moderate | Moderate | 1x per shift |
| Process chill (28 to 34°F) | Moderate | Moderate to high | 2x per shift |
| Ammonia high side (condenser) | N/A | Ambient and load dependent | Daily, plus post-defrost |
| Ammonia low side (evaporator) | Refrigerant and load specific | N/A | Daily, plus post-defrost |
A Pressure Reading Without a Baseline Is Just a Number
OxMaint logs suction, discharge, and oil pressure against the documented baseline for every circuit, flags deviation automatically, and turns the compressor room logsheet into a diagnostic history your engineers can actually use.
Where Pressure PM Fits Into a CMMS Schedule
Different equipment classes need different cadences. A compressor room needs pressure logged multiple times a shift; a condenser bank needs a monthly deep inspection tied to the same pressure history. Building the interval into the CMMS, rather than a laminated wall sheet, is what makes the cadence survive shift changes and staff turnover.
| Equipment | Recommended Interval | Trigger Type | Primary Check |
|---|---|---|---|
| Compressor suction / discharge | 2x per shift | Time-based, every shift | Pressure vs baseline, trend flag |
| Oil pressure differential | 1x per shift | Time-based, every shift | Differential vs OEM spec |
| Condenser coil and fans | Monthly | Calendar + discharge trend | Coil cleanliness, fan amperage |
| Evaporator coil and defrost | Monthly | Calendar + suction trend | Frost buildup, defrost timing |
| Refrigerant leak survey | Quarterly | Calendar + suction deviation | Detector sweep, fitting check |
| Oil sample analysis | Semi-annual | Calendar + oil pressure trend | Lab analysis, wear particles |
How OxMaint Runs Refrigeration Pressure PM End-to-End
A pressure history tied to the circuit itself, not a shared logsheet, so every compressor carries its own baseline, trend, and deviation record inside your CMMS.
Logsheet vs Programmed Pressure PM
The gap between a paper logsheet and a structured CMMS routine is not paperwork, it is how early the plant sees a developing problem. Same compressor room, same gauges, very different outcomes.
- ManualComparison against baseline, if done at all
- DaysTime before a missed log entry is noticed
- ReactiveWork order created only after an alarm trips
- Sheet-boundHistory lives on paper in the compressor room
- ScramblePressure records reconstructed before an audit
- AutomaticEvery reading checked against circuit baseline
- ImmediateMissed or overdue log flagged in the CMMS
- PreventiveWork order raised on the first deviation trend
- DigitalHistory tied to the asset, searchable anytime
- LiveAudit packet available on demand, no scramble
What Plants on a Pressure PM Program Report
Frequently Asked Questions
Stop Logging Pressure. Start Trending It.
OxMaint captures a documented baseline for every circuit, schedules pressure logs by shift, flags deviation automatically, and keeps the full history tied to the asset, so your compressor room stops being the place surprises come from.