In a food manufacturing plant, every unexpected equipment failure carries a double cost: the direct repair bill and the far more expensive downstream effect — contaminated product, missed shipments, compliance holds, and the creeping damage to customer trust. MTBF, MTTR, and availability are not abstract engineering metrics; they are the financial heartbeat of your operation. Yet most food plants still track these numbers in spreadsheets — disconnected from work orders, hidden from management, and useless for driving action. OxMaint's reliability dashboard closes this gap, connecting every asset's performance data to maintenance history so your KPIs are live, actionable, and audit-ready.
Blog · Food Manufacturing · Reliability Engineering
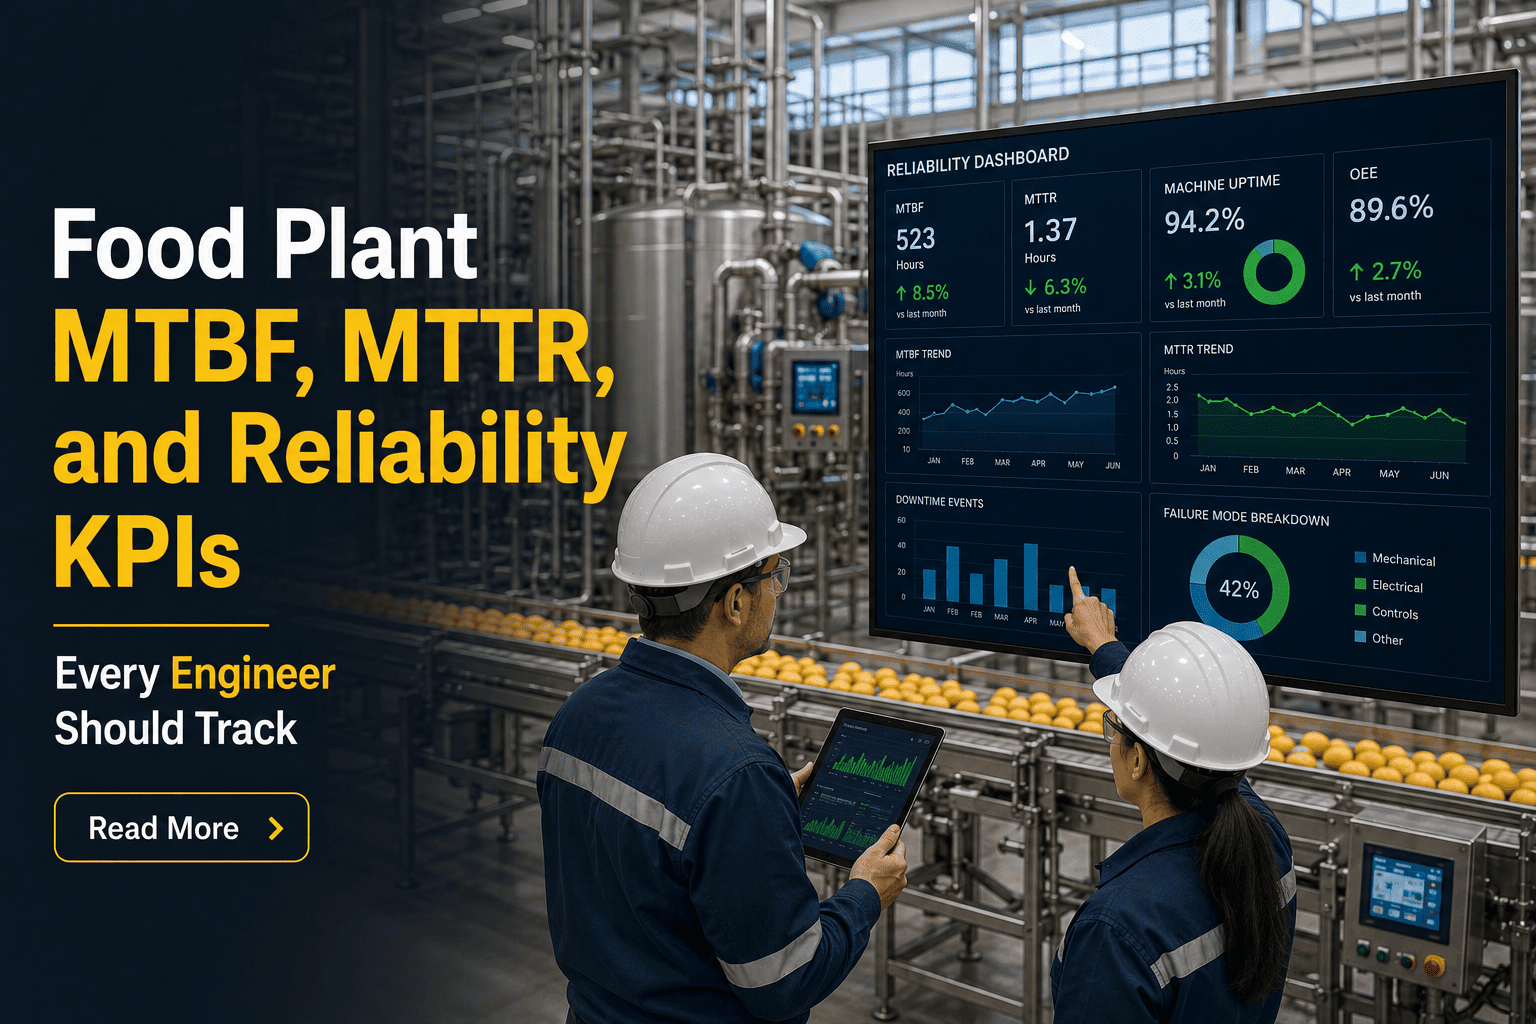
Food Plant MTBF, MTTR, and Reliability KPIs Every Engineer Should Track
Real definitions, industry benchmarks, and a CMMS-driven reliability program that turns KPIs into cost savings — not just reports.
4.8×
Emergency repairs cost vs. planned maintenance
23%
Average OEE loss from untracked equipment failures
$180K
Average annual cost of unplanned downtime per critical line
40%
Reduction in breakdown costs after structured KPI program
See how much cost you can eliminate from reactive maintenance in your facility.
✔ Real-time asset visibility
✔ Predictive failure alerts
✔ 5–10 year CapEx forecasting
What Are MTBF, MTTR, and Reliability KPIs in a Food Plant
Mean Time Between Failures (MTBF) measures how long, on average, a piece of equipment runs before failing. In food manufacturing, where a single line stoppage can trigger product waste and a missed allergen check, MTBF is the primary indicator of equipment health over time. A rising MTBF means your preventive maintenance program is working. A falling MTBF is a financial warning signal — not just an engineering note.
Mean Time To Repair (MTTR) measures how fast your team can restore a failed asset to operation. It captures everything: detection time, parts availability, technician response, and repair execution. In food plants operating on tight production schedules, MTTR directly determines whether a failure costs one shift or three. When combined, MTBF and MTTR give you Availability — the percentage of scheduled time your equipment is actually running and producing — which is the single number executive teams and auditors ask for most. Teams that track these live — not monthly — and close the loop via their CMMS start a free trial with OxMaint to build that feedback loop into every work order, or book a demo to see it on your own asset data.
Key Reliability Concepts Every Food Plant Engineer Must Know
01
MTBF — Mean Time Between Failures
Total uptime divided by number of failures. Benchmark for food packaging lines: 200+ hours. Below 80 hours signals critical reliability risk.
02
MTTR — Mean Time To Repair
Total repair time divided by number of repairs. World-class target for critical food processing assets: under 2 hours including parts retrieval.
03
Availability Rate
MTBF / (MTBF + MTTR) × 100. Target: 95%+ for critical lines. Below 90% means you are losing one shift in ten to unplanned failures.
04
OEE — Overall Equipment Effectiveness
Availability × Performance × Quality. Industry benchmark for food plants: 65–75%. World class: 85%+. Each 1% gain on a high-volume line = $50K–$200K annually.
05
Planned Maintenance Ratio (PMR)
Planned work orders vs. total work orders. A PMR below 70% indicates a reactive maintenance culture — the leading predictor of poor MTBF and high repair costs.
06
Reliability Scorecard
A rolling view combining MTBF trend, MTTR trend, PMR, and asset condition score. The output used in management reviews, audits, and CapEx justifications.
07
Failure Mode Tracking
Categorizing failures by root cause (mechanical, electrical, operator, lubrication) reveals which PM tasks prevent the most failures — the foundation of a data-driven PM schedule.
08
MTTF — Mean Time To Failure
Used for non-repairable components (seals, blades, belts). Drives consumable stocking strategies and replacement intervals — critical for food-grade parts that cannot be reconditioned.
Most food plants lose 20–40% of maintenance budget to untracked asset failures. Real-time KPI dashboards recover it.
Pain Points — Why Most Food Plants Fly Blind on Reliability
⚠
KPIs Calculated Monthly, Not Live
By the time MTBF numbers reach a management review, the failures driving them happened three weeks ago. No corrective action is possible retroactively.
⚠
No Link Between Failure and PM Task
Without CMMS-linked failure mode tracking, you cannot tell which PM tasks prevented failures and which are just cost with no reliability benefit.
⚠
Spare Parts Not Tied to MTTR
A 45-minute repair stretched to 6 hours because a $40 seal was not in stock. MTTR is driven as much by parts availability as technician skill.
⚠
No Reliability Score for Audit
Food safety audits (SQF, BRC, FSSC 22000) increasingly require documented maintenance performance records. Spreadsheets fail at audit time — CMMS records do not.
These are not technology problems — they are visibility problems, and they are exactly why food manufacturing teams that move to a structured CMMS reliability program see measurable improvement within 60 days — start a free trial to see what your own asset data shows, or book a demo and we will map it to your current KPI gaps.
How OxMaint Builds Your Reliability Program
Live MTBF and MTTR Dashboard
Every work order closure updates asset MTBF and MTTR in real time. No manual calculation. No monthly spreadsheet exports.
Failure Mode Classification
Technicians tag failure root cause on every breakdown work order. OxMaint aggregates this into a Pareto of failure types per asset class — actionable PM intelligence.
Reliability Scorecard by Asset
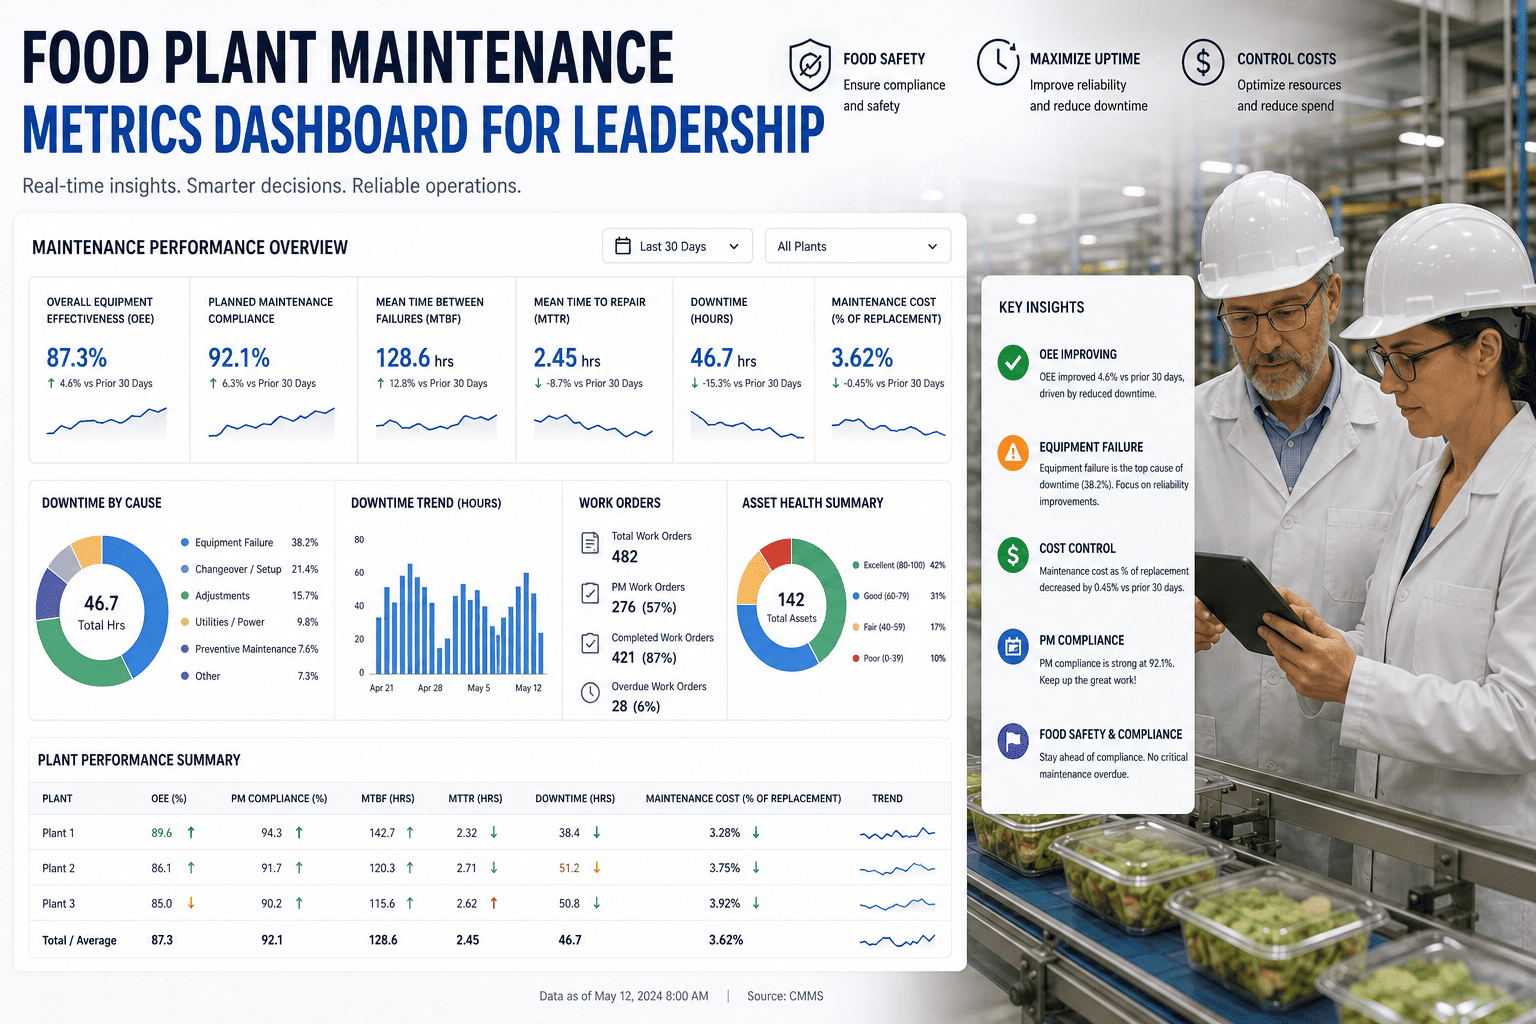
Each asset carries a condition score, MTBF trend, MTTR trend, and PM compliance rate — visible to engineers, managers, and auditors in one view.
PM Schedule Optimization
OxMaint auto-flags PM intervals that are misaligned with actual failure frequency — helping you eliminate over-maintenance waste and under-maintenance risk simultaneously.
OEE Integration
Availability data from the CMMS feeds OEE calculation directly — giving production and maintenance a shared performance number with a shared root cause record.
GMP-Compliant Audit Records
Every inspection, work order, and failure is time-stamped and technician-signed. SQF, BRC, and FSSC 22000 audit documentation is always one click away.
Reactive vs. Planned — The Real Cost Difference
| Dimension |
Reactive Maintenance |
Planned Maintenance with OxMaint |
| Average repair cost |
4.8× planned cost (emergency labour, expedited parts) |
Baseline cost — scheduled labour, stocked parts |
| MTTR visibility |
Unknown — not tracked per asset |
Live per-asset MTTR updated on every WO closure |
| Failure prediction |
None — failures discovered at breakdown |
Condition scores and MTBF trends flag risk assets 2–4 weeks early |
| Audit documentation |
Manual, incomplete, fails audits |
Auto-generated, time-stamped, GMP-compliant |
| OEE impact |
55–70% OEE — unplanned stops dominate |
80–90% OEE within 12 months of structured PM program |
| CapEx planning |
Surprise capital requests — no asset lifecycle data |
5–10yr rolling CapEx model from asset condition history |
ROI and Results — What a Reliability Program Delivers
40%
Lower breakdown repair costs
Achieved within 12 months of shifting PMR above 75% in food processing plants
2.3×
Improvement in MTBF
Average MTBF uplift on critical filling and packaging lines after data-driven PM schedule revision
60%
Reduction in MTTR
When spare parts inventory is linked to CMMS asset records and failure history drives stocking decisions
30 days
To first measurable reliability improvement
OxMaint customers report first KPI movement within the first month — no heavy implementation required
Operations teams managing 10,000+ assets across multi-site food portfolios are using OxMaint right now — start a free trial and see measurable results in the first 30 days, or book a demo for a custom walkthrough of your reliability program.
Used by operations teams managing 10,000+ assets. Live in days, not months. No heavy implementation required.
Frequently Asked Questions
What is a good MTBF benchmark for food packaging equipment
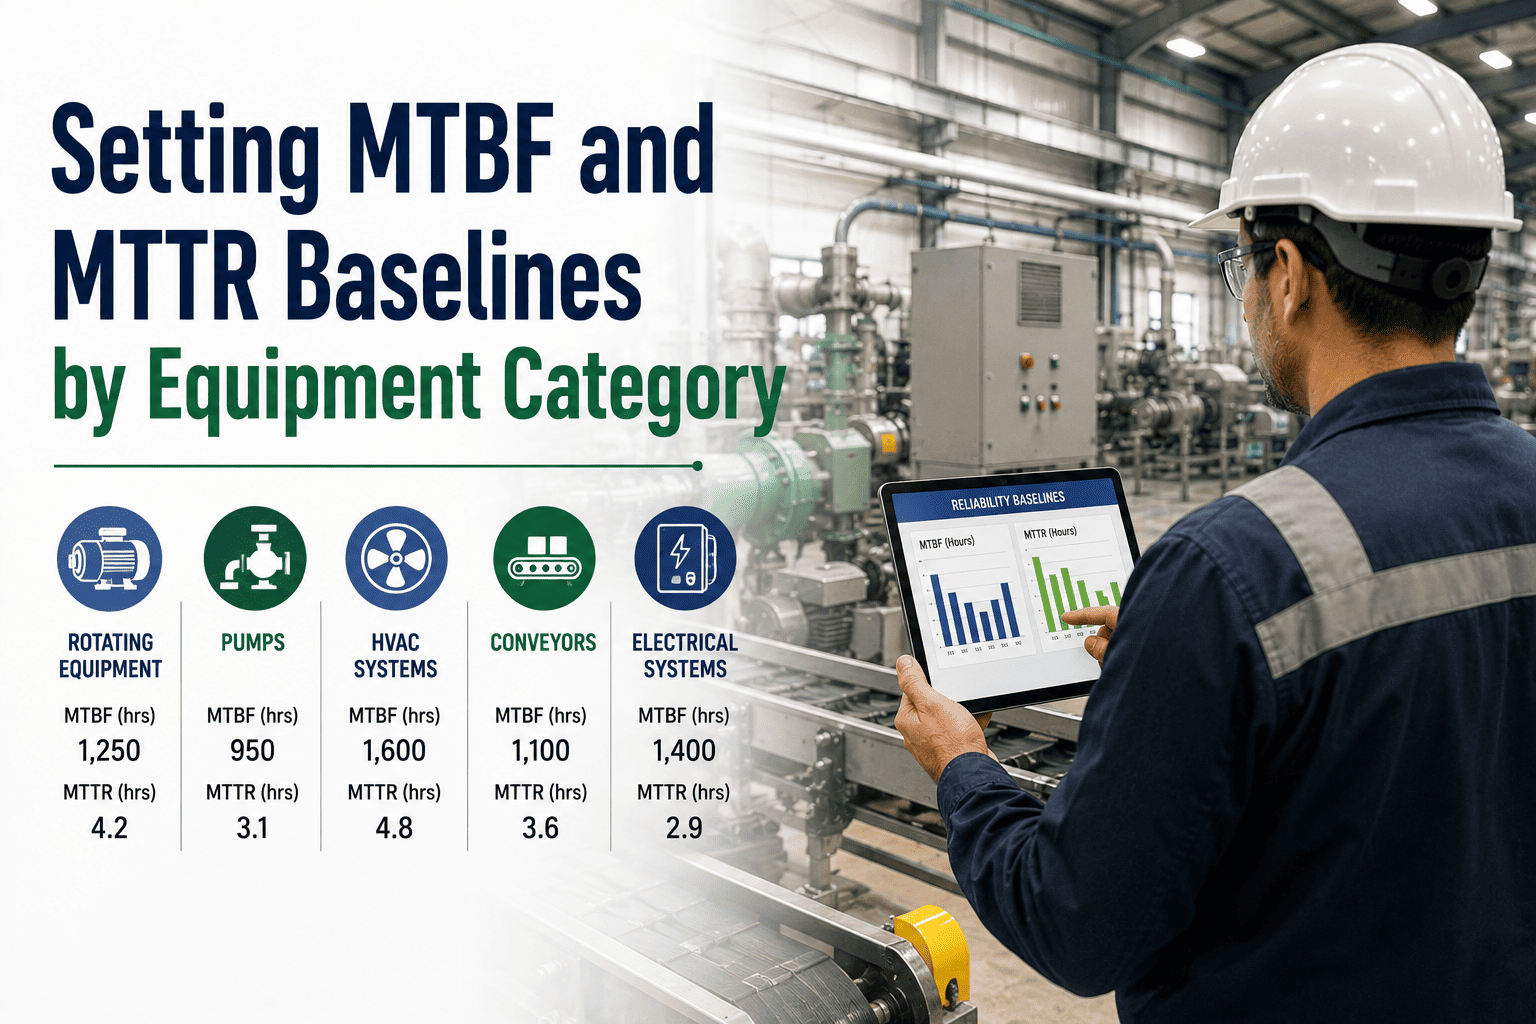
For high-speed food packaging lines (fillers, sealers, labellers), a world-class MTBF target is 300–500 hours between failures. Mid-tier plants typically operate at 100–200 hours. Anything below 80 hours on a critical asset indicates a PM program gap or an end-of-life asset that needs CapEx review. OxMaint tracks MTBF per asset in real time, so you can see trending degradation before it becomes a crisis —
start a free trial to benchmark your own assets.
How does a CMMS improve MTTR in a food plant
CMMS reduces MTTR through three mechanisms: first, it stores asset-specific repair history so technicians know the most likely failure mode before they open a panel; second, it links spare parts inventory to asset records so the right parts are found in minutes, not hours; third, it captures repair time per task type so engineering can identify and eliminate the longest steps. OxMaint customers consistently report MTTR reductions of 40–60% within six months of deploying work order management and parts linking —
book a demo to see the workflow.
Which reliability KPIs are required for SQF and FSSC 22000 audits
SQF Edition 9 and FSSC 22000 Version 6 require documented preventive maintenance schedules, completed work order records with technician sign-off, and evidence that equipment is maintained in a condition that does not create food safety risk. Availability rate, PM compliance rate, and inspection completion records are the most commonly requested. OxMaint generates all of these automatically from normal work order activity — no manual reporting required. Every record is time-stamped and linked to the specific asset and work order.
How does OxMaint build a reliability scorecard for a multi-site food portfolio
OxMaint's portfolio hierarchy (Portfolio greater than Property greater than System greater than Asset greater than Component) means reliability scores roll up automatically. Site managers see their own asset KPIs; VP Operations sees a portfolio-level view showing which sites have deteriorating MTBF trends, low PM compliance rates, or rising MTTR. This cross-site visibility is what transforms a reliability program from a single-plant exercise into a portfolio-wide asset management strategy —
start a free trial to configure your portfolio structure in minutes.
Stop Losing Budget to Untracked Failures
Turn Your Food Plant's Reliability KPIs Into a Cost Reduction Engine
OxMaint connects every work order, failure mode, and PM task to live MTBF, MTTR, and availability scores — giving your engineering team the data to stop fires before they start and giving leadership the numbers to justify every maintenance dollar spent.
✔ Real-time asset visibility across all sites
✔ Predictive failure alerts before breakdown
✔ 5–10 year CapEx forecasting from condition data
No heavy implementation required · Works across multi-site portfolios · Live in days, not months