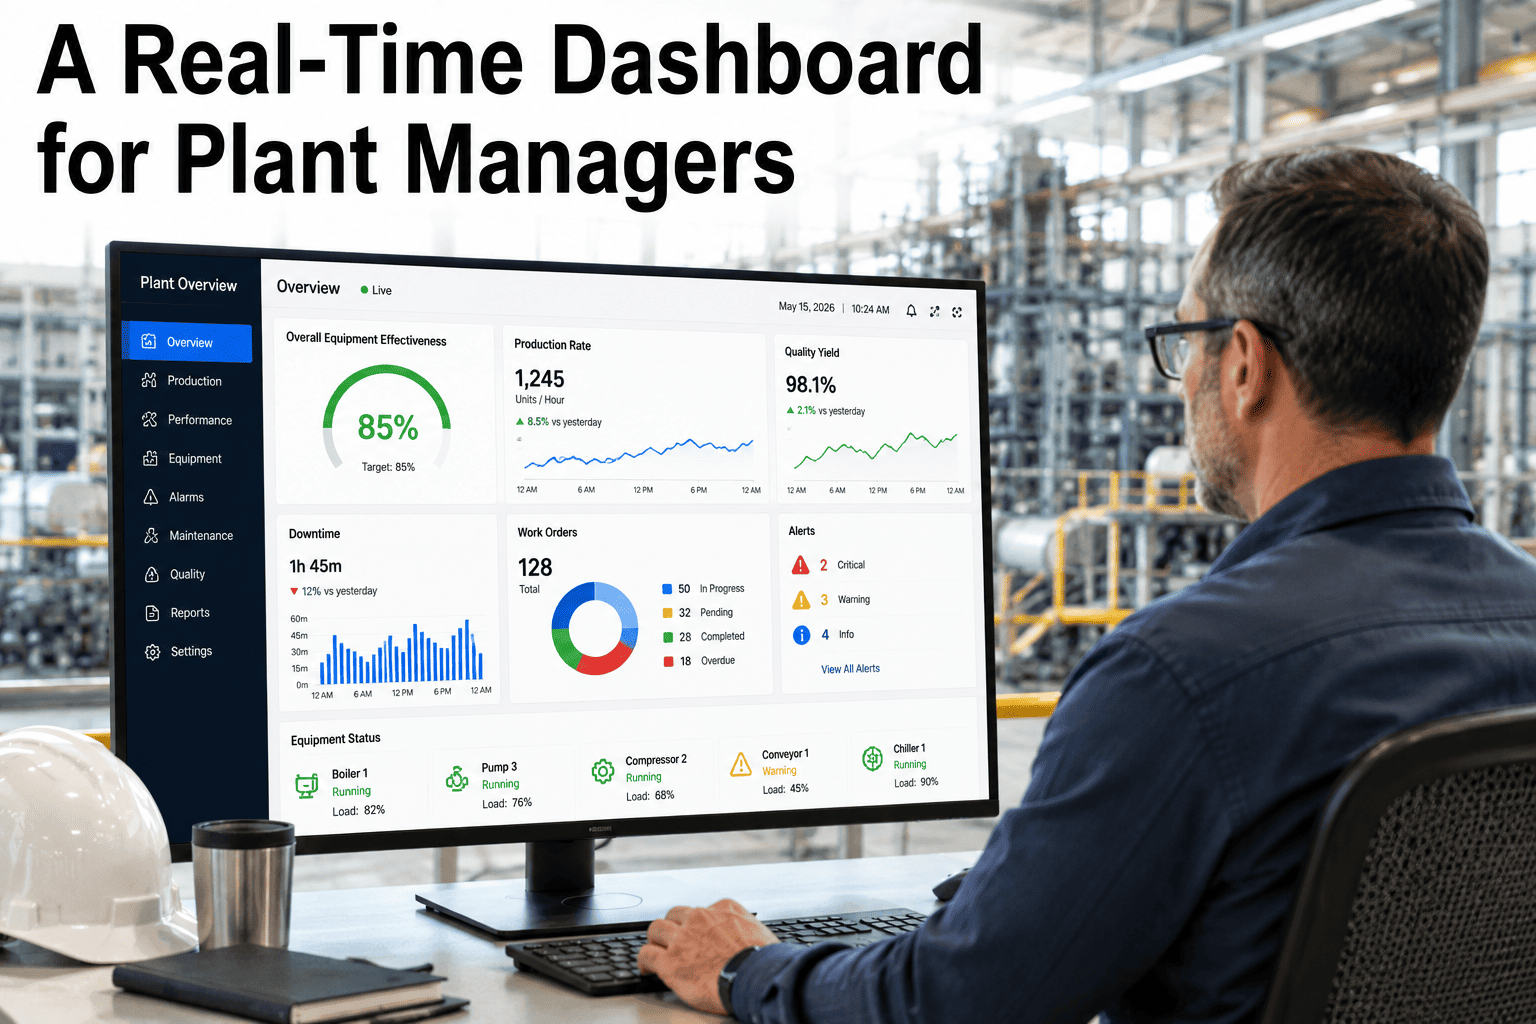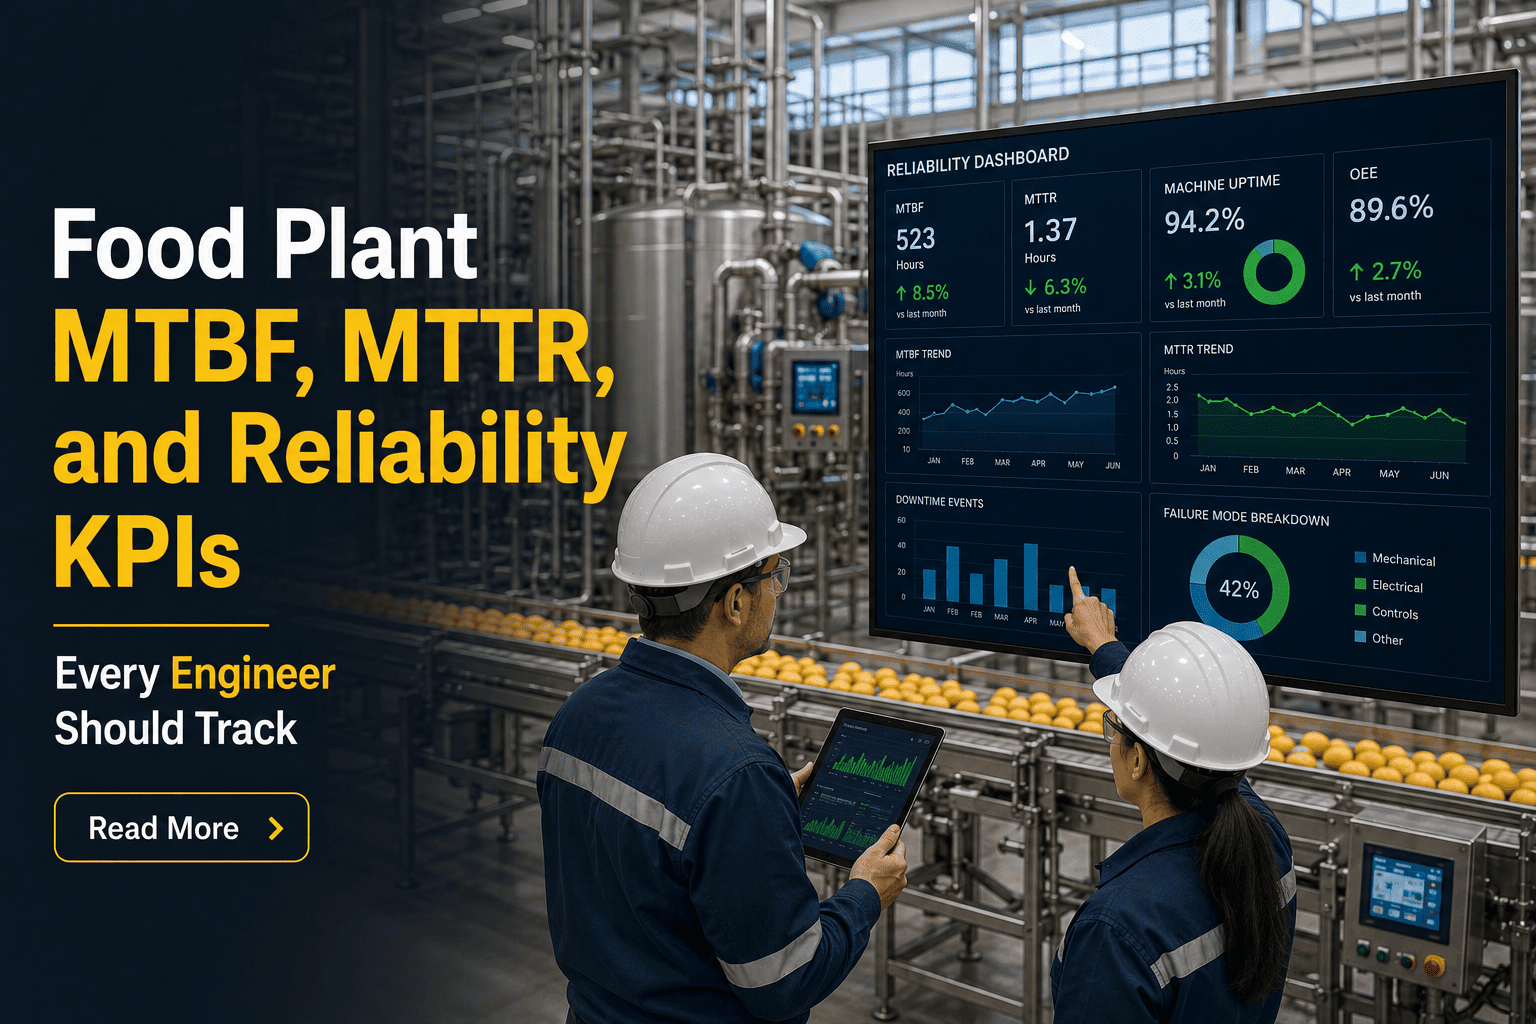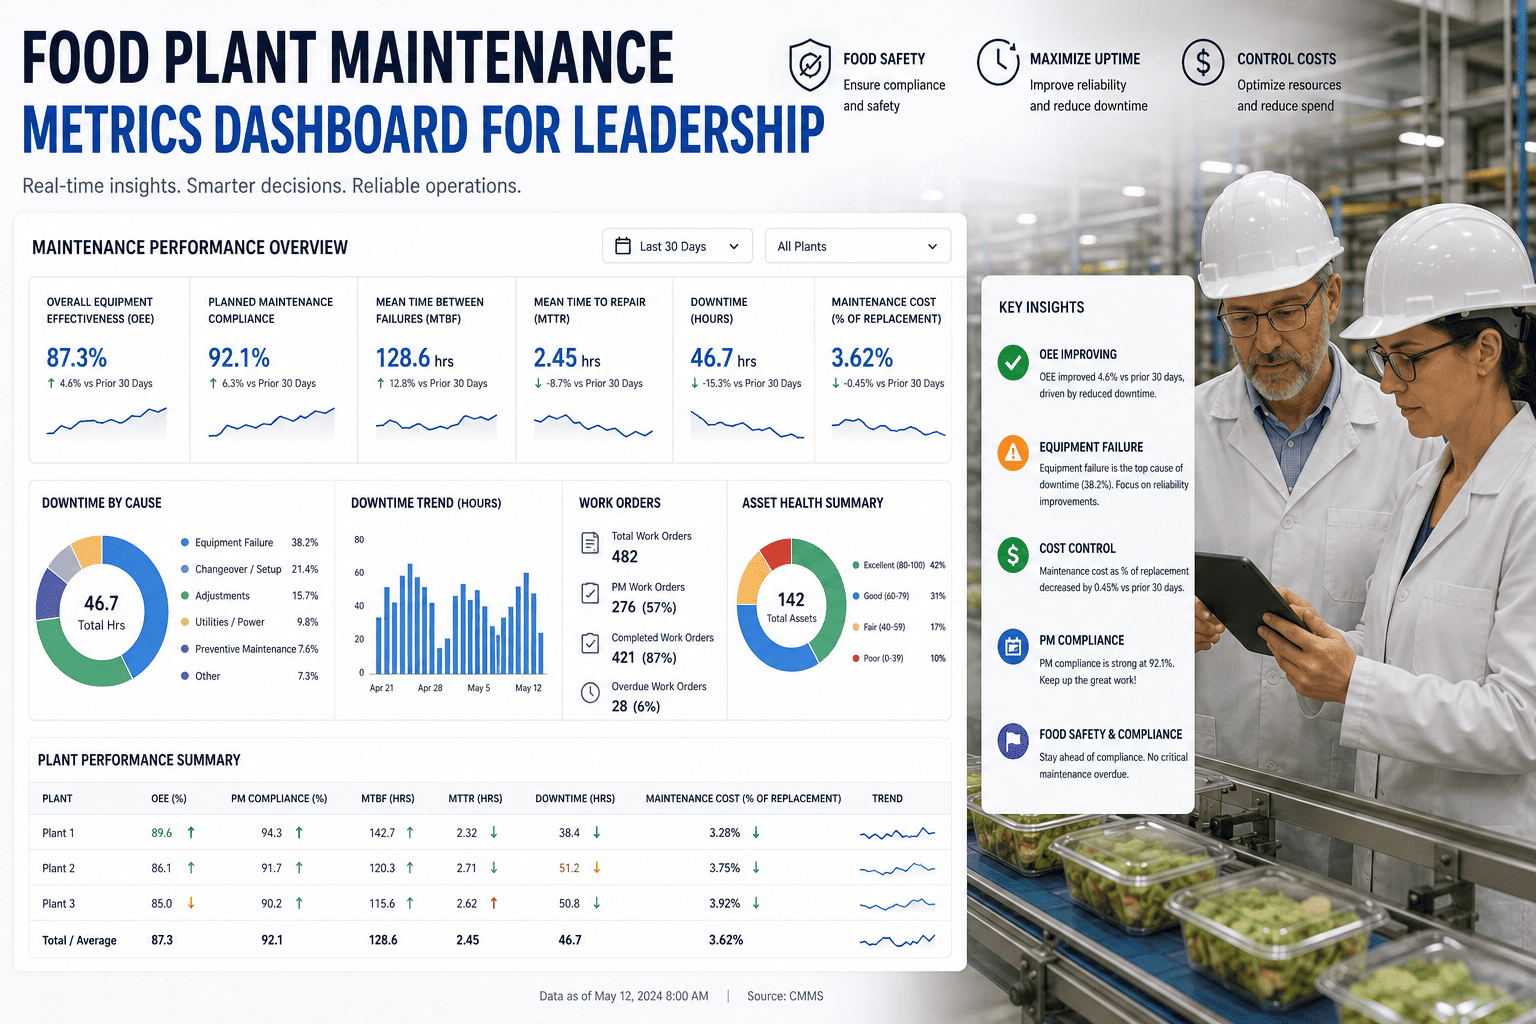
A food plant maintenance metrics dashboard gives leadership teams real-time visibility into the KPIs that determine whether your facility is running profitably, safely, and in compliance — or quietly accumulating risk that will surface as a line stoppage, failed audit, or recall. This guide covers the metrics that matter, how to structure them for leadership consumption, and how to connect your CMMS data to a dashboard that actually drives decisions.
See your food plant maintenance KPIs in a live Oxmaint dashboard — built from your actual CMMS data, ready in days.
- ✓ Real-time OEE, downtime, and PM compliance metrics in one view
- ✓ Auto-generated leadership reports — no spreadsheet compilation
- ✓ FSMA and FDA audit-ready compliance tracking built in
Trusted by food manufacturing teams across 9+ industries · Live in days, not months
What is a food plant maintenance metrics dashboard — and what should leadership see on it?
A food plant maintenance metrics dashboard is a real-time visual interface that aggregates KPIs from your CMMS — downtime frequency, PM compliance rate, work order backlog, mean time between failures, OEE, and regulatory compliance status — into a format leadership can read and act on without needing a maintenance engineering background. It bridges the gap between floor-level maintenance data and boardroom decision-making.
Most food manufacturing leadership teams make capital allocation, staffing, and maintenance strategy decisions with outdated or incomplete data. The monthly maintenance report compiled from spreadsheets tells you what happened last month — not what's happening now or what's about to go wrong. A live dashboard changes that: leadership sees the health of every production line, the compliance status of every critical asset, and the trajectory of maintenance costs in real time.
In food manufacturing specifically, the dashboard must go beyond operational efficiency. FSMA regulations, FDA inspection readiness, allergen control equipment status, and cold chain asset performance are compliance-critical KPIs that belong on every food plant leadership dashboard. Teams using Oxmaint for food manufacturing get these metrics pre-built and connected to live CMMS data — start a free trial to see your facility's metrics live, or book a demo and we'll build your dashboard together.
8 food plant maintenance KPIs every leadership dashboard must track
Each KPI below includes the leadership question it answers and the operational threshold to monitor.
OEE — Overall Equipment Effectiveness
The single number that captures availability, performance, and quality rate in one score. Leadership question: "Is our equipment running at its designed capacity?" World-class food manufacturing targets 85%+ OEE. Below 65% signals a maintenance strategy problem, not just an equipment problem.
PM Compliance Rate
Percentage of scheduled preventive maintenance tasks completed on time. Leadership question: "Are we maintaining equipment proactively or waiting for failures?" PM compliance below 80% predicts increasing unplanned downtime within 60–90 days. In food manufacturing, it also signals regulatory exposure.
Unplanned Downtime Hours
Total hours of unscheduled production stoppage caused by equipment failures, by line and by asset. Leadership question: "Which lines are costing us the most in unplanned losses?" Track as a rolling 30/60/90-day trend — an upward trend signals degrading asset health or a PM strategy gap.
Mean Time Between Failures (MTBF)
Average operating time between failures for critical assets. Leadership question: "Are our critical assets becoming more or less reliable over time?" Improving MTBF confirms your PM and predictive maintenance strategy is working. Declining MTBF on a specific asset class demands immediate attention.
Mean Time to Repair (MTTR)
Average time to restore equipment to operational condition after a failure. Leadership question: "How fast does our team respond and resolve?" High MTTR points to parts availability issues, skill gaps, or procedure bottlenecks — each with a different remediation path.
Reactive vs Planned Maintenance Ratio
Percentage of work orders that are reactive (unplanned) versus planned. Leadership question: "Are we running a proactive operation or a reactive one?" Industry best practice targets reactive work below 20% of total WO volume. Above 40% indicates a systemic maintenance strategy problem.
Compliance Asset Inspection Rate
Percentage of FDA, FSMA, and HACCP-mandated inspections completed on schedule for critical control point equipment. Leadership question: "Are we audit-ready?" This must be 100% — any gap is regulatory exposure. Track separately from standard PM compliance for visibility.
Maintenance Cost per Unit Produced
Total maintenance spend divided by production volume — the bridge between maintenance operations and financial performance. Leadership question: "Is our maintenance investment efficient?" Rising cost per unit produced, independent of volume changes, signals aging assets or escalating reactive repair spend.
Oxmaint tracks all 8 KPIs automatically from live work order data — see OEE Analytics or book a demo to see your facility's dashboard.
4 reasons food plant maintenance dashboards don't get used — and how to fix them
Data Is Always Stale
Monthly compiled reports tell leadership what happened 30 days ago. By the time an upward downtime trend appears in a monthly report, the asset has already failed twice. Real-time dashboard data from a live CMMS connection changes the leadership posture from post-mortem to early intervention — the difference between a $15K planned repair and a $240K emergency shutdown.
Too Many Metrics, No Hierarchy
Dashboards built by maintenance engineers contain every metric the CMMS can produce — which means leadership spends 20 minutes trying to find what matters. A leadership dashboard needs a clear hierarchy: three to five headline KPIs visible immediately, with drill-down capability for detail. If it takes more than 10 seconds to read, it won't be used in a leadership meeting.
Compliance Metrics Absent or Hidden
Food manufacturing leadership carries personal liability for FDA and FSMA compliance failures. A maintenance dashboard that doesn't prominently surface compliance asset inspection status, overdue regulatory work orders, and audit trail completeness is not fit for food manufacturing leadership consumption — regardless of how good the OEE chart looks.
No Connection to Financial Impact
Downtime hours mean nothing to finance unless translated to production loss value. Maintenance cost trends mean nothing without a cost-per-unit-produced trend alongside production volume. Leadership dashboards that don't bridge operational metrics to financial impact get deprioritized when budget pressure mounts — exactly when the data is most needed.
Oxmaint's analytics and reporting module bridges operational metrics to financial impact automatically — start free or book a demo.
How Oxmaint delivers a food plant maintenance dashboard leadership actually uses
Live OEE and Downtime Tracking
Real-time OEE by line, shift, and asset — updated continuously from work order closures and sensor data. Leadership sees production efficiency right now, not last month. See OEE Analytics →
Predictive Failure Alerts on Dashboard
AI-flagged failure predictions appear on the leadership dashboard 2–4 weeks before equipment fails — enabling capital and resource decisions before the stoppage, not after. See Predictive Maintenance →
FSMA Compliance Status — Always Visible
Compliance asset inspection rates, overdue regulatory work orders, and audit trail completeness displayed prominently — so leadership knows audit readiness status without asking the maintenance manager. See Safety & Compliance →
Auto-Generated Leadership Reports
Weekly and monthly maintenance performance summaries — MTBF, MTTR, PM compliance, cost per unit — generated automatically and distributed to leadership on schedule. No spreadsheet compilation. See Analytics & Reporting →
Maintenance Cost to Production Bridge
Maintenance spend and downtime hours translated to production loss value automatically — so leadership sees financial impact alongside operational metrics in the same view. ROI Calculator →
Multi-Site Dashboard Consolidation
For food manufacturers operating multiple plants, Oxmaint consolidates KPIs across all sites into a single leadership view — enabling benchmarking and resource allocation decisions across the portfolio. See all features →
Reactive reporting vs live maintenance metrics dashboard — what leadership actually gets
| Leadership Need | Monthly Compiled Report | Oxmaint Live Dashboard |
|---|---|---|
| Data freshness | 30 days old at time of review | Real-time, updated on every WO closure |
| Downtime visibility | Total hours last month | Live by line, shift, and asset with cost impact |
| Failure prediction | Not available — historical only | AI flags failures 2–4 weeks before they occur |
| FSMA compliance status | Separate audit preparation process | Live compliance rate, overdue inspections visible |
| PM compliance rate | Approximate, manually calculated | Exact, real-time, by asset class and priority |
| Report preparation time | 4–8 hours manager time monthly | Auto-generated, zero preparation time |
| Multi-site comparison | Separate reports per site, manual consolidation | Single dashboard, all sites, benchmarked |
Ready to replace your compiled report with a live dashboard? Calculate the ROI or book a demo and we'll build your food plant dashboard together.
What food plants achieve when leadership has real-time maintenance visibility
See what a live dashboard would show for your facility — use the ROI Calculator or start a free trial.
Food plant maintenance dashboard — questions leadership teams ask
What KPIs should be on a food plant maintenance dashboard for senior leadership?
The five headline KPIs for food manufacturing leadership are: OEE by production line, unplanned downtime hours and cost impact, PM compliance rate, compliance asset inspection rate (FSMA/FDA), and reactive vs planned maintenance ratio. These five answer the questions leadership actually asks: Is the plant running efficiently? Are we compliant? Are we maintaining proactively or firefighting? Below these, drill-down metrics like MTBF, MTTR, cost per unit, and work order backlog provide the detail for operational decisions. See OEE Analytics in Oxmaint →
How do I connect my CMMS data to a leadership maintenance dashboard?
Modern CMMS platforms like Oxmaint include built-in analytics dashboards that auto-populate from live work order, inspection, and asset data — no separate BI tool or data pipeline required. Legacy CMMS platforms typically require an export-to-BI-tool workflow, which introduces the data freshness problem: reports are as current as the last export. For food manufacturing leadership, real-time connectivity is the only configuration that supports proactive decision-making. Book a demo to see Oxmaint's live dashboard →
What is a good PM compliance rate benchmark for food manufacturing?
Industry best practice for food manufacturing PM compliance is 90–95% or above for critical assets, and 85%+ for non-critical. Below 80% is a warning signal — PM deferrals at that rate reliably predict increasing unplanned downtime within 60–90 days. For FSMA-regulated equipment (CCPs, allergen control, refrigeration), PM compliance must be treated as a compliance requirement, not just an operational target, because gaps create audit exposure regardless of whether equipment fails.
How often should food plant leadership review maintenance metrics?
For food manufacturing operations with live dashboard access, the recommended cadence is: daily for maintenance managers (downtime, open WOs, alerts), weekly for operations leadership (OEE trend, PM compliance, backlog), and monthly for senior leadership and finance (cost per unit, CapEx indicators, MTBF/MTTR trends, compliance rates). The dashboard should be always accessible for ad-hoc review — particularly when production targets are at risk or an audit is approaching. See Oxmaint reporting cadence options →
Stop Reporting Last Month's Failures — Start Preventing Next Month's
Your food plant leadership team deserves a maintenance dashboard that shows what's happening right now, what's predicted to fail next, and whether your facility is audit-ready — not a spreadsheet that tells them what went wrong 30 days ago. Oxmaint delivers that visibility from day one.
- ✓ Real-time OEE, downtime, PM compliance, and FSMA status in one view
- ✓ AI failure predictions on the dashboard 2–4 weeks before the line stops
- ✓ Auto-generated leadership reports — zero spreadsheet compilation
Trusted by food manufacturing teams globally · 1,000+ clients · Live in days, not months