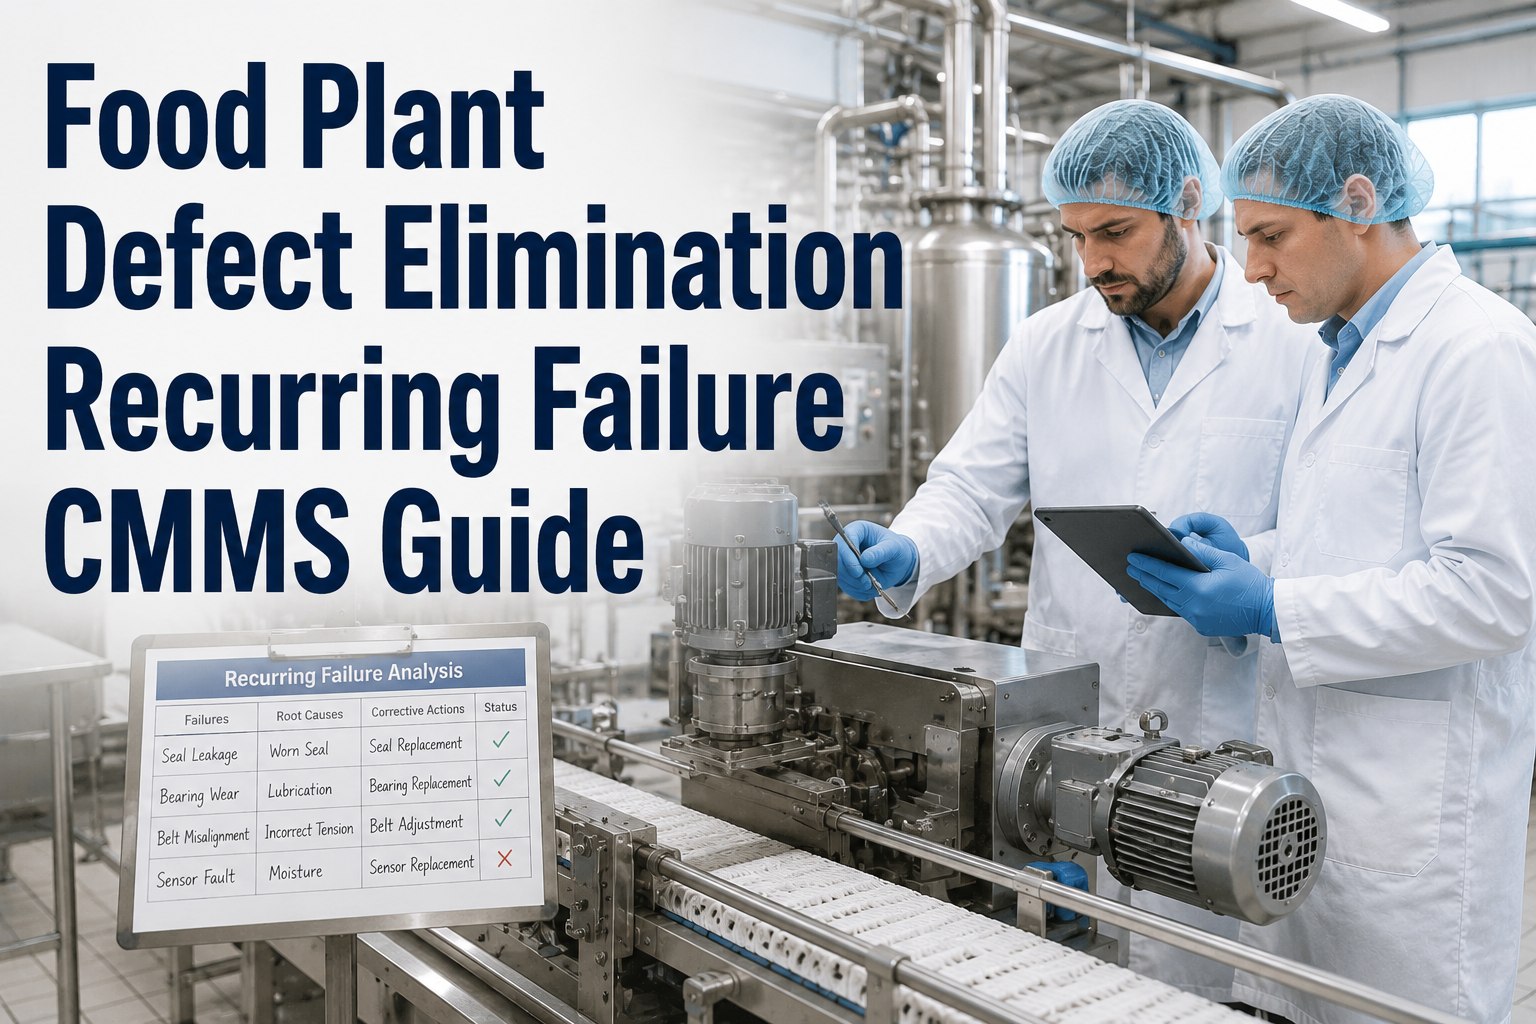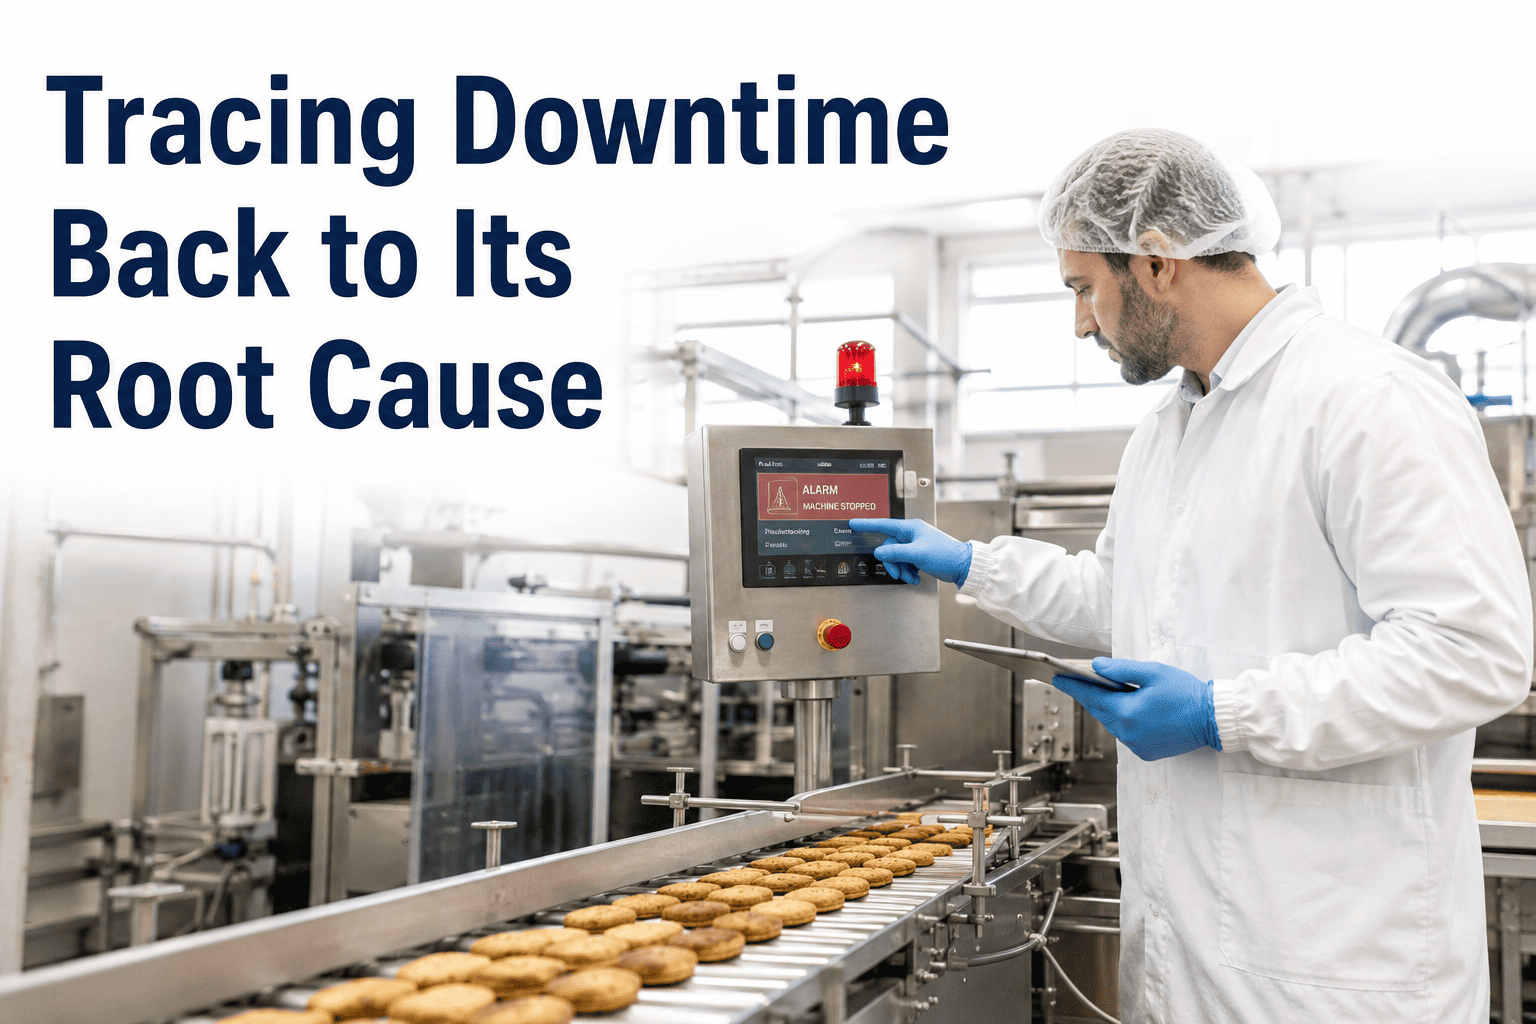
A 340,000 square foot snack manufacturing plant in Ohio logged eleven unplanned stops on its extrusion line in a single month, and every single one was written up as "motor fault" and closed within the hour. Nobody asked why the same motor kept failing until a reliability lead pulled twelve months of work orders and found the pattern: every failure landed within 48 hours of a changeover, when temperature swings stressed a bearing that was never rated for that cycle. The fix cost four hundred dollars in bearing spec and recovered sixty hours of downtime a year. Most food plants fix the breakdown sitting in front of them and never trace it back far enough to stop the next nine identical ones. Root cause analysis tied directly to a CMMS turns eleven mystery stops into one findable pattern — start a free trial and see how OxMaint links every downtime event back to its cause automatically.
Downtime Root Cause Analysis for Food Manufacturing Plants
Stop logging symptoms and start finding the failure pattern underneath them. Pareto-based prioritisation, structured RCA triggers, and root cause tracking that ties every stop back to the asset, the shift, and the fix — inside the CMMS your team already uses.
Why Root Cause Investigations Stall on a Food Plant Floor
Most work orders close the moment the line restarts, not when the cause is understood. A technician resets a breaker, swaps a belt, or clears a jam, and the ticket says "resolved." The failure mode never gets recorded, so the same asset fails again in six weeks under a different work order number, invisible as a repeat offender. Four forces drive the majority of food plant downtime, and each one points to a different fix.
The Four Layers Under Every Downtime Event
A line stop is a symptom, not an explanation. Real root cause analysis moves through four layers before it lets a technician close the ticket — skip a layer and the same failure reappears under a new work order number within a quarter.
The line stops, an alarm fires, or a batch fails inspection. This is the only layer most reactive tickets ever record.
A bearing seized, a sensor lost signal, a belt snapped. Identifiable in minutes with a visual or diagnostic check.
Overdue lubrication, a chemistry change in cleaning agents, or a changeover that stressed a part beyond spec.
A PM interval set wrong at commissioning, a spare-parts spec mismatch, or a training gap repeated across every shift.
Where 80% of Your Downtime Hours Actually Live
Pareto analysis is the fastest way to stop chasing every alarm equally. Pull twelve months of stoppage data by asset class and the pattern is almost always the same: a handful of equipment categories consume most of the clock, while dozens of smaller assets barely register.
Matching the RCA Method to the Failure
Not every stop needs a full investigation, and not every method fits every failure. Structured plants pick the tool based on how many assets are affected and how repeatable the failure pattern already looks.
| Failure Pattern | Best RCA Method | Typical Time to Root Cause | Who Should Run It |
|---|---|---|---|
| Single asset, repeat failure | 5 Whys drill-down | 30-60 minutes | Shift technician + supervisor |
| Same fault, multiple assets | Fishbone / cause categories | 2-4 hours | Reliability engineer |
| Unknown pattern, high stop count | Pareto prioritisation first | 1 day on 12 months of data | Maintenance planner |
| Safety or food-safety event | Formal RCA with sign-off | 1-3 days, documented | Quality + maintenance leads |
| Recurring across shifts | Shift-pattern comparison | 1 week of trend review | Plant manager |
Every Work Order Should End With a Cause, Not Just a Fix
OxMaint prompts a root cause field before a downtime work order can close, links repeat failures on the same asset automatically, and surfaces the Pareto view your next reliability meeting actually needs.
Common Failure Categories and Where to Look First
Before opening a full investigation, check whether the failure already matches a known category. Most food plant stoppages fall into one of five recognisable buckets, each with its own fastest diagnostic path.
| Category | Typical Share of Stops | Fastest Diagnostic | CMMS Data to Pull |
|---|---|---|---|
| Mechanical wear | 38% | Vibration or heat check on the asset | Last 3 PM cycles, part replacement history |
| Electrical / controls | 19% | Fault code and sensor log review | Alarm history, firmware or calibration date |
| Sanitation-related corrosion | 16% | Visual inspection post-washdown | Chemistry change log, wetted-asset registry |
| Changeover / setup error | 15% | Compare against digital SOP steps | Operator log, changeover checklist completion |
| Spare-parts stockout | 12% | Check reorder point against usage rate | Inventory turns, lead time by supplier |
How OxMaint Turns Every Stop Into a Root Cause Record
A downtime event captured once, in one place, with the cause attached to the asset — not scattered across shift logs, whiteboards, and technician memory.
Reactive Logging vs Root-Cause-Driven Maintenance
The same plant, the same equipment, the same twelve months of data — but a completely different outcome depending on whether downtime is logged as a symptom or traced to its cause.
- 800 hrsUnplanned downtime absorbed per year, unchanged year over year
- RepeatSame failure reopens under a new work order every few weeks
- GuessworkCapital and PM decisions based on memory, not data
- ManualPareto analysis reconstructed by hand before each review
- -40%Typical reduction in unplanned downtime within 12 months
- FlaggedRepeat failures surfaced automatically at the second occurrence
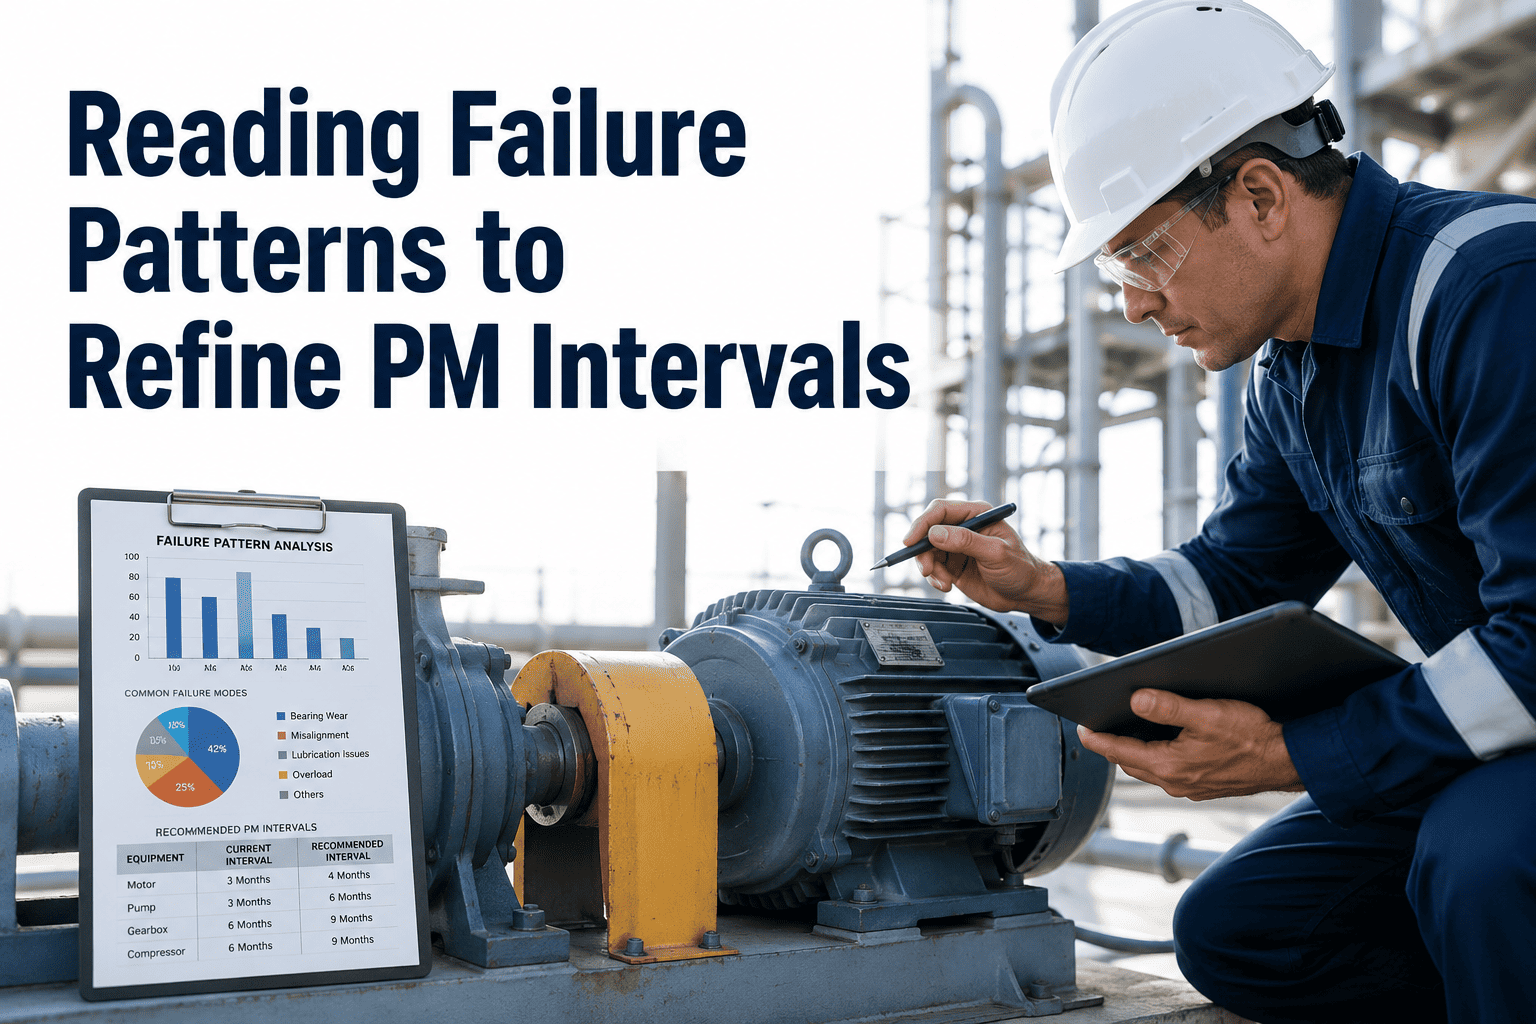
- Data-ledPM intervals and spare-parts specs adjusted from actual failure trends
- LivePareto and cause views ready before the meeting starts
Frequently Asked Questions
Stop Logging Symptoms. Start Finding Root Causes.
OxMaint captures every downtime event at the source, guides technicians from symptom to root cause before a ticket can close, and builds the Pareto view your reliability team needs — automatically, every time.