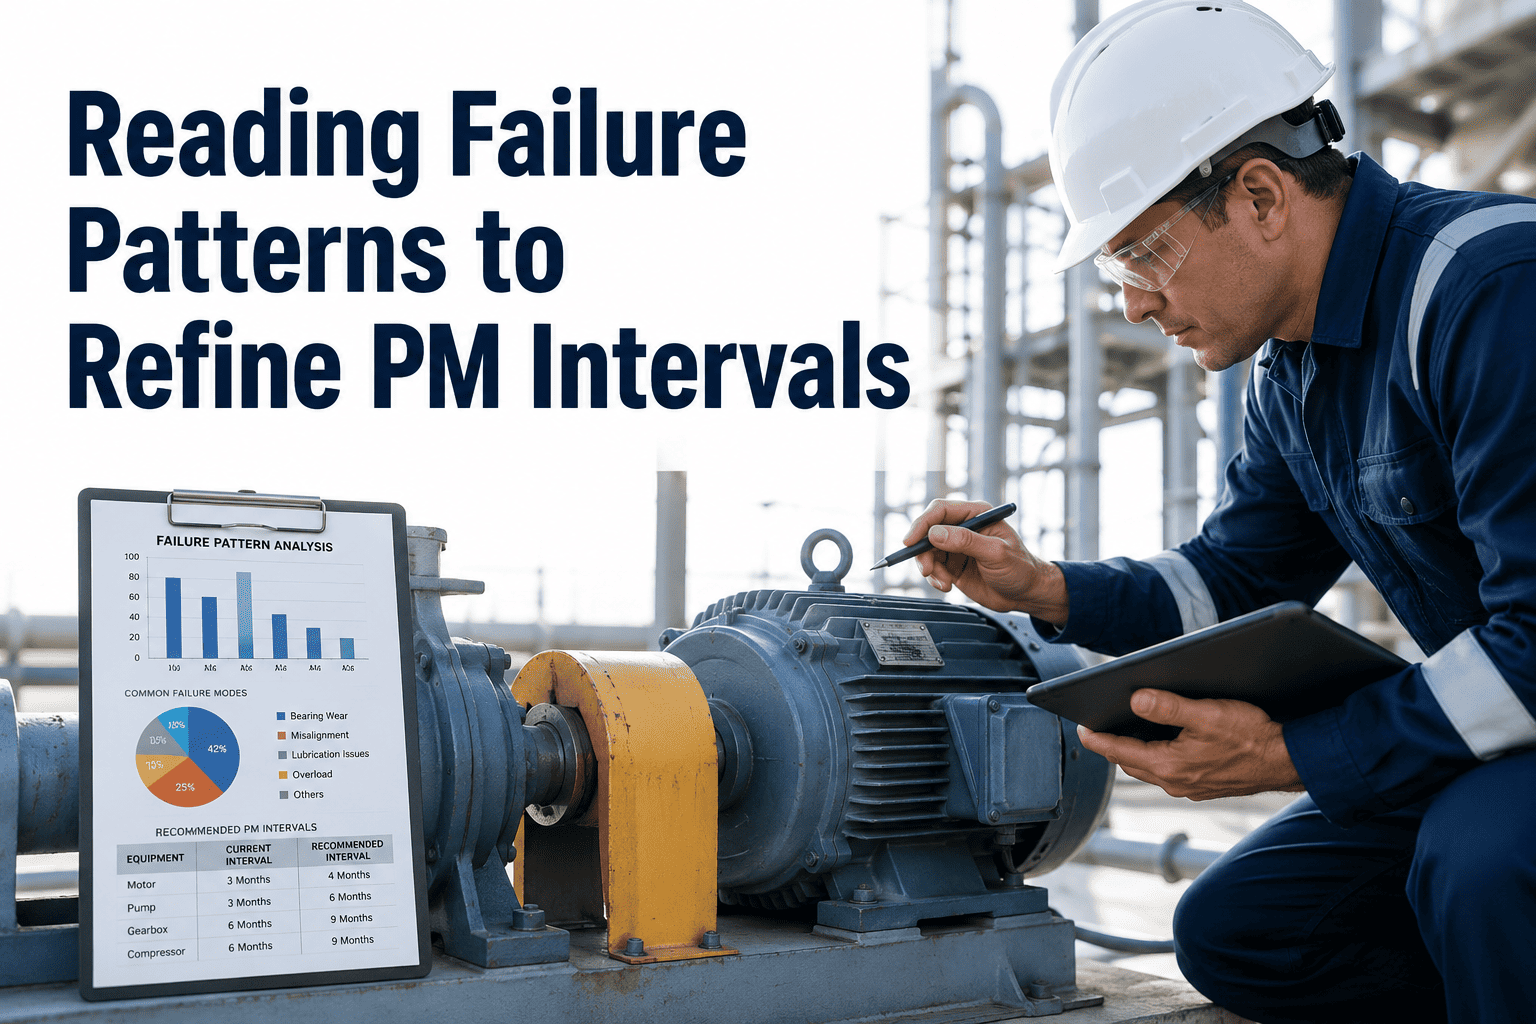
Every food processing plant develops its own private catalog of failures — a bearing that seizes at 2,100 hours instead of the OEM's 4,000, a food-grade seal that hardens after 90 days of caustic CIP washdown instead of the specified 180, a conveyor chain that stretches past its 3% wear limit at week 22 instead of week 40. Manufacturer PM intervals are averages built from generic operating conditions, and your plant is not generic — its washdown chemistry, thermal cycling, load profile, and ambient humidity produce failure signatures only your own closed work orders can reveal. Reading those signatures is the difference between over-servicing healthy assets and missing the ones actually degrading. Start refining plant-specific PM intervals from your own failure data with OxMaint's failure pattern analytics for food processing.
Failure Pattern Analysis · Food Processing PM Refinement
A Bearing Does Not Fail Suddenly. It Writes a Signature for Weeks First.
Every food-plant asset moves through five detectable phases before it stops production. Calendar PM programs miss all five. Failure-pattern-driven PM programs catch them in the CMMS data and refine the intervals every quarter.
01
Baseline
Asset runs at nameplate spec. Vibration, temperature, amp draw stable within band.
02
Drift
Sensor readings quietly move 3–7% off baseline. Nothing alarms. Nothing looks broken.
03
Symptom
Operator notices heat, noise, or a slight drop in throughput. Logs it or does not.
04
Failure
Component fails during a production run. Line stops. Emergency work order raised.
05
Cascade
Product loss, sanitation redo, HACCP deviation review, cost 3–5x the planned repair.
Failure pattern analysis reads phases 01 and 02 from CMMS work-order history — and shifts the PM interval left of phase 03.
68%
of recurring food-plant failures trace to root causes unresolved by the first repair
25–35%
of scheduled PM hours in calendar-driven food plants are spent on healthy assets
70–80%
of total food-plant downtime comes from only the top 3–5 recurring failure modes
3–5x
cost multiplier of reactive repair vs planned repair from the same detected signature
The Six Recurring Failure Signatures Every Food Plant Writes
Across dairy, meat, bakery, frozen, and beverage facilities, six failure signatures account for the majority of unplanned maintenance events. Each one leaves a specific fingerprint in the CMMS long before it stops a line. Recognize the signature, and the PM interval refines itself.
S1
Food-grade seals & gaskets — CIP-driven hardening
Thermal cycling from hot CIP followed by cold rinse degrades EPDM and PTFE seals faster than dry-industrial equivalents. The signature: intermittent minor leaks logged 2–4 weeks apart on adjacent assets before a full seal failure.
S2
Conveyor chains & belts — stretch and edge fraying
Continuous operation in wet, cold, chemical-laden zones produces stretch on chains and fray on belt edges. The signature: tracking adjustments logged with rising frequency 6–10 weeks before catastrophic belt tear or chain jump.
S3
Rotating equipment bearings — thermal & moisture wear
Bearings on pumps, motors, mixers, and conveyor drives run in washdown zones with H1 lubricant limits. The signature: gradual amp-draw rise, subtle temperature drift, and increased noise reports logged across a 3–6 week window.
S4
CIP spray balls & valves — mineral & product residue
Blocked spray-ball holes reduce coverage and force longer cycles, which mask further degradation. The signature: cycle-time extension logged progressively across weeks, followed by a failed ATP swab or a bio-load result flagged in QC.
S5
Refrigeration compressors — discharge temp & amp climb
Blast freezers and cold-store compressors show elevated discharge temperature, rising amp draw, and unusual vibration for weeks before catastrophic failure. The signature: incremental drift across three or more log entries, none alarming individually.
S6
Electrical terminals in washdown zones — corrosion drift
High-humidity food environments corrode terminals slowly. The signature: intermittent nuisance trips and false sensor readings clustered around specific panels, logged as one-off "reset and reboot" work orders across 4–8 weeks.
From OEM defaults to your plant's real numbers
Turn Twelve Months of Closed Work Orders Into Refined PM Intervals
OxMaint captures structured failure codes on every closed work order, computes MTBF per asset class as the data accumulates, and surfaces where OEM intervals no longer match your plant's actual failure horizon.
The 80/20 of Food Plant Failure Modes
Reliability analysis across food-processing datasets consistently shows the same distribution — a small number of failure modes account for a disproportionate share of downtime hours. Ranking your CMMS failure codes by Pareto is the first analytical move after twelve months of clean data.
Downtime hours by failure mode — reference food plant (annual)
Top 5 modes drive 76% of total unplanned downtime
Bearing wear on rotating equipment
22%
Seal & gasket degradation (CIP-driven)
18%
Conveyor chain stretch / belt fray
15%
CIP spray-ball & valve fouling
12%
Refrigeration compressor faults
9%
Electrical connections & sensor drift
8%
Pneumatic / hydraulic actuator wear
7%
All other failure modes (long tail)
9%
The Interval Refinement Journey — From OEM Default to Facility Truth
A refined PM interval is not a guess and not a manufacturer's number. It is the failure horizon your own CMMS data reveals, set to 80–90% of measured MTBF so the PM lands before the failure — but not so early that it wastes labor on a healthy asset.
Manufacturer default
Bearing lubrication (drive motor)
Every 500 hours
Food-grade seal replacement
Every 180 days
Chain elongation check
Monthly
CIP spray-ball inspection
Quarterly
Compressor discharge log
Weekly
Set at commissioning, never revised
12 months of failure data
Facility-refined interval
Bearing lubrication (drive motor)
Every 340 hours
Food-grade seal replacement
Every 110 days
Chain elongation check
Bi-weekly + condition trigger
CIP spray-ball inspection
Weekly + cycle-time trigger
Compressor discharge log
Continuous (sensor-fed)
Refined against MTBF, reviewed quarterly
How a CMMS Reads Failure Patterns — The Five-Step Analytical Loop
Failure pattern analysis is not a one-time audit. It is a repeating analytical loop that runs inside the CMMS every quarter. The steps below turn raw work-order data into refined PM intervals — and then feed the next quarter's refinement.
01
Capture structured failure codes on every closed work order
Failure mode, component, cause, and downtime hours become mandatory close-out fields. Free-text notes are optional. The structure is what makes the data analyzable — free text alone produces the "data swamp" that never yields patterns.
02
Compute MTBF per asset class, per failure mode, per line
The CMMS auto-calculates mean time between failures from operating hours, not calendar time. Fragmenting MTBF by mode reveals which failure signature is actually driving the downtime hours on that asset class.
03
Apply Weibull shape parameter to classify the failure region
Beta below 1 indicates infant mortality (repair quality or install issue). Beta near 1 indicates random failure (condition monitoring wins). Beta above 1 indicates wear-out (PM interval refinement wins). Each region calls for a different intervention.
04
Refine the PM interval to 80–90% of measured failure horizon
For wear-out failures, set the PM at 80–90% of the field MTBF — early enough to catch the degradation, late enough to avoid over-service. For critical CCP-adjacent assets, use 70–80% to widen the safety margin.
05
Schedule quarterly interval review as a recurring CMMS task
Interval refinement is not a project — it is a standing rhythm. Every 90 days, the CMMS surfaces where MTBF has shifted more than 15% from the current PM interval and prompts a documented decision to hold or refine.
Failure Signature Reference Table — Food Plant Assets
A working reference for the reliability lead building the failure-code taxonomy in the CMMS. Weibull shape parameter (β) values are typical field observations from published food-plant reliability datasets and are starting points for your own analysis.
See your own plant's failure signatures — with your own data
Map the Top 5 Failure Modes Driving 76% of Your Downtime
A 30-minute walkthrough with the OxMaint team is enough to import your last twelve months of work orders, generate the Pareto, and show which PM intervals are draining labor on healthy assets — and which are missing the degrading ones.
From Failure Data to Refined PM — The 18-Month Trajectory
Failure pattern analysis is a compounding practice. The first three months build the data foundation. The next six generate the first refinements. By month 12 the plant is running on facility-truth intervals. By month 18 the loop is fully self-sustaining.
M 0–3
Foundation — structured failure-code capture goes live
Failure-mode taxonomy defined per asset class. Close-out fields become mandatory. Technicians trained on the four required codes. Data quality target: 85% of closed work orders with complete failure classification.
M 4–6
First analysis — Pareto and initial MTBF surfacing
CMMS auto-generates the failure-mode Pareto. Top 5 modes flagged. Initial MTBF calculations available for asset classes with sufficient event counts. First interval anomalies (OEM vs field) documented.
M 7–12
First refinement — PM intervals adjusted for top failure modes
Reliability lead publishes refined intervals for the top 5 failure modes. Over-maintenance flags reduce PM labor 18–22% on healthy asset classes. Recurring-failure rate begins measurable decline.
M 13–18
Continuous loop — quarterly review becomes the operating rhythm
MTBF trend dashboards live at plant leadership. Quarterly refinement is a standing CMMS task, not a project. Field-refined intervals feed HACCP compliance evidence with continuous sensor backing.
KPIs That Prove Failure Pattern Analysis Is Actually Working
Target > 90%
Failure-code data quality
Percentage of closed work orders with complete failure mode, component, and cause classification. Below 75% means the Pareto lies and the MTBF calculations are unreliable.
Target < 15%
"No defect found" PM rate
Percentage of scheduled PMs closed with no measurable finding or corrective action. Above 30% signals systemic over-maintenance and wasted labor on healthy assets.
Track quarterly
Top 5 failure-mode Pareto
Ranked list of failure modes by downtime hours, refreshed every 90 days. A stable top-5 means PM refinement is compounding. A shifting top-5 signals a new signature emerging.
Target < 8%
90-day repeat-failure rate
Percentage of failures that recur on the same asset within 90 days of the initial repair. The single strongest indicator of unresolved root causes and interval mis-set.
Trend monthly
MTBF per critical asset class
Rolling 12-month MTBF for pasteurizers, CIP pumps, primary conveyors, filling heads. A rising trend proves refinement is working. A flat or falling trend triggers RCA escalation.
Track > 15% shift
Interval variance vs OEM
Percentage gap between current PM interval and OEM default per asset class. A widening gap is not a problem — it is the evidence that facility-specific refinement is producing plant-truth intervals.
The Real-World Payoff — What Failure Pattern Analysis Recovers
Reference facility · frozen & ready-meal processor · 4 lines · 220 monitored assets · 12-month program
Unplanned downtime reduction
−71%
PM labor recovered from healthy assets
−22%
Recurring-failure rate (90-day window)
−40%
Warning window for critical failures
2–4 weeks
Data quality on closed work orders
94%
Interval variance from OEM baseline
18–32%
Expert Perspective
"
The reliability engineer who tells you the OEM interval is right for your plant has not yet earned that opinion. Manufacturer intervals are the average of a global operating envelope. Your line runs three shifts of RTE production in a Wisconsin plant with 82% winter humidity and a CIP cycle that hits pH 12.4 on hot circulation. There is no universe where the seal on your filling head degrades on the same clock as the seal on a temperate-climate day-shift ambient beverage line. The whole discipline of failure pattern analysis is the humility to accept that only your own data can tell you when to intervene — and the operational rigor to capture that data cleanly enough to let it speak.
Marcus Halden, CMRP, PE
Reliability engineering lead · 21 years in food and beverage manufacturing · specialism in MTBF-driven PM refinement and Weibull-informed interval design for high-care and CCP-adjacent assets
Frequently Asked Questions
Q1
How much CMMS failure data do I need before I can trust MTBF-based interval refinement?
For most food-plant asset classes, twelve months of structured failure codes with at least eight to twelve failure events per class produces defensible MTBF numbers. High-frequency failure modes reach statistical usefulness sooner. Start refining top-Pareto items first — get support from
a 30-minute session to see your own data readiness.
Q2
What is the difference between failure pattern analysis and predictive maintenance?
Failure pattern analysis reads CMMS work-order history to refine PM intervals. Predictive maintenance reads live sensor data to catch specific developing faults. They are complementary — failure pattern analysis sets the right interval, predictive monitoring catches the outliers between intervals.
Q3
Won't refining PM intervals shorter than OEM void my equipment warranty?
The opposite is more common — OEM warranties require compliance with minimum PM cadence, not maximum. Refining intervals to catch failures earlier than OEM specifies exceeds the warranty requirement rather than violating it. Always document the refined interval and the failure data that drove it.
Q4
How do I get technicians to consistently log structured failure codes on work orders?
Make the failure-mode, component, and cause fields mandatory close-out requirements in the CMMS — no ticket closes without them. Keep the taxonomy short (10–15 codes per asset class), and show technicians the Pareto every quarter so they see their data used.
Start a free trial to configure the close-out gates.
Q5
Does failure pattern analysis satisfy FSMA and GFSI audit expectations?
Yes, and increasingly it is expected. FSMA-aligned auditors look for evidence that PM intervals are grounded in equipment reliability data, not just OEM defaults. A CMMS with time-stamped failure codes, MTBF trending, and documented quarterly refinements is exactly the evidence GFSI schemes ask to see.
One CMMS · failure codes captured · intervals refined every quarter
Stop Running Your PM Program on Someone Else's Averages
Every food plant writes its own failure signature. OxMaint captures the structured data, computes the MTBF, and surfaces the intervals that actually match your plant's washdown chemistry, thermal cycling, and production intensity. From OEM defaults to facility truth in one quarterly review at a time.