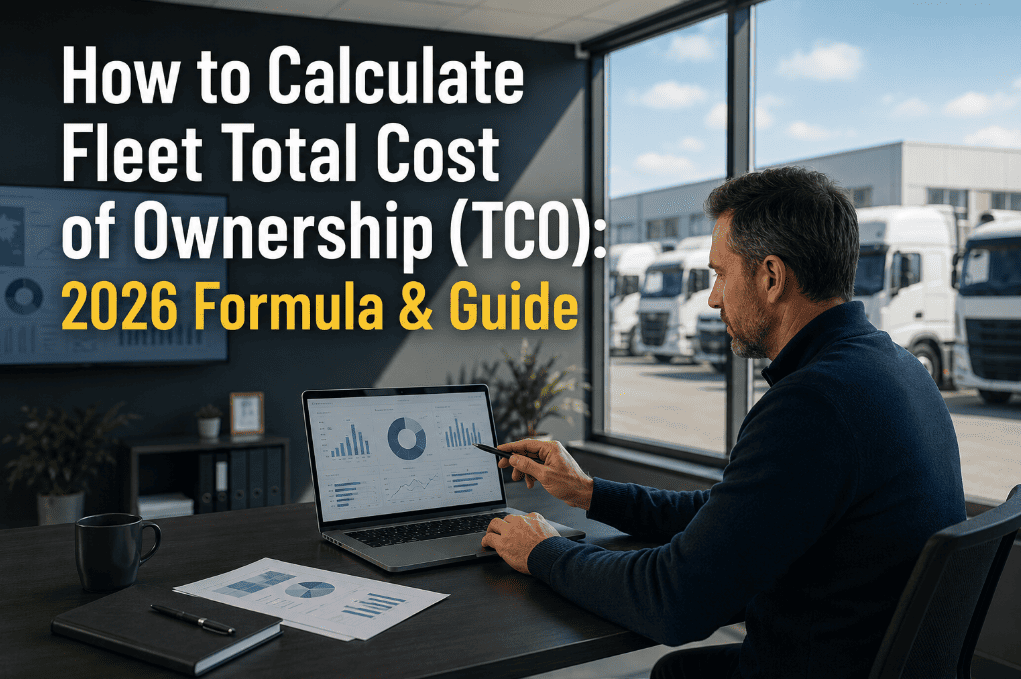
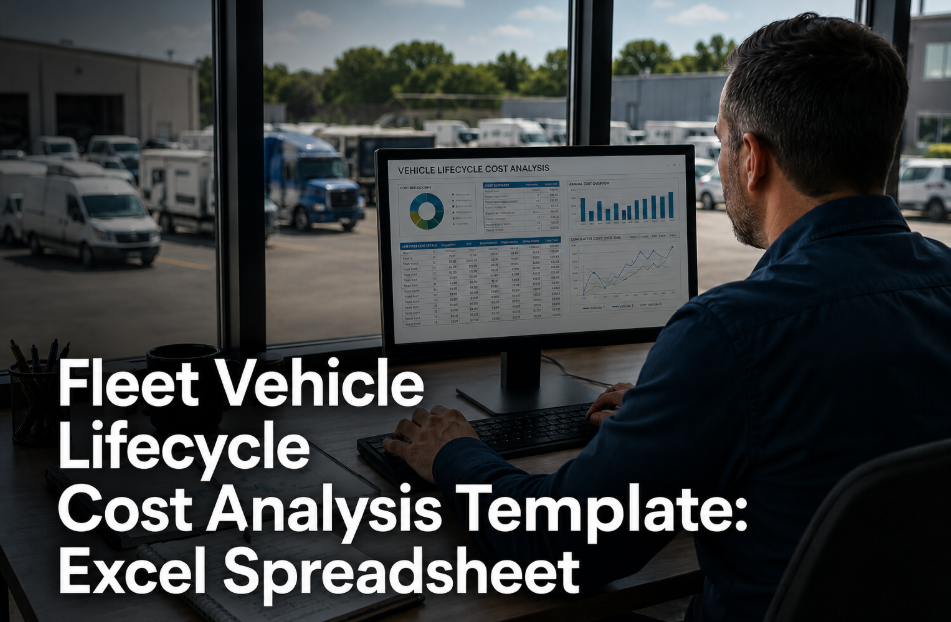
Most fleet replacement decisions are made by comparing last quarter's repair bills — which is about as reliable as choosing a new vendor based on their last invoice. The vehicle that cost $2,400 in repairs last quarter may have $0 residual value, 240,000 miles of wear, and a realistic remaining life of 14 months before the next major repair. The vehicle that cost $4,100 has 80,000 miles, full residual value, and 4 years of service life remaining. Total cost of ownership analysis reverses this logic: it includes acquisition, fuel, maintenance, insurance, depreciation, and disposal across the entire ownership period — producing a per-mile lifetime cost that makes replacement decisions financially objective rather than politically driven. Oxmaint builds TCO automatically per vehicle from day one of ownership. Book a demo to see your fleet's current TCO per vehicle calculated in Oxmaint.
Oxmaint calculates total cost of ownership per vehicle — acquisition, fuel, maintenance, insurance, depreciation, and disposal — updated automatically from live data so every replacement decision is backed by complete financial analysis, not instinct.
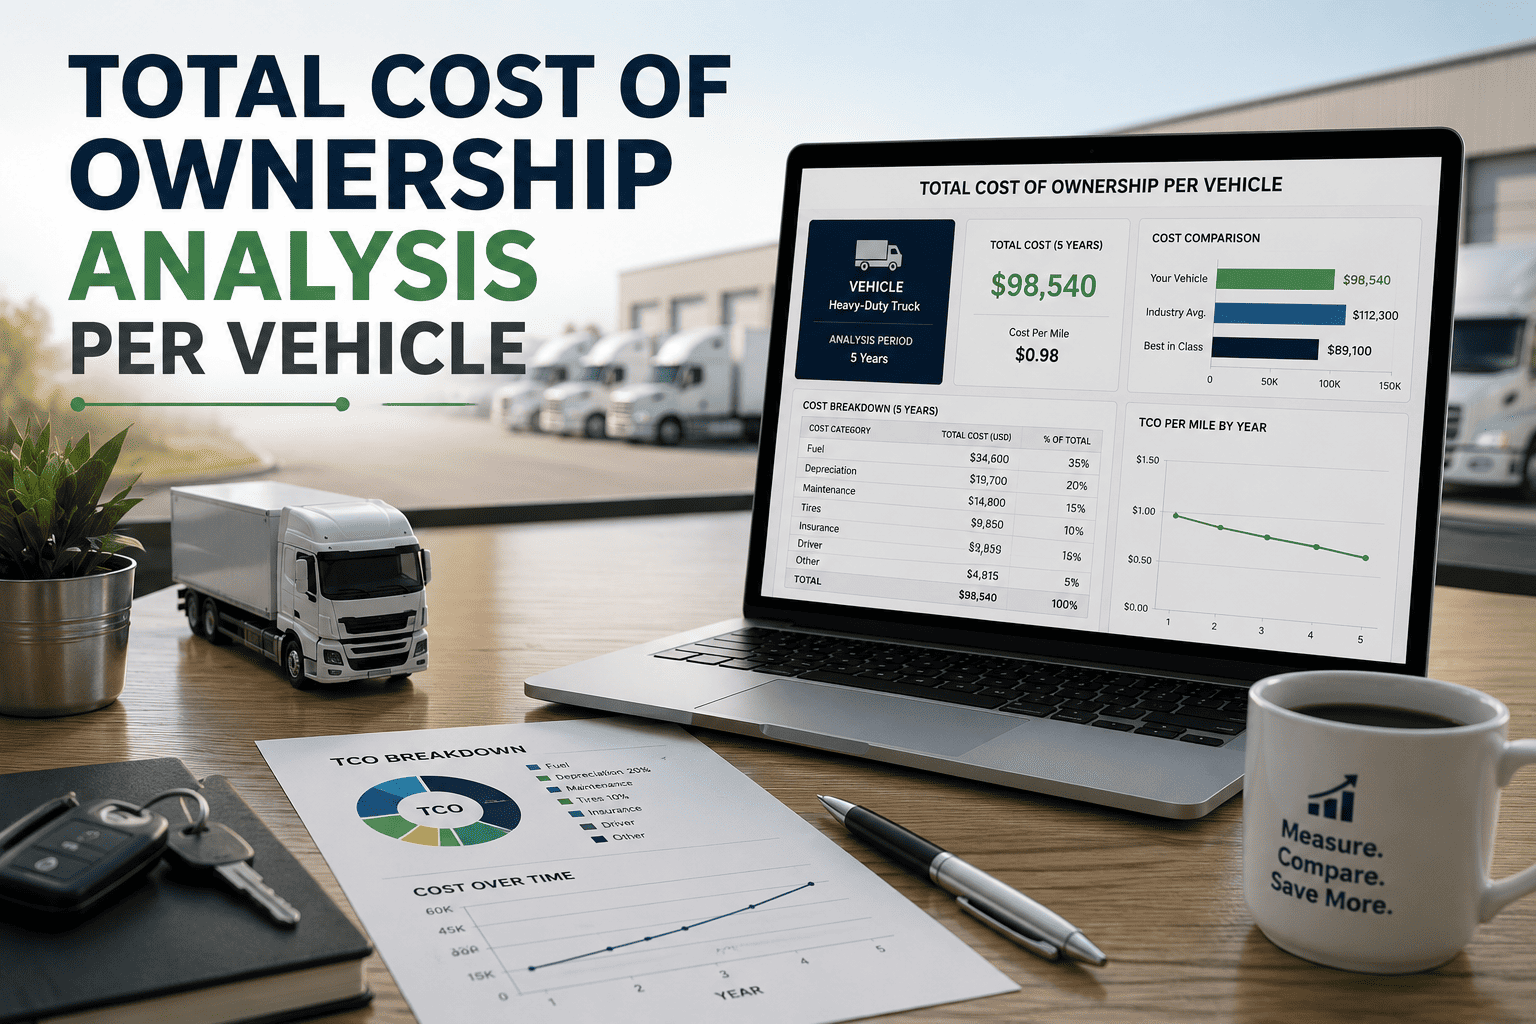
Fleet total cost of ownership includes six cost categories over the full ownership period: acquisition cost (purchase price minus incentives and fleet discount), fuel cost (total fuel spend from day one), maintenance cost (all planned and reactive repairs, parts, and labour), insurance cost (annual premiums and deductibles), depreciation (market value loss from acquisition to current), and disposal cost (end-of-life remarketing, towing, and administrative cost). Divided by total miles driven, this produces the lifetime cost per mile — the definitive metric that makes replacement timing and new vehicle acquisition decisions financially rigorous rather than opinion-based.
The Six TCO Components — What Goes Into a Complete Fleet Vehicle Lifecycle Cost
Each component has a different cost profile over time. Fuel is consistent. Maintenance rises exponentially. Depreciation is front-loaded. Understanding how each component evolves is what turns TCO from a one-time spreadsheet exercise into a live replacement strategy. Book a demo to see all six TCO components tracked live per vehicle in Oxmaint.
Purchase price, fleet discount, registration, and initial outfitting. The largest upfront cost but frequently the least important long-term — a $4,000 saving at purchase is irrelevant against a $14,400 fuel difference over 5 years on a less efficient model. Oxmaint records acquisition at vehicle creation and includes it in all lifetime calculations from day one.
Total fuel spend accumulated from acquisition — the largest variable cost and most sensitive to driver behaviour. A 10% increase in idle time raises fuel cost 4 to 6% over the ownership period. Oxmaint pulls fuel card data automatically and trends efficiency per vehicle — a declining mpg trend triggers an alert weeks before cumulative cost becomes a reporting problem.
All planned PM plus reactive repairs — parts, labour, and downtime costs. The exponentially rising component: a vehicle at 120,000 miles typically costs 2.4× more per month to maintain than at 60,000 miles. This cost curve is the primary input into replacement timing — Oxmaint tracks cumulative maintenance spend and projects the 12-month trajectory to flag the approaching break-even point early.
Annual premium accumulation plus deductibles on at-fault accidents and comprehensive claims. Directly linked to driver safety score — a driver below 75 costs $1,400 more per year in premiums than a driver above 90. Oxmaint connects safety scores to insurance cost tracking, making the financial case for driver coaching programmes immediately visible in the dashboard.
Market value loss from acquisition to current — steepest in years 1 and 2 (typically 35 to 45% in the first 24 months), then flattening. When annual depreciation loss is less than the annual additional maintenance cost of keeping the vehicle, the TCO break-even has passed. Oxmaint tracks current market value and flags vehicles that have crossed this threshold with a replacement recommendation.
End-of-life remarketing, auction fees, debranding, towing if non-mobile, and administrative processing. For fleets remarketing independently, disposal costs reach $800 to $1,400 per vehicle. Oxmaint tracks net disposal proceeds against total accumulated cost to produce a final lifetime P&L at vehicle retirement — the definitive measure of whether the vehicle delivered value over its owned life.
Every Vehicle Has a TCO Story. Oxmaint Reads It Automatically.
All six components accumulated from live data per vehicle from day one. No manual spreadsheet inputs. No quarterly reconciliation exercise. Book a demo to see your fleet's TCO calculated in Oxmaint.
Fleet TCO Dashboard — Six Metrics Oxmaint Tracks Per Vehicle
Six TCO-related KPIs that fleet directors examine in every planning cycle — tracked automatically in Oxmaint from live operational data.
TCO Benchmarks by Vehicle Type
TCO analysis is most valuable when comparing vehicle types during fleet renewal. This benchmark shows how TCO breaks down differently across common commercial fleet vehicle categories — useful as a baseline for procurement modelling.
| Vehicle Type | Avg Acquisition | Annual Fuel | Annual Maintenance | 5-Year TCO | TCO/Mile |
|---|---|---|---|---|---|
| Light Van (petrol/diesel) | $32K–$42K | $6,800–$9,200 | $2,800–$4,200 | $78K–$96K | $0.48–$0.62 |
| Light Van (electric) | $44K–$58K | $2,400–$3,600 | $1,200–$2,000 | $62K–$78K | $0.38–$0.48 |
| Box Truck (3.5t GVW) | $48K–$68K | $12K–$16K | $4,800–$7,200 | $118K–$152K | $0.58–$0.76 |
| Pickup Truck (work-spec) | $38K–$52K | $9,600–$13,200 | $3,200–$5,600 | $94K–$122K | $0.52–$0.68 |
| Refrigerated Van | $56K–$74K | $14,400–$18,800 | $6,400–$9,200 | $138K–$174K | $0.68–$0.88 |
How Oxmaint Calculates TCO Automatically
Manual TCO analysis takes a dedicated analyst 4 to 6 hours per vehicle per year. Oxmaint calculates it automatically and continuously — for every vehicle simultaneously, updated daily from live data.
Vehicle is added to Oxmaint at purchase with acquisition cost, registration date, OEM specifications, and initial outfitting cost. For existing fleet vehicles, historical maintenance and fuel costs can be imported from telematics providers and fuel card data to back-calculate TCO from the actual ownership start date rather than the Oxmaint go-live date.
Every work order closed in Oxmaint adds labour and parts cost to the vehicle's running maintenance total. Fuel card integration adds fuel spend per transaction. Insurance premiums are entered annually or pulled from finance system integration. Depreciation is calculated using configurable methods — straight-line, reducing balance, or market value integration — updated monthly. Book a demo to see cost accumulation for your fleet's data sources.
Oxmaint divides cumulative lifetime cost by total mileage daily — producing an updated TCO per mile per vehicle. The break-even projection models forward maintenance cost against projected residual value decline, flagging the vehicle when projected 12-month maintenance cost exceeds annual depreciation loss — the financial definition of the replacement break-even point.
When a vehicle crosses break-even, Oxmaint generates a replacement recommendation report — current TCO per mile, projected 12-month additional retention cost, and estimated TCO comparison for the recommended successor model. This is the fleet director's agenda item for the planning meeting — complete financial analysis, not an opening for debate.
We kept Vehicle 22 two years too long because the repair history looked manageable — $800 here, $1,200 there. Oxmaint showed us the full picture: $31,400 in total maintenance on a vehicle worth $8,000. We now have replacement conversations driven by the TCO break-even report, not by whose opinion is loudest in the room.
Frequently Asked Questions
Know the True Cost of Every Vehicle. Replace at the Right Time. Save $3,200 Per Decision.
Automatic TCO per vehicle — acquisition through disposal — live in Oxmaint from your first session. No manual spreadsheet inputs required.