Fleet total cost of ownership is the only financial metric that tells a fleet manager the true cost of keeping a vehicle in service — from acquisition through disposal. Most commercial fleet budgets track fuel, parts, and labor separately, which means decision-makers never see the full picture when evaluating replacement timing, lease vs. buy decisions, or vehicle class selection. Understanding and calculating TCO correctly in 2026 separates fleet programs that manage cost from those that react to it. If your fleet currently lacks a structured TCO model, start a free trial or book a demo to see how Oxmaint feeds maintenance cost data into a live TCO model for your entire fleet portfolio.
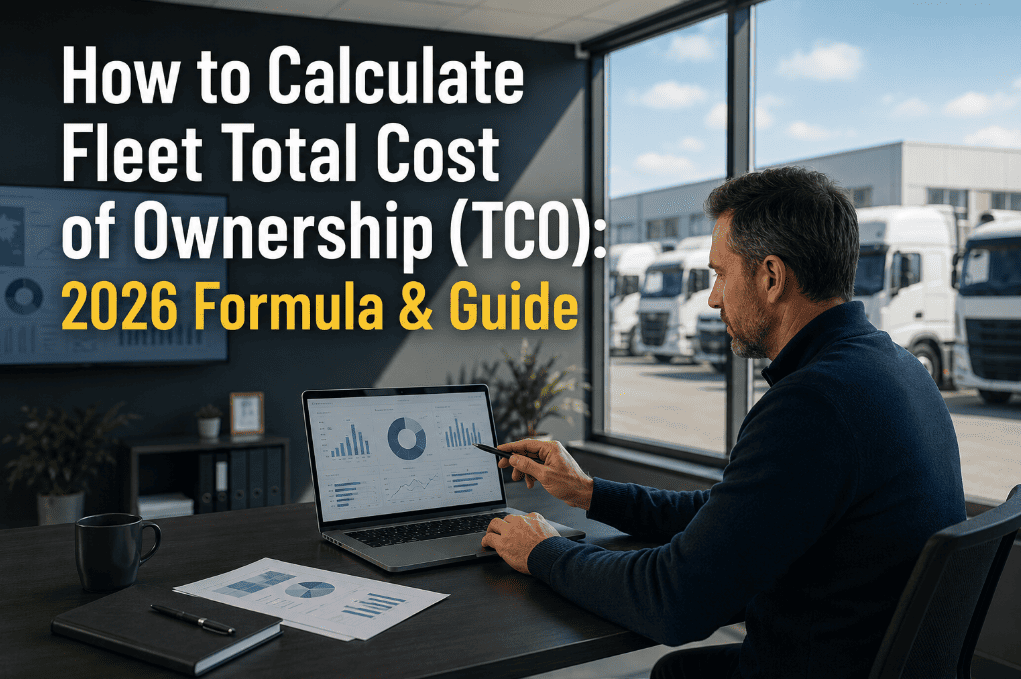
How to Calculate Fleet Total Cost of Ownership (TCO): 2026 Formula and Guide
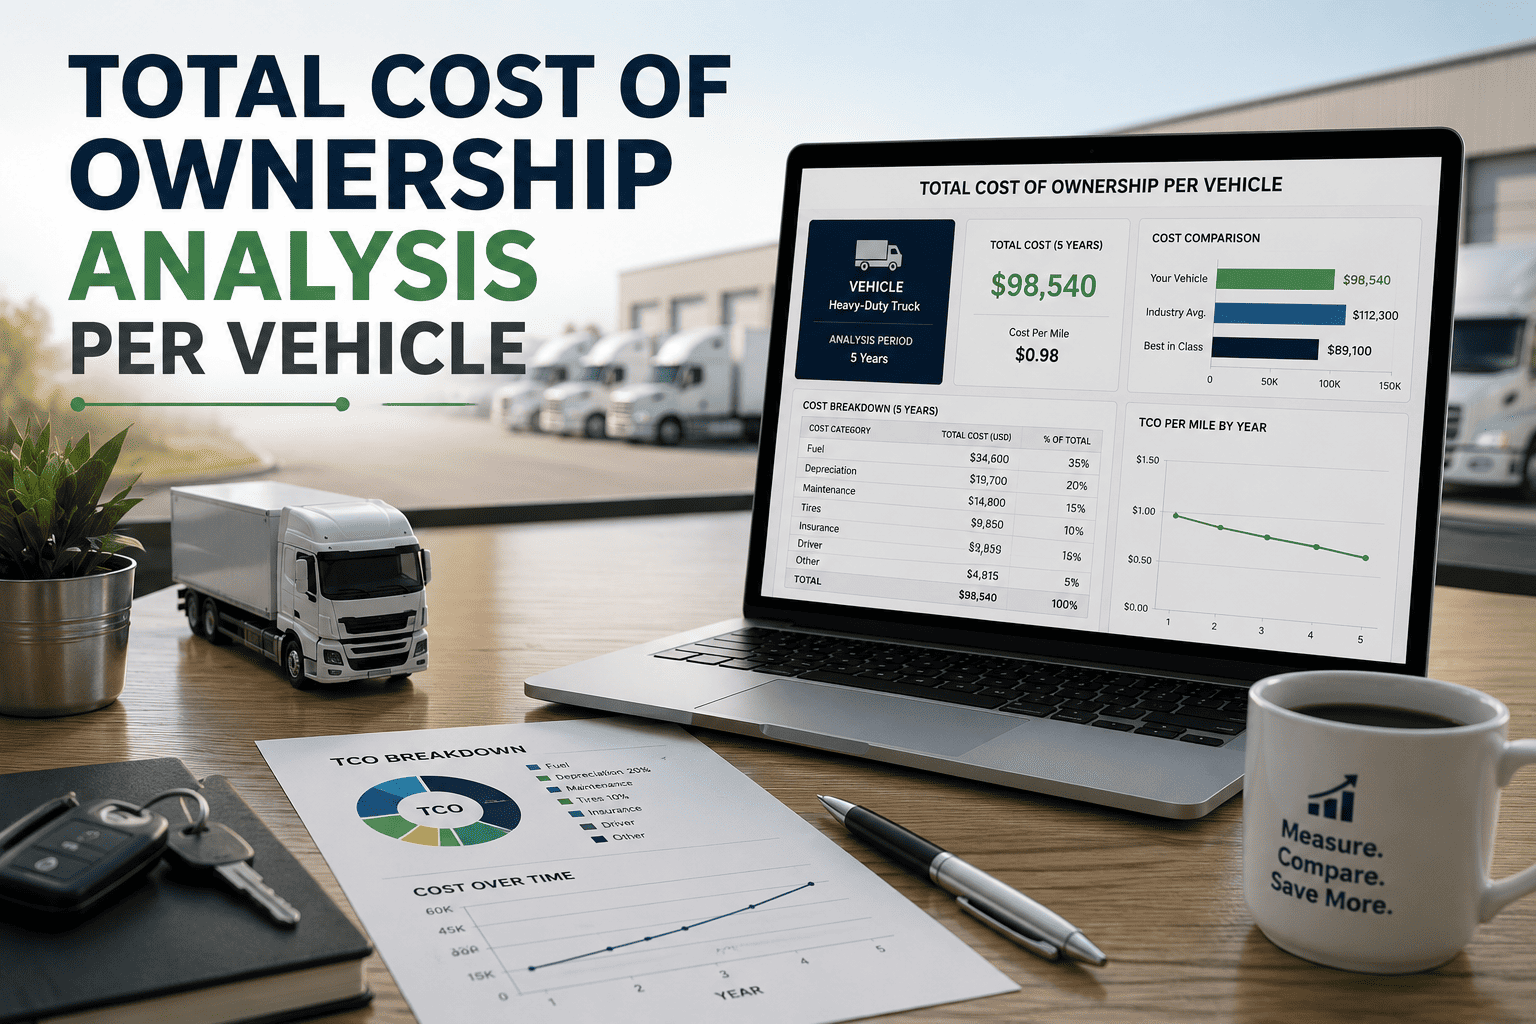
Fleet TCO is the complete financial picture of vehicle ownership — acquisition, fuel, maintenance, insurance, depreciation, and disposal in one number. Without it, replacement decisions, budget models, and vehicle selection are built on incomplete data.
TCO Is Not an Accounting Exercise — It Is a Fleet Strategy Tool
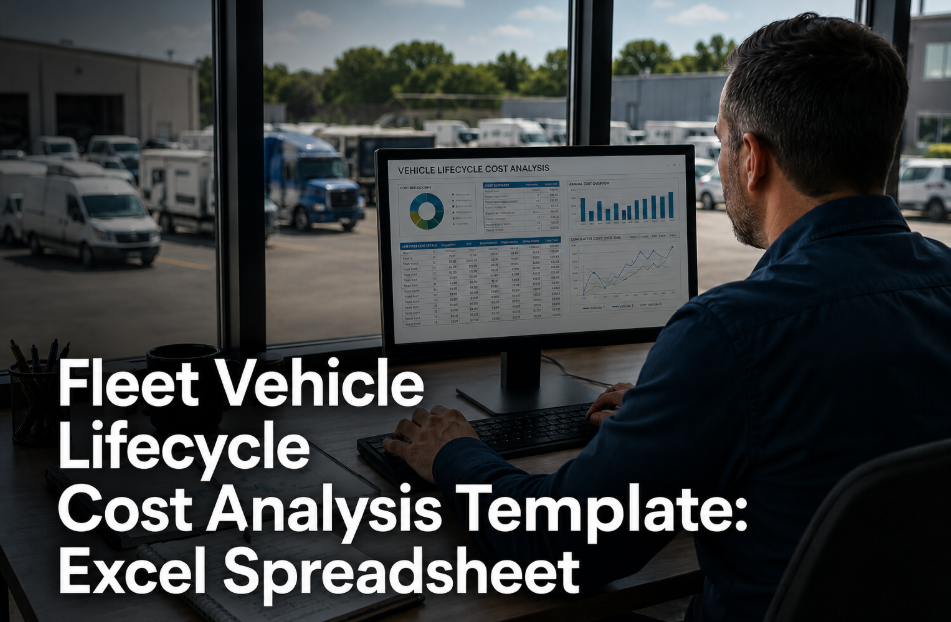
When a fleet manager can show the CFO a cost-per-mile model that includes every cost category across a vehicle's full lifecycle, replacement decisions become faster, budget negotiations become cleaner, and the ROI of preventive maintenance becomes undeniable. Oxmaint captures the maintenance cost data that makes that model accurate. Start a free trial or book a demo to see the fleet cost reporting dashboard in action.
What Is Fleet Total Cost of Ownership and Why Does It Matter?
Fleet TCO is the sum of every cost associated with owning and operating a commercial vehicle from the day it enters the fleet to the day it is disposed of. It converts the fragmented cost picture — fuel bills, shop labor invoices, insurance premiums, and depreciation schedules — into a single per-mile or per-year figure that makes vehicle-to-vehicle and fleet-to-fleet comparisons financially valid. Without TCO, a cheaper vehicle to buy may be significantly more expensive to operate — and that reality rarely shows up in a purchase decision based only on sticker price. Ready to build a live TCO model from your maintenance data? Start a free trial or book a demo.
The 2026 Fleet TCO Formula: 6 Cost Categories You Must Include
A complete fleet TCO model requires six cost categories. Fleets that omit any one of them underestimate their true operating cost and make vehicle decisions that look financially justified on paper but underperform over the asset's full service life.
Vehicle purchase or lease payment, upfitting cost, title, registration, and any fleet discount applied. For purchased vehicles, depreciation is modeled annually. For leased vehicles, the monthly payment reflects this cost directly in operating expense.
Total fuel consumption by vehicle across its service life. Calculated using average MPG or MPGe for electric vehicles, total miles driven per year, and fleet fuel price. Fuel is the most volatile TCO variable and must be modeled with both a base and high-price scenario.
All planned PM labor and parts, unplanned repair labor and parts, tires, and body repair. This is the category where CMMS data is most critical — real maintenance cost by vehicle from Oxmaint work order records replaces benchmark estimates with actual cost history.
Annual insurance premium allocated per vehicle, plus self-insured retention costs for fleets running high deductibles. Claims history, vehicle age, driver safety records, and body condition all affect per-vehicle insurance allocation in the TCO model.
The annual decline in vehicle market value from purchase price to projected disposal value. Depreciation is steepest in years one through three and flattens after year five. High-mileage and high-maintenance vehicles depreciate faster than fleet benchmark curves predict.
Auction fees, dealer trade values, private remarketing costs, and any decommissioning or disposal expense net of salvage value. Documented maintenance history and body condition records consistently improve residual value at disposal by 8% to 14% over vehicles with no records.
2026 Fleet TCO Benchmarks by Vehicle Class
The following benchmarks represent median TCO ranges for US commercial fleets in 2026 based on industry cost data. Actual values vary by region, fuel type, maintenance program quality, and utilization intensity. CMMS-tracked fleets with structured PM programs consistently operate in the lower quartile of these ranges.
| Vehicle Class | Typical Annual Miles | TCO Per Mile (Median) | Annual Maintenance Share | Key TCO Driver |
|---|---|---|---|---|
| Compact cargo van | 28,000–40,000 | $0.68–$0.78 | $3,800–$5,200/yr | Fuel and insurance |
| Full-size cargo van | 30,000–45,000 | $0.76–$0.90 | $4,500–$6,800/yr | Maintenance and fuel |
| 1-ton service truck | 28,000–42,000 | $0.84–$1.02 | $5,200–$7,400/yr | Acquisition and depreciation |
| Medium-duty straight truck | 35,000–60,000 | $0.96–$1.18 | $7,800–$12,000/yr | Maintenance and fuel |
| Class 8 semi-truck | 90,000–130,000 | $1.62–$2.20 | $18,000–$28,000/yr | Fuel and driver cost |
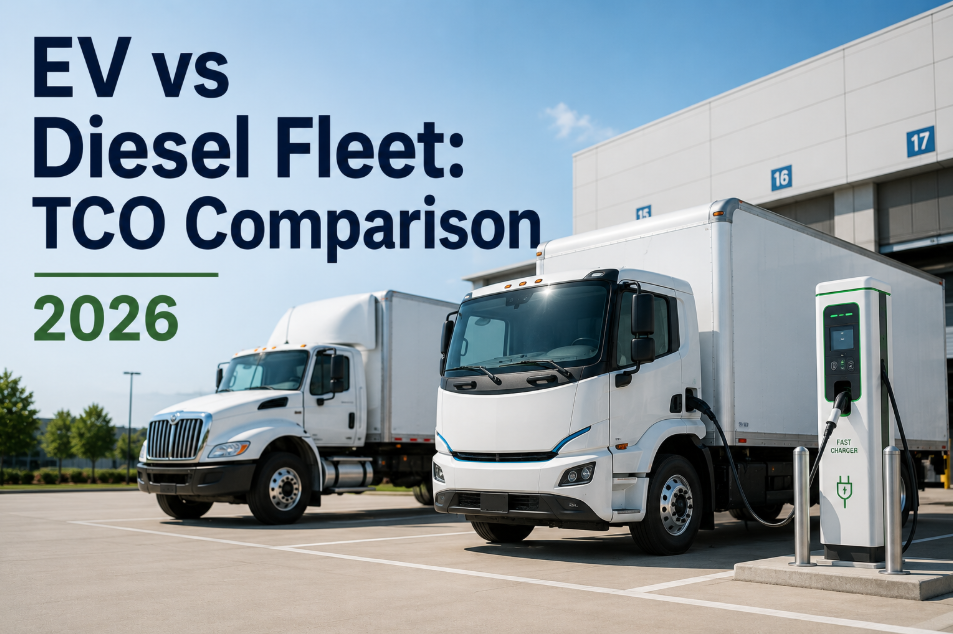
| Electric delivery van | 28,000–38,000 | $0.58–$0.74 | $2,400–$3,800/yr | Acquisition and charging infrastructure |
How Oxmaint Feeds Real Maintenance Cost Data into Your TCO Model
The most common weakness in fleet TCO models is the maintenance cost input — it is estimated from industry benchmarks rather than pulled from actual vehicle repair records. Oxmaint provides per-vehicle maintenance cost history, PM compliance rates, and repair cost trends that make the maintenance component of your TCO model accurate rather than approximated. Teams building a live TCO program can start a free trial or book a demo to see the cost reporting module in detail.
Every work order in Oxmaint captures labor time, parts cost, and vendor invoice — all linked to the specific vehicle. The result is a per-vehicle maintenance cost record that feeds TCO models with actual history instead of class-average estimates.
Oxmaint separates PM cost from reactive repair cost per vehicle — the metric that reveals whether a vehicle's maintenance program is working or whether reactive spend is inflating the TCO beyond the vehicle's economic justification threshold.
As vehicles age, Oxmaint tracks cumulative repair cost against acquisition value — generating the year-by-year cost curve that defines the economic end of life and supports the replacement timing recommendation with actual financial data.
Oxmaint's CapEx model combines condition scoring, maintenance cost trends, and mileage accumulation to project when each vehicle will require replacement — giving finance and operations teams a multi-year budget forecast instead of an annual surprise.
Portfolio-level reporting shows maintenance cost per mile, cost by vehicle class, cost by location, and year-over-year trend — the inputs required for fleet cost presentations to CFOs, board finance committees, and insurance underwriters.
Complete Oxmaint maintenance histories — PM compliance, repair records, inspection logs, parts used — are exportable for inclusion in vehicle disposal documentation, supporting the 8 to 14% resale premium that documented maintenance history produces at auction or dealer trade.
TCO Without Data vs. TCO With Oxmaint Maintenance Records
What Fleets With Accurate TCO Models Achieve
Fleets managing against actual TCO replace vehicles at the right time — not too early and not past the economic EOL point that inflates repair cost
Documented CMMS maintenance histories produce measurable premiums at disposal vs. vehicles with no service record provided to buyers
Fleets tracking only fuel and basic maintenance miss an average of 34% of their true per-vehicle operating cost when insurance, depreciation, and downtime are excluded
Oxmaint's rolling replacement model gives finance teams a 5 to 10 year fleet capital expenditure projection built on real condition and cost data
Frequently Asked Questions
What is the most commonly missed cost in fleet TCO calculations?+
At what point in a vehicle's life does TCO typically peak?+
How does preventive maintenance affect fleet TCO in measurable terms?+
How should electric vehicles be modeled in a fleet TCO framework?+
Build a Fleet TCO Model That Uses Real Data, Not Industry Guesses
Oxmaint gives every vehicle in your fleet a complete maintenance cost record — from first work order to final disposal documentation — that turns your TCO model from a benchmark estimate into a real-number financial tool. Start with your maintenance data and build from there.