Diesel prices in 2026 have refused to sit still. A forecast that pointed toward roughly $3.50 a gallon for the year was overtaken within weeks by a supply shock that pushed on-highway diesel past $5.00 across large parts of the country, and the swings have kept coming ever since. For a fleet where fuel already eats 20% to 40% of total operating costs, that kind of unpredictability turns a spreadsheet forecast into a guessing game every single month. Static, once-a-year fuel budgets built on a single assumed price per gallon are the first thing volatility breaks. What actually holds up is a forecasting approach built on real consumption history pulled straight from your fleet's maintenance and utilization records, not a number copied from last year's plan. Start a free trial to see how CMMS-tracked fuel and maintenance data turns volatile diesel prices into a manageable budget line.
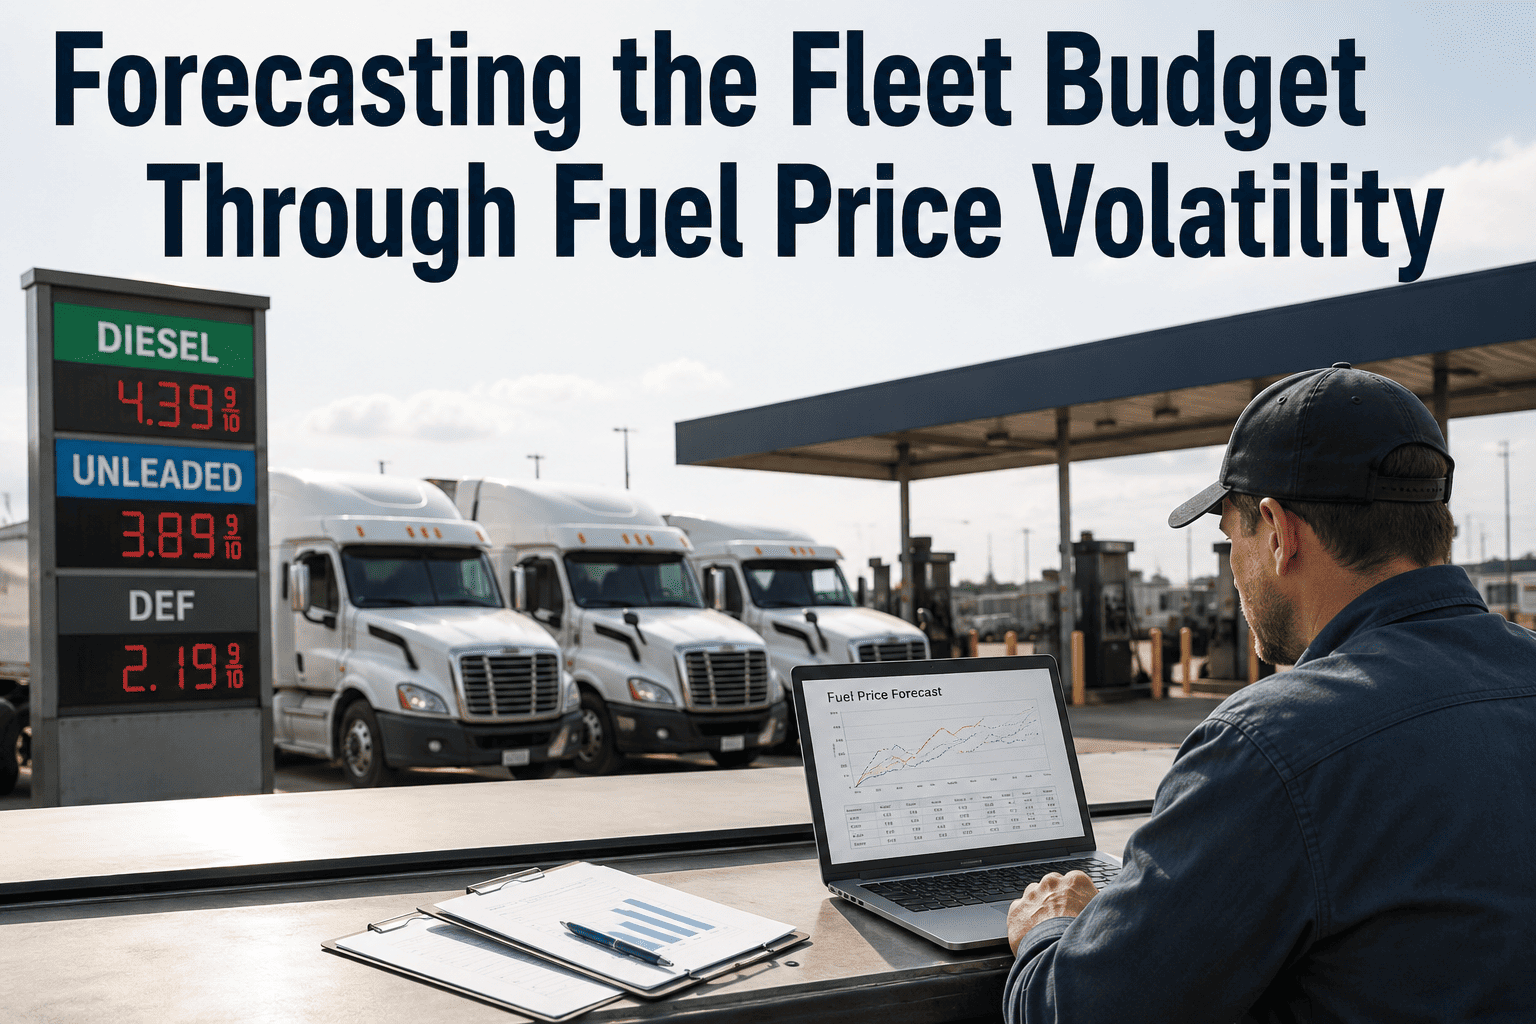
Forecasting the Fleet Budget Through Fuel Price Volatility
Diesel has swung more than a dollar a gallon in a single quarter this year. Fleets still running on a fixed annual fuel assumption are budgeting for a market that no longer exists.
Stop Budgeting Against a Single Number That Will Be Wrong By Next Month
Most fuel budgets are built once a year around one assumed price per gallon. In a market where diesel has moved by more than a dollar in a single quarter, that assumption is stale before the ink dries. Oxmaint ties fuel consumption to the same vehicle records that already track your PM schedules, so the numbers behind your forecast update as your fleet actually runs.
A Year That Broke Every Static Fuel Forecast
Diesel entered 2026 on a downward forecast and left the first quarter in a completely different reality. A supply disruption in a major shipping corridor sent prices climbing faster than at any point in recent memory, and the seasonal demand that follows in Q2 and Q3 has kept the market from settling back down. Fleets that planned around one number for the year found themselves rebuilding the budget by March.
What a Single Price Swing Does to a Mid-Size Fleet
Using a common industry benchmark of 100,000 miles per truck per year at 6.5 miles per gallon, a 50-truck fleet burns roughly 770,000 gallons annually. Here is what a per-gallon price move does to that fleet's annual fuel line — the kind of exposure a fixed annual assumption never shows a budget owner in advance.
Run this same math against your fleet's actual gallons burned, not the benchmark, and the number gets personal fast. That is the calculation a budget owner needs before the swing happens, not after.
6 Fuel Forecasting Mistakes That Blow Up the Annual Budget
None of these mistakes are exotic. They are the default way most fleets have always built a fuel budget — and they are exactly what a volatile market punishes hardest.
Locking the annual budget to a single per-gallon figure set in January ignores that diesel can move a dollar or more by mid-year, leaving finance chasing a number that stopped being true in Q1.
Worn injectors, clogged filters, and underinflated tires quietly raise consumption per mile. Without a maintenance-linked view, that drag hides inside the fuel line and looks like market volatility.
Surcharge structures tied to old baseline prices or slow monthly resets fail to keep pace when the underlying index moves weekly, leaving real cost increases unrecovered from customers.
Fleet-wide averages hide the handful of vehicles burning well above expected rates. Those outliers are usually the first place real savings exist, but only if they are visible individually.
Idling burns roughly a gallon an hour per truck with nothing to show for it. Across a fleet, untracked idle time can quietly account for a meaningful share of the annual fuel budget.
Reviewing the fuel budget once a year in a market that moves weekly guarantees the plan is wrong for most of the year it is supposed to govern.
How Oxmaint Turns Fuel Volatility Into a Manageable Line Item
Oxmaint connects fuel consumption to the same vehicle and maintenance records already tracking PM schedules, inspections, and repairs — so the fuel forecast is built on your fleet's actual operating data instead of a number copied from last year. Start a free trial to see the fuel dashboard on your own fleet data.
Every gallon logged against a vehicle builds a rolling consumption history, making it possible to spot the trucks drifting above expected efficiency before they distort the whole budget.
Model the fuel line at three price assumptions instead of one, so finance walks into planning season with a defensible range instead of a single fragile guess.
Filter changes, injector service, and tire pressure checks schedule automatically, closing the gap between deferred maintenance and rising fuel consumption per mile.
Idle time surfaces on the same record as fuel spend, giving fleet managers a clear target for reduction instead of a vague sense that something is off.
When real fuel spend drifts away from the budgeted range, an alert fires before the gap becomes a quarter-end surprise for finance.
Cost per mile, cost per vehicle, and forecast-versus-actual sit on one dashboard, replacing spreadsheet reconciliation with a live operational picture.
Static Fuel Budgeting vs. CMMS-Tracked Forecasting
What Fleet Managers Gain From a Data-Driven Fuel Forecast
Best, mid, and worst-case fuel assumptions replace a single fragile number in every planning cycle
Fuel spend updates with every fill and every trip instead of waiting for a monthly reconciliation
Alerts surface budget drift the week it starts, giving finance time to react instead of explain
Fuel, maintenance, and idle data sit on the same vehicle record instead of three disconnected reports
Frequently Asked Questions
How often should a fleet update its fuel budget in a volatile market?+
What price range should fleets plan around for the rest of 2026?+
Can Oxmaint help with fuel surcharge recovery from customers?+
Does fuel data connect to maintenance records in Oxmaint?+
How does scenario modeling actually help during budget season?+
Your Next Fuel Budget Should Survive Contact With the Market
Diesel volatility is not going away in 2026. The fleets protecting their margins are the ones building forecasts from real consumption and maintenance data instead of a single number set once a year. Oxmaint gives you that data in one place, ready before your next budget cycle.