Every fleet manager asks the same question eventually: is it time to move off diesel? The honest answer depends less on fuel price per gallon and more on duty cycle, mileage, infrastructure access, and maintenance history — factors most comparisons skip entirely. Diesel remains the default because it is familiar, not because it is cheapest per mile for every fleet. Compressed natural gas, propane autogas, and electric each win in specific mileage and infrastructure scenarios, and lose badly in others. Getting this decision wrong means years of locked-in costs, so before signing a fuel contract or ordering new vehicles, start a free trial or book a demo to model your fleet's real numbers.
Diesel vs Alternative Fuel: A True Cost Comparison for Fleets
Price per gallon is the least important number in this decision. Duty cycle, infrastructure cost, and maintenance history decide which fuel actually lowers your total cost of ownership.
Fuel Price Is a Number. Total Cost of Ownership Is a Decision.
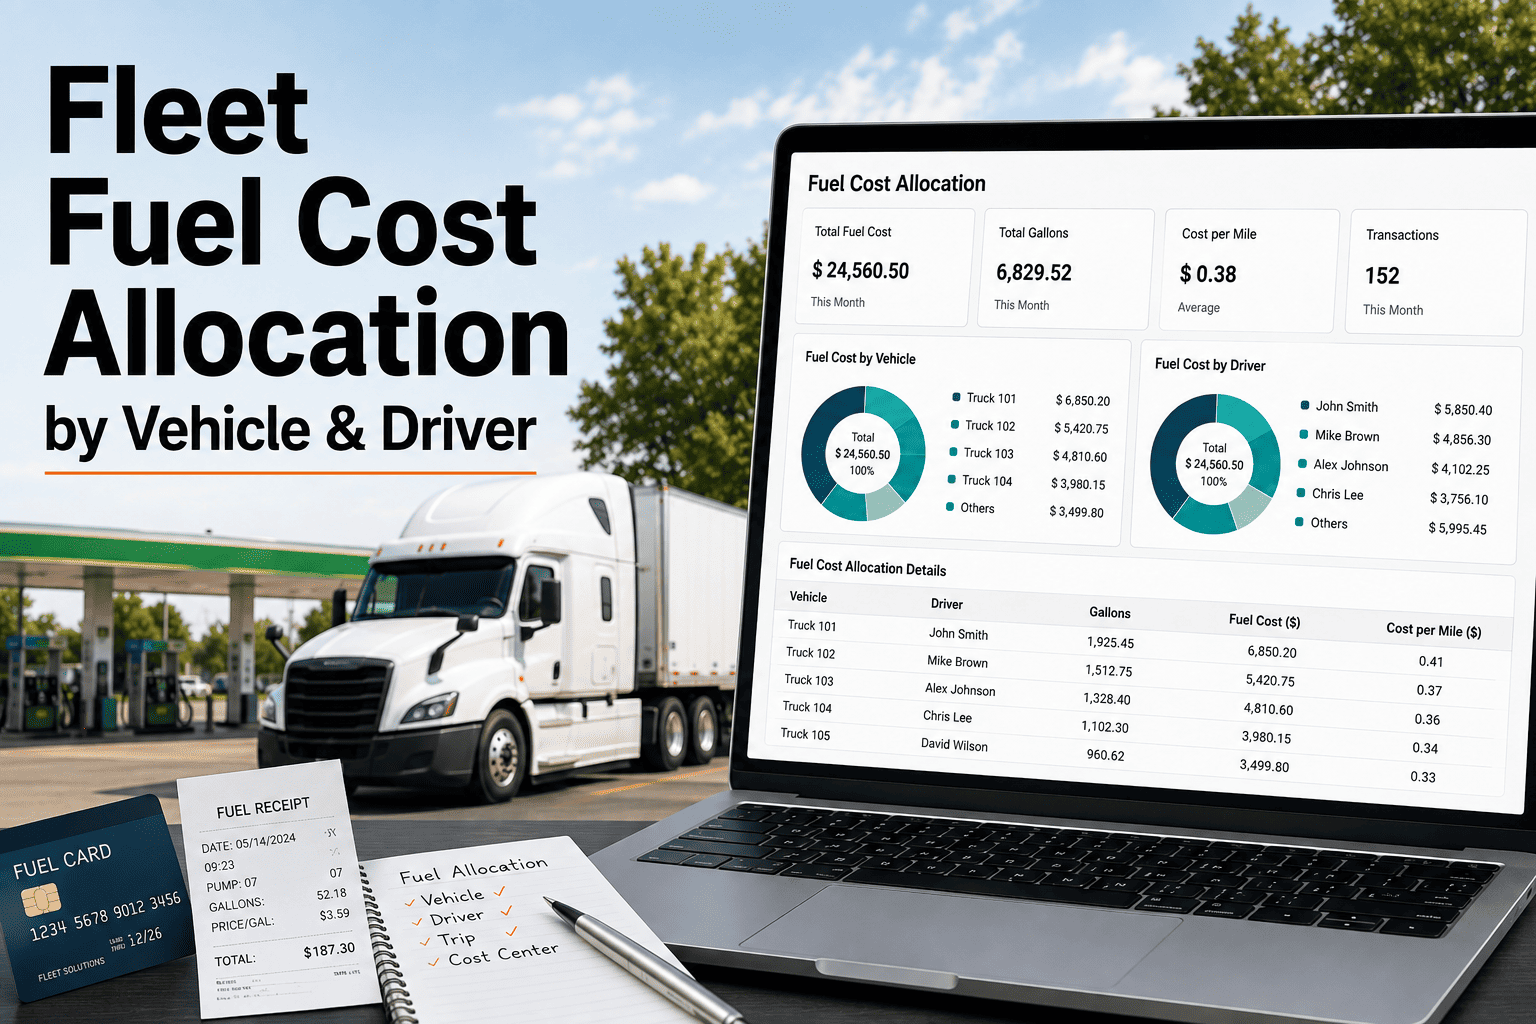
Diesel's higher per-gallon price gets all the attention, but the fuel line item is only one part of the equation. Alternative-fuel vehicles usually cost more upfront, need dedicated infrastructure, and carry different maintenance intervals — costs that erase savings if a fleet's mileage or routes don't fit. Oxmaint tracks fuel spend, maintenance cost, and uptime by vehicle and fuel type in one place, so the comparison is based on your fleet's data instead of a manufacturer's brochure.
How Diesel, CNG, Propane, and Electric Actually Compare
Each fuel type wins under different conditions. Here is what fleet managers report for 2026 pricing, infrastructure demands, and the mileage profile each option suits best.
Fuel Cost Comparison Table
National averages vary by region and contract, but this snapshot shows why the "cheapest fuel" question always needs a second question: cheapest for what mileage and route.
| Fuel Type | 2026 Avg Price | Infrastructure Cost | Break-Even Point |
|---|---|---|---|
| Diesel | $3.80 – $4.20 / gal | None — existing network | Baseline comparison |
| CNG / RNG | $2.99 / DGE | Moderate to high station cost | 3 to 8 years |
| Propane Autogas | $1.32 – $2.91 / GGE | Lowest of all alt fuels | Under 2 years, typical |
| Electric | $0.30 – $0.35 / mile | Highest — chargers and grid work | 4 to 12 years by mileage |
6 Ways Fleets Get the Fuel Decision Wrong
These mistakes show up months after the vehicles are ordered, when the invoices stop matching the projections. To see how tracked data prevents each one, start a free trial or book a demo.
A cheaper fuel on paper can cost more per mile once fuel economy differences are factored in, especially for CNG and early-generation electric trucks.
On-site CNG or charging infrastructure can cost more than the vehicles themselves, and that investment only pays back at high annual mileage.
A fleet with mixed short and long routes needs per-vehicle mileage data to know which trucks fit an alternative fuel and which stay on diesel.
Diesel aftertreatment systems add real annual cost that alternative fuels avoid, but that saving only shows up if maintenance is tracked by fuel type.
Federal and state incentives for alternative-fuel vehicles change frequently, and fleets that don't track deadlines lose thousands per vehicle.
Without a shared system tracking fuel spend per vehicle, fleets rely on estimates instead of the real numbers needed to justify a fuel switch.
How Oxmaint Tracks Fuel Cost and Maintenance by Vehicle
Oxmaint logs fuel spend, maintenance cost, and downtime against each vehicle's fuel type, so a diesel-to-alternative comparison is built from your fleet's own history rather than industry averages. Teams evaluating a fuel switch can start a free trial or book a demo to see it against real fleet data.
Every fill-up or charge session records against the vehicle's asset record, building a true per-mile fuel cost history instead of a fleet-wide estimate.
Aftertreatment repairs, CNG tank inspections, and EV battery service log separately, showing which fuel type actually costs less to keep running.
DPF cleaning, CNG cylinder recertification, and propane fuel system checks each run on their own manufacturer-specified interval automatically.
Vehicles running consistent high-mileage routes surface as strong alternative-fuel candidates, while mixed-route vehicles stay flagged for diesel.
Total fuel spend, cost per mile by fuel type, and maintenance trends appear together, replacing scattered spreadsheets with one live dashboard.
State and federal alternative-fuel incentive windows attach to the relevant vehicle records so deadlines are never missed during a fleet transition.
Guessing at Fuel Costs vs Tracking Them by Vehicle
Diesel vs Alternative Fuel Questions Fleet Managers Ask
Is CNG actually cheaper than diesel for a fleet?
Why is propane autogas gaining ground in fleets?
When does electric actually make financial sense?
How does Oxmaint help compare fuel types across a fleet?
Should a fleet switch entirely, or run a mixed fuel strategy?
Stop Guessing. Start Tracking Your Real Fuel Costs.
The right fuel mix depends on your routes, your mileage, and your maintenance history — not a national average. Oxmaint gives fleet managers the per-vehicle data needed to make that call with confidence, with tracking live in week one.