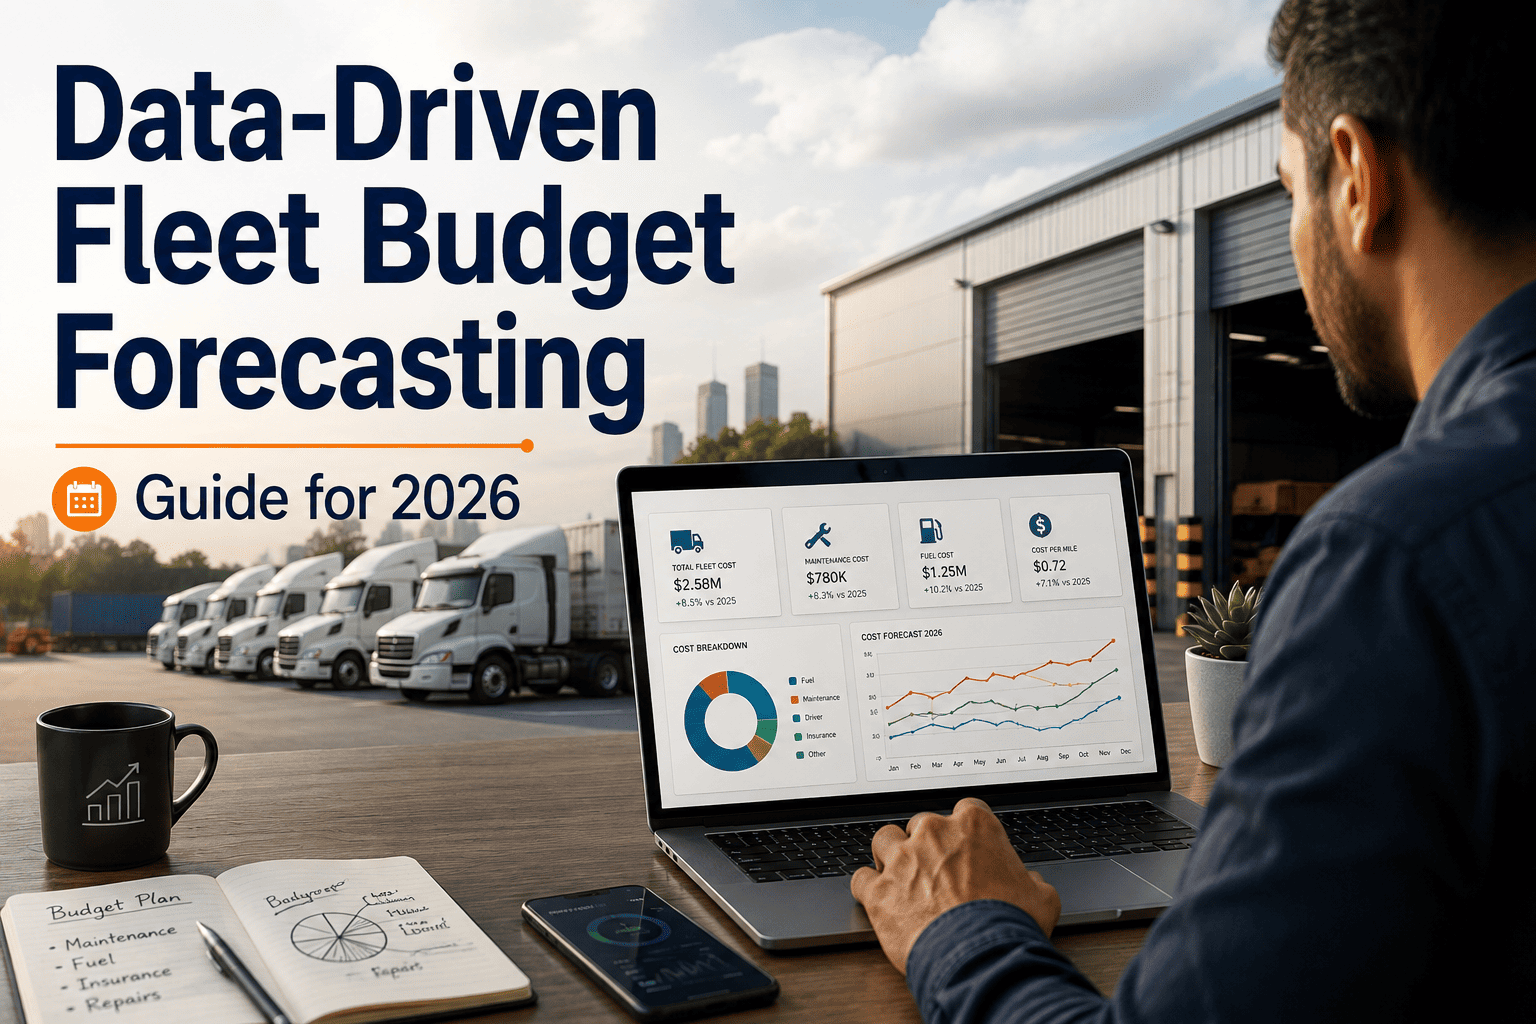
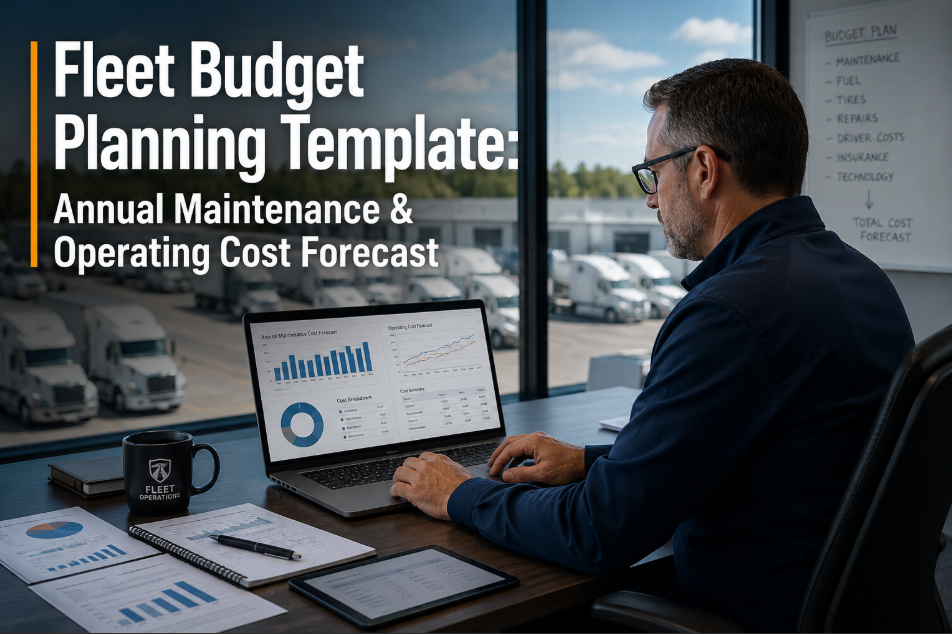
Most fleet budgets for 2026 start the same way: take last year's maintenance and repair spend, add an inflation buffer, and submit it before the deadline. That worked when costs were flat and fleet size barely changed, but it falls apart the moment finance asks why actual spend drifted from the approved number. Parts prices keep climbing, technician shortages stretch every repair timeline, and insurance renewals can swing anywhere from 7% to 15% a year regardless of your claims record. Fleets that build their forecast from real vehicle-level data — age, utilization, condition, and repair history — walk into budget season with a number they can defend line by line instead of a guess wearing a spreadsheet. OxMaint's maintenance management platform turns that vehicle-level data into a fleet budget finance actually signs off on.
Stop Budgeting On Last Year's Number Plus A Guess
Build a 2026 fleet budget from real cost-per-mile, asset age, and utilization data instead of a flat percentage increase applied to last year's total spend
41%
Rise in vehicle maintenance and repair costs between 2020 and 2025, with the climb continuing into 2026 as parts and labor costs keep moving upward
8-12%
Better budget accuracy for fleets that forecast from actual vehicle data instead of a flat percentage increase applied to last year's total
80%
Share of total fleet cost that is variable and usage-driven, which is exactly the portion a static, once-a-year budget cannot capture accurately
Why Fleet Budgets Miss The Mark By The Second Quarter
A budget built on a spreadsheet formula treats every vehicle the same age, in the same condition, running the same routes. Real fleets do not work that way. A five-year-old delivery van on stop-and-go city routes wears out brakes and tires at a completely different rate than a two-year-old highway tractor, yet both often get budgeted using the same blanket percentage increase. The gap between that assumption and reality is where mid-year budget overruns come from, and it is also where fleet managers lose credibility with finance the next time they ask for a number. The problem rarely shows up in January, when the approved budget still looks reasonable on paper. It shows up in April or May, when the first wave of unplanned repairs lands and there is no line item flexible enough to absorb it without pulling from somewhere else.
Age Gets Averaged Away
Newer trucks can run maintenance costs as low as $0.08 to $0.12 per mile, while assets past seven years old often climb above $0.22 per mile. Averaging the whole fleet into one number hides which vehicles are about to become expensive, so the budget looks fine right up until three or four aging assets all need major work in the same quarter.
Reactive Repairs Aren't Planned, They're Absorbed
Unplanned repairs and the downtime that comes with them can push effective costs up by as much as 30%, and none of that shows up in a forecast that only looks at scheduled service intervals. Every reactive repair also carries a hidden downtime cost that rarely gets its own line item at all.
Parts And Labor Inflation Move Independently
Component and tariff-driven cost increases do not move at the same rate as your revenue or your fuel line, so a single blended inflation percentage almost always misses one side of the equation. Steel and aluminum-linked parts pricing in particular has moved faster than labor rates through 2025 and 2026, which quietly erodes budgets that assumed both would rise together.
Insurance Is Priced On More Than Your Own Record
Even fleets with a clean claims history can see 7% to 15% premium increases at renewal because insurers price on industry-wide claim severity and legal trends, not just your own numbers. A forecast that assumes a flat renewal cost is usually the first line to blow the budget every single year.
5 Data Inputs That Turn A Guess Into A Forecast
A forecast is only as strong as the data feeding it. These are the five inputs that separate a defensible fleet budget from a percentage bump on last year's total, and they are exactly what a connected maintenance platform tracks automatically instead of asking someone to rebuild a spreadsheet every quarter. None of these inputs are exotic or hard to collect. Most fleets already generate this data every day through work orders, fuel logs, and inspection reports. The difference is whether that data sits scattered across paper tickets and disconnected systems, or flows into one place where it can actually shape next year's number.
Fleet Budget Forecasting — OxMaint
Turn Vehicle-Level Data Into A Budget Finance Approves
OxMaint tracks cost per mile, asset age, utilization, and work order history for every vehicle automatically, so your 2026 forecast is built on real numbers instead of a percentage guess. See it running against your own fleet before you commit to anything.
5 Budgeting Mistakes That Quietly Blow Up Fleet Forecasts
Most budget overruns are not caused by one dramatic failure. They come from a handful of small, repeated assumptions that seemed reasonable at the time and compounded across an entire fleet over the course of a full budget cycle. Watching for these five patterns is often the fastest way to improve forecast accuracy without changing your entire budgeting process from the ground up, and most fleets recognize at least two or three of them the moment they read the list.
Treating The Fleet As One Asset
Blending every vehicle into a single average cost per mile hides the two or three assets that are about to become expensive and lets their cost surprise the budget instead of being planned for in advance.
Ignoring The Technician Shortage
Diesel technician availability is running roughly 52% short of industry demand, which stretches repair timelines and raises labor rates. A forecast that assumes 2023 turnaround times will consistently understate both cost and downtime.
Skipping A Replacement Trigger
Without a defined cost-per-mile threshold for replacement, aging vehicles stay in service well past the point where repair cost outweighs their remaining value, quietly draining the maintenance budget every month they stay on the road instead of being cycled out on schedule.
Setting The Budget Once A Year
An annual budget locked in January cannot react to a fuel price spike, a tariff-driven parts increase, or an insurance renewal shock that lands in July. A rolling forecast catches these shifts while there is still time to act.
Leaving Downtime Out Of The Number
Reactive repairs don't just cost parts and labor, they take a vehicle out of service and often require a substitute vehicle or rescheduled route. Fleets that price downtime into their forecast get a far more honest picture of what reactive maintenance actually costs the business.
From Vehicle Data To Budget Line: The Forecasting Workflow
Building an accurate forecast is a repeatable process, not a once-a-year scramble. This is the workflow that connects everyday maintenance data to the number that eventually lands in front of your finance team, and it is designed to update itself as new work orders come in rather than going stale the day after it's submitted. Each stage below builds directly on the one before it, so a gap early in the process, like inconsistent work order logging, shows up as inaccurate cost per mile several steps downstream.
Step 1
Work Orders Log Real Costs
Every repair, part, and labor hour is logged against the specific vehicle the moment the job closes, building a clean historical record without manual data entry or end-of-month spreadsheet reconciliation.
Step 2
Cost Per Mile Calculates Automatically
Total maintenance spend divides against actual mileage for each vehicle, updating continuously instead of once a quarter when someone finally finds time to run the report manually.
Step 3
Age And Trend Curves Get Applied
Each vehicle's cost trend is mapped against its age curve, flagging assets approaching the point where costs are projected to climb sharply in the next 12 months so replacement planning can start early.
Step 4
A Rolling Forecast Replaces The Static Budget
Instead of one annual number, the forecast updates on a rolling 30 to 90 day basis, so assumptions stay current with actual parts and labor trends rather than a guess made the previous winter.
Step 5
Finance Gets A Line-Item Defense
Every number in the submitted budget traces back to a vehicle, a trend, and a work order history, replacing "trust me" with a report finance can open and verify themselves.
2026 Cost-Per-Mile Benchmarks By Vehicle Age
These benchmarks reflect current 2026 industry data on maintenance cost per mile by vehicle age and class, pulled from national fleet cost studies covering both light and heavy duty operations. Use them as a sanity check against your own fleet data, not a replacement for it, since duty cycle, climate, and region shift these numbers meaningfully from one operation to the next.
Vehicle Age / Class
Cost Per Mile
Share Of Operating Cost
Forecasting Priority
0-3 Years, Any Class
$0.08 - $0.12
Low
Monitor only
4-6 Years, Light-Medium Duty
$0.13 - $0.18
Moderate
Quarterly review
Class 8 Fleet Average
$0.202
Approx. 9%
Monthly review
7+ Years, Any Class
$0.22 and rising
High
Replacement analysis
Fleet-Wide Average, 2026
Approx. 8.9% of opex
Benchmark
Annual baseline
Notice how wide the range is between a fleet's newest and oldest vehicles. A budget built on the fleet-wide average alone sits somewhere in the middle of that range for every vehicle, which means it overstates cost for younger assets and badly understates it for anything past the seven year mark. Segmenting the forecast by age band, even using a rough three-tier split like new, mid-life, and aging, closes most of that gap without requiring a complex model.
How To Present A Forecast Finance Will Actually Approve
A more accurate forecast still needs to be communicated well, or it gets treated the same as any other budget request stapled to a spreadsheet. These four habits consistently separate forecasts that get approved without pushback from ones that trigger a second round of questions and a longer approval cycle.
What Forecast Accuracy Is Actually Worth
Better forecasting is not just a planning exercise, it changes real numbers on the balance sheet. Here is what fleets typically see once cost tracking moves from spreadsheets and manual reports to a connected, data-driven forecast that updates itself as new maintenance data comes in.
Budget Accuracy
Forecast improvement
8-12%
Mid-year overrun risk
Reduced
Time to first forecast
Same week
Parts And Inventory
Emergency order reduction
40-60%
Target parts turns
2.5-3x / year
Bulk order planning
Enabled
Downtime And Cost Control
Downtime from reactive repair
Up to 30%
Cost per vehicle reduction
25-35%
Report generation time
Minutes, not days
These numbers compound across a budget cycle. A fleet that reduces emergency parts orders, cuts reactive downtime, and improves forecast accuracy in the same year is not just saving money on three separate line items, it is also removing the volatility that made last year's budget so hard to defend in the first place. That combination, more than any single metric, is what convinces finance to stop treating the fleet maintenance line as a rounding error and start treating it as a number they can plan around.
We used to submit a budget every January and spend the rest of the year explaining why it was wrong. Once we started forecasting off actual cost per mile and vehicle age instead of a flat increase, our finance team stopped pushing back on the number because they could see exactly where it came from.
— Fleet Operations Manager, 140-vehicle regional delivery fleet, OxMaint customer
Frequently Asked Questions
How is data-driven fleet budgeting different from a normal maintenance budget?
A normal budget applies one inflation percentage to last year's total across the whole fleet. A data-driven forecast is built vehicle by vehicle from actual cost per mile, age, and repair history using a
connected maintenance platform, so the number reflects real conditions instead of an average guess applied evenly to every asset.
How often should a fleet budget forecast be updated?
Most accurate fleets treat the budget as a rolling forecast updated every 30 to 90 days rather than a fixed annual number. That cadence is frequent enough to catch parts inflation and unexpected repair trends before they become a year-end surprise, but not so frequent that it creates unnecessary reporting overhead.
What data does OxMaint use to build a fleet budget forecast?
OxMaint pulls cost per mile, asset age, utilization, work order history, and parts and labor trends automatically from every closed work order.
Book a demo to see it run against your own fleet data.
Can small fleets benefit from data-driven forecasting, or is it only for large operations?
Fleets of any size carry the same age, utilization, and repair-history variables, so the same forecasting logic applies whether you run 8 vehicles or 800. Smaller fleets often see the accuracy gain faster since fewer vehicles means less data noise to work through before the pattern becomes clear.
How much more accurate is a data-driven forecast compared to a spreadsheet estimate?
Fleets using vehicle-level data for budgeting typically see 8 to 12 percent better forecast accuracy and catch cost pressure during the planning stage instead of discovering it as a mid-year overrun that has to be explained after the fact.
None of this requires ripping out your existing process. Most fleets start by connecting the maintenance data they are already generating through daily work orders, letting cost per mile and age trends surface on their own, and then rebuilding the next budget cycle around what that data actually shows instead of what last year's spreadsheet assumed.
Fleet Budget Forecasting — OxMaint
Build A 2026 Budget You Can Defend, Not Just Submit
30-90
day rolling updates