Every connected vehicle in a modern fleet throws off alerts constantly — check engine codes, low DEF warnings, brake wear thresholds, tire pressure drops, coolant temperature spikes, and dozens of other fault codes streaming in from telematics and OBD feeds. A 60-unit fleet can easily generate several hundred individual alerts in a single week, and the overwhelming majority of them never reach a fleet manager's desk in a form anyone can actually act on. Reading every alert line by line is not a reporting strategy, it is a guarantee that the pattern behind three engines failing in the same week gets missed entirely until the fourth one strands a driver on the highway. What executives actually need is not the raw feed but the roll-up: one weekly report that turns hundreds of scattered alerts into a handful of trends a director can approve action on in five minutes. OxMaint compiles that weekly alert roll-up automatically so the signal survives the noise.
Turn Hundreds of Weekly Alerts Into One Executive Report
OxMaint's weekly alert roll-up groups every fault code by vehicle, system, and trend direction — so leadership sees what changed, not just what fired. Free to start, no card required.
Why Raw Alert Feeds Fail Executives
A raw alert feed treats every fault code as equally important, and that is precisely why it fails at the leadership level. A low washer fluid warning and a rising exhaust back-pressure trend both show up as a single line item, with no indication that one is trivial and the other is an early signal of a turbocharger heading toward failure. Fleet managers who inherit this feed end up either ignoring it entirely because the volume is unmanageable, or spending hours each week manually sorting alerts by severity — time that should be going toward scheduling repairs, not reading logs. Executives one level up get even less: a forwarded spreadsheet, or worse, nothing at all, because nobody has time to summarize three hundred rows into something a VP of Operations can act on before the next budget meeting.
The fix is not fewer alerts. Vehicles will keep generating fault codes regardless of how the report looks. The fix is a reporting layer that groups, weights, and trends those alerts automatically, so the weekly output is a small number of decisions rather than a long list of events.
How Severity Weighting Actually Works
Severity weighting is the step that separates a useful roll-up from a longer version of the same unsorted list. Instead of counting every alert as one unit, each fault code is scored against how close it sits to a safety event, a derate, or a roadside breakdown. A DEF quality fault that is still days away from triggering a speed limitation scores differently than the same fault detected after the derate has already fired, even though both technically started as the same alert type. This scoring is what allows the report to rank Critical Escalations above Trend Movers without a human deciding case by case every single week.
The weighting also needs to account for vehicle criticality, not just fault severity. A refrigerated trailer tractor throwing a coolant warning during a produce run carries different operational risk than the same warning on a yard spotter that never leaves the depot. A roll-up that ignores this context treats a minor issue on a critical route the same as a major issue on a parked vehicle, which quietly erodes trust in the report the first time leadership notices the mismatch.
Once severity and vehicle context are combined into a single score, sorting the weekly report becomes mechanical rather than subjective, and the same two people reviewing the same data will reach the same prioritization every time.
Give Leadership One Report They Will Actually Read
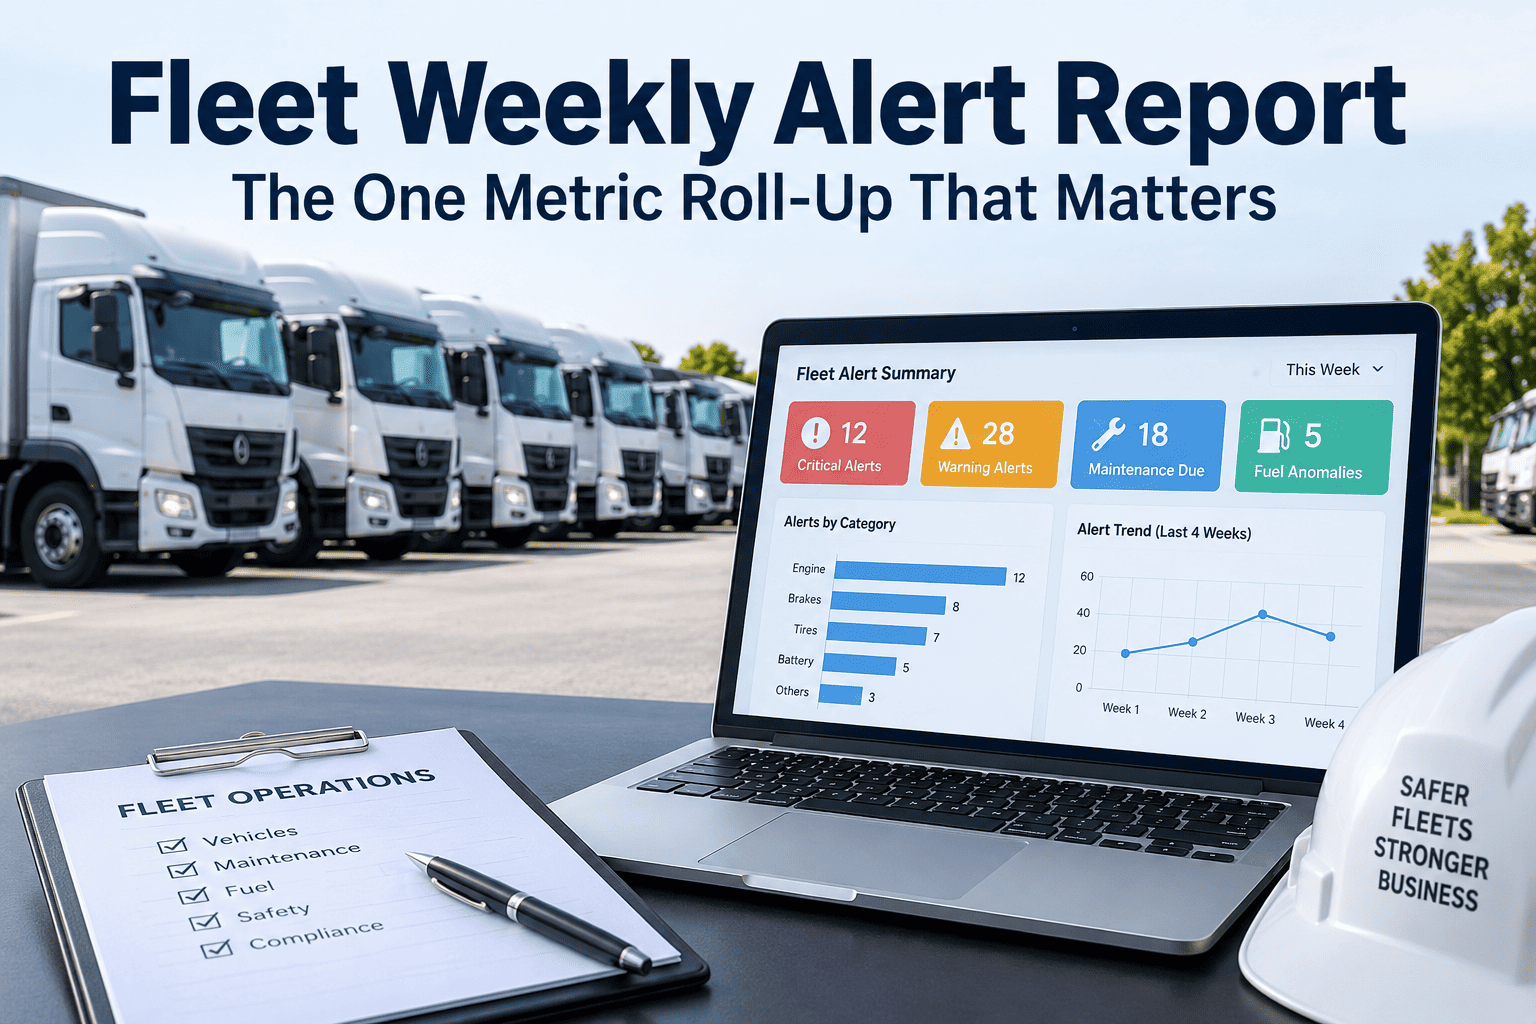
OxMaint groups every alert into the four categories above automatically, refreshed every week per vehicle, per system, and per shop location.
The One Metric: Alert-to-Resolution Trend
If a fleet manager can track only one number on the weekly roll-up, it should be the alert-to-resolution trend — the ratio of alerts closed with a documented action versus alerts still open at week's end, tracked as a moving line rather than a single snapshot. A raw count of open alerts tells leadership almost nothing on its own, because fleet size and seasonality change the baseline constantly. The trend line, by contrast, answers the only question that actually matters to an executive: is the maintenance team keeping pace with what the fleet is throwing at it, or is the backlog quietly growing week after week until it becomes an unplanned downtime event. A flat or improving trend means the current staffing and PM cadence are adequate. A trend sliding backward for two or three consecutive weeks is the earliest warning of a resourcing problem, long before it shows up as a spike in roadside breakdowns.
This single metric replaces the need to review hundreds of individual line items, because it already accounts for volume, severity weighting, and closure velocity in one number that a director can track on a simple line chart from one Monday to the next.
| Reporting Approach | What Leadership Sees | Time to Review | Decision-Ready |
|---|---|---|---|
| Raw alert feed | Every fault code, unsorted, no severity context | 45–90 minutes | No |
| Manually sorted spreadsheet | Alerts grouped by hand, inconsistent categories | 2–3 hours weekly to prepare | Partially |
| Weekly alert roll-up report | Four grouped categories plus one trend line | 5 minutes | Yes |
| OxMaint automated roll-up | Auto-generated, refreshed weekly, zero manual sorting | Under 5 minutes | Yes |
Building the Weekly Roll-Up in Four Steps
A weekly alert roll-up does not require a data science team to build. It requires a consistent structure applied to the same alert stream every week, so leadership can compare this week against last week without relearning the format each time.
What a Sample Week Looks Like
Consider a 60-unit regional fleet running a typical week. The raw alert feed logs 287 individual fault codes across the fleet, ranging from minor tire pressure notices to a handful of engine-critical warnings. Under the old approach, this entire list would be forwarded as a spreadsheet attachment, and realistically nobody outside the shop floor would open it before the following Monday. Under the roll-up structure, that same 287 alerts compress into six critical escalations that need same-day attention, eleven trend movers worth watching over the next two weeks, four recurring offenders flagged for root cause review, and thirty-one closed-loop wins showing repairs that already resolved the underlying issue.
The trend line for that week shows the resolution ratio holding steady at 94 percent, consistent with the prior six weeks, which tells the regional director in about ten seconds that no intervention is needed this week beyond the six flagged escalations. The following week, if that ratio drops to 81 percent and stays there, the same report becomes the trigger for a staffing conversation — not a guess, but a documented trend visible in the same format leadership has already learned to read.
Before we automated this, our ops director got a spreadsheet with 400 rows every Monday and mostly ignored it. Now he gets one trend line and four short lists, and he actually asks questions about it in our Tuesday meeting. That alone changed how fast we get budget approved for shop staffing.
Common Mistakes in Weekly Alert Reporting
Most fleets that attempt weekly alert reporting on their own run into the same handful of structural problems, usually because the report is built manually and depends on one person's availability and judgment each week.
Frequently Asked Questions
Get One Weekly Report Your Executives Will Actually Read
OxMaint turns hundreds of scattered fault codes into a five-minute executive report, refreshed automatically every week across every vehicle in your fleet.