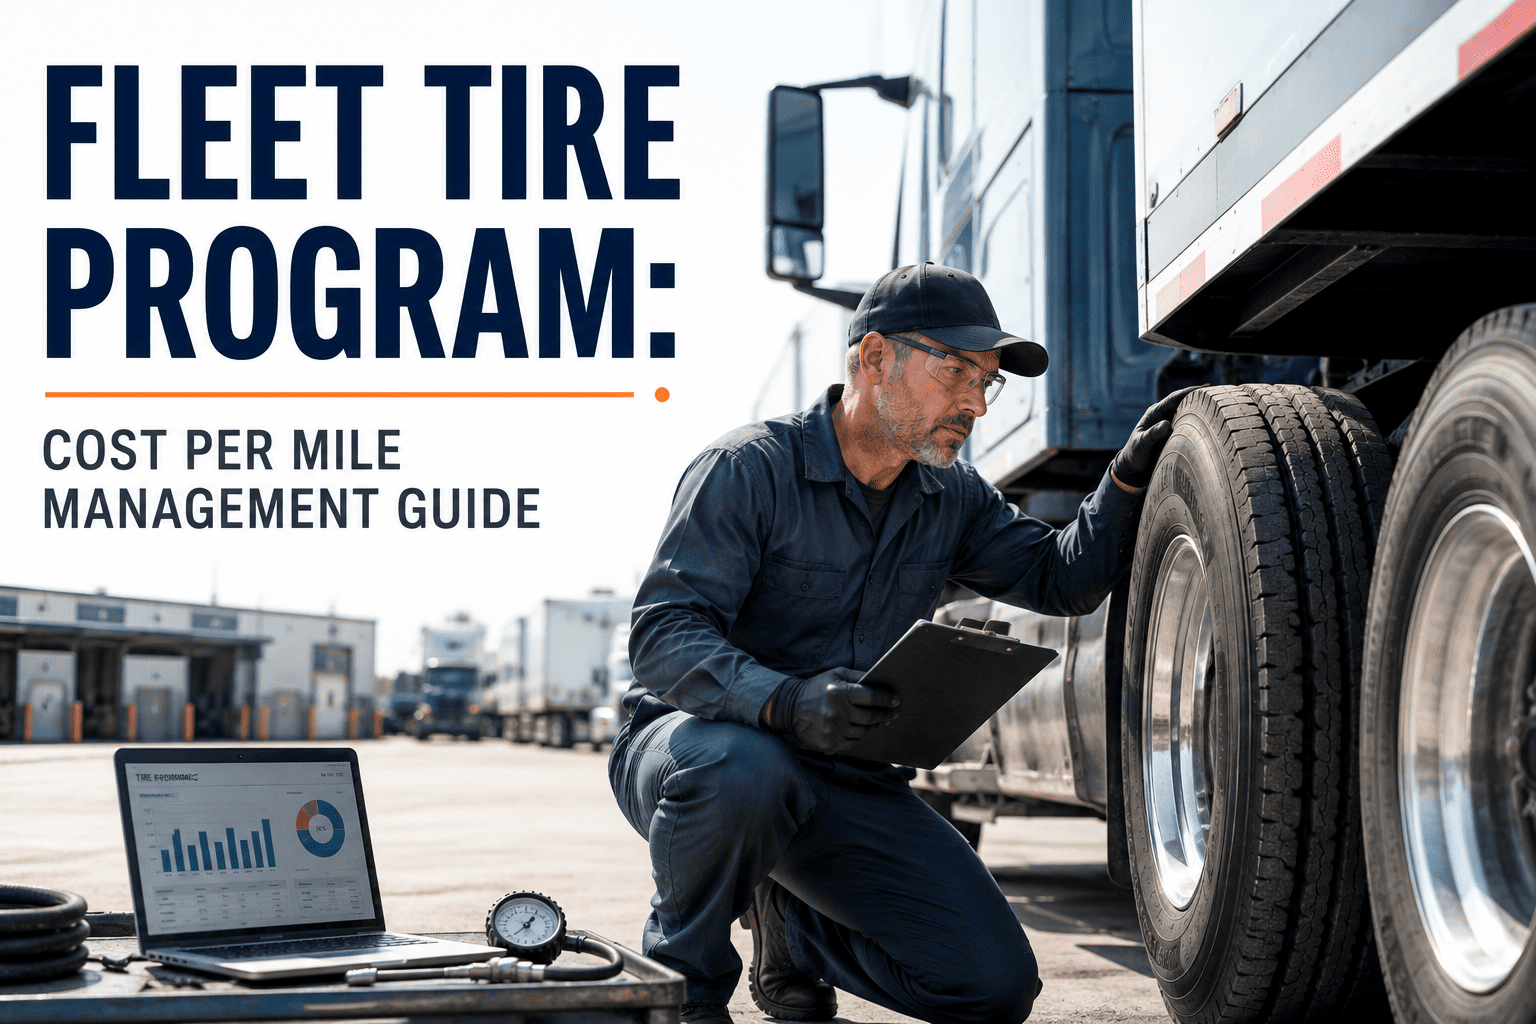
Most fleet managers can quote their fuel cost per mile down to a tenth of a cent, but ask about tire cost per mile and the answer is usually a shrug or a number pulled from last year's invoice pile. Tires typically rank as the third or fourth largest line item on a fleet's cost sheet, right behind fuel and driver wages, yet they get tracked with far less precision than either one. That gap is expensive: fleets that estimate tire spend from memory routinely undercount it by 15 to 25 percent, because service labor, road calls, and casing losses never make it into the total. On a 100-truck fleet running 100,000 miles per truck a year, a single unnecessary cent of tire cost per mile adds up to six figures annually — money leaving the business quietly, one mounted tire at a time. This guide walks through the exact formula, the benchmarks that separate well-run fleets from undermanaged ones, and how to spot the specific trucks dragging your fleet average up before your next tire contract renewal, and if you would rather see this number calculated automatically instead of chased down from invoices, start a free trial with OxMaint.
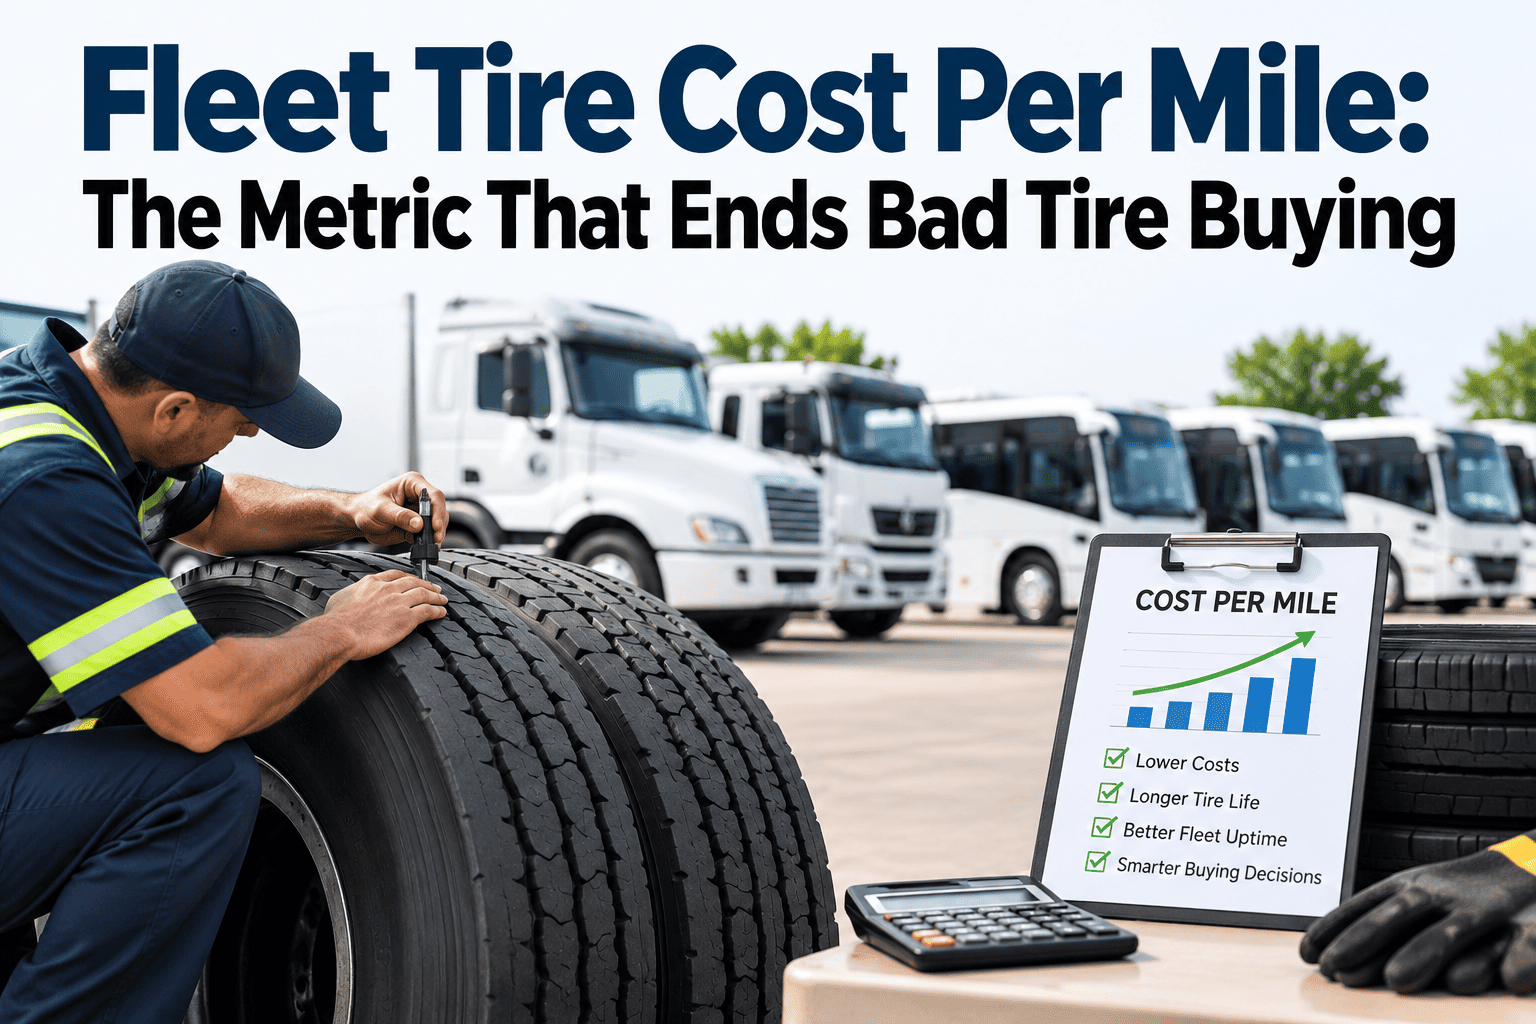
Fleet Tire Cost Per Mile: The Metric That Ends Bad Tire Buying
Every fleet spends heavily on tires. Very few fleets know their real cost per mile. Here is the calculation, the industry benchmark, and the five operational levers that separate a 3-cent fleet from a 7-cent fleet.
What Tire Cost Per Mile Actually Measures
Tire cost per mile sounds simple until you try to calculate it correctly. Most fleet managers who attempt it from memory land 15 to 25 percent below the real number, because the formula has four cost components and it is easy to leave two of them out. Here is the version that matches how ATRI and NPTC benchmark the industry.
Worked example: a fleet running 100 trucks at 100,000 miles per truck per year with total tire cost of $460,000 divides that by 10 million total fleet miles to land at $0.046 per mile — squarely inside the ATRI and NPTC industry average. The arithmetic is simple. Getting all four components complete and the mileage figure accurate from ECM odometer data, not billing miles, is where most fleets lose the discipline.
There is a second, narrower version of this metric that tire manufacturers and dealers use: the per-tire lifecycle cost per mile, calculated by dividing one tire's total cost across its full purchase and every retread cycle by the miles that single casing delivers. A tire bought for roughly $360 that runs 120,000 miles costs about $0.003 per mile on its own; retread it twice at $150 each for another 200,000 miles and the effective cost per mile drops below $0.0021 for that casing. Both numbers are legitimate, but they answer different questions — the fleet-wide figure tells you what your whole operation spends per mile, while the per-tire figure tells you which casing and retread strategy is working. Fleet managers benchmarking against ATRI should always use the fleet-wide version.
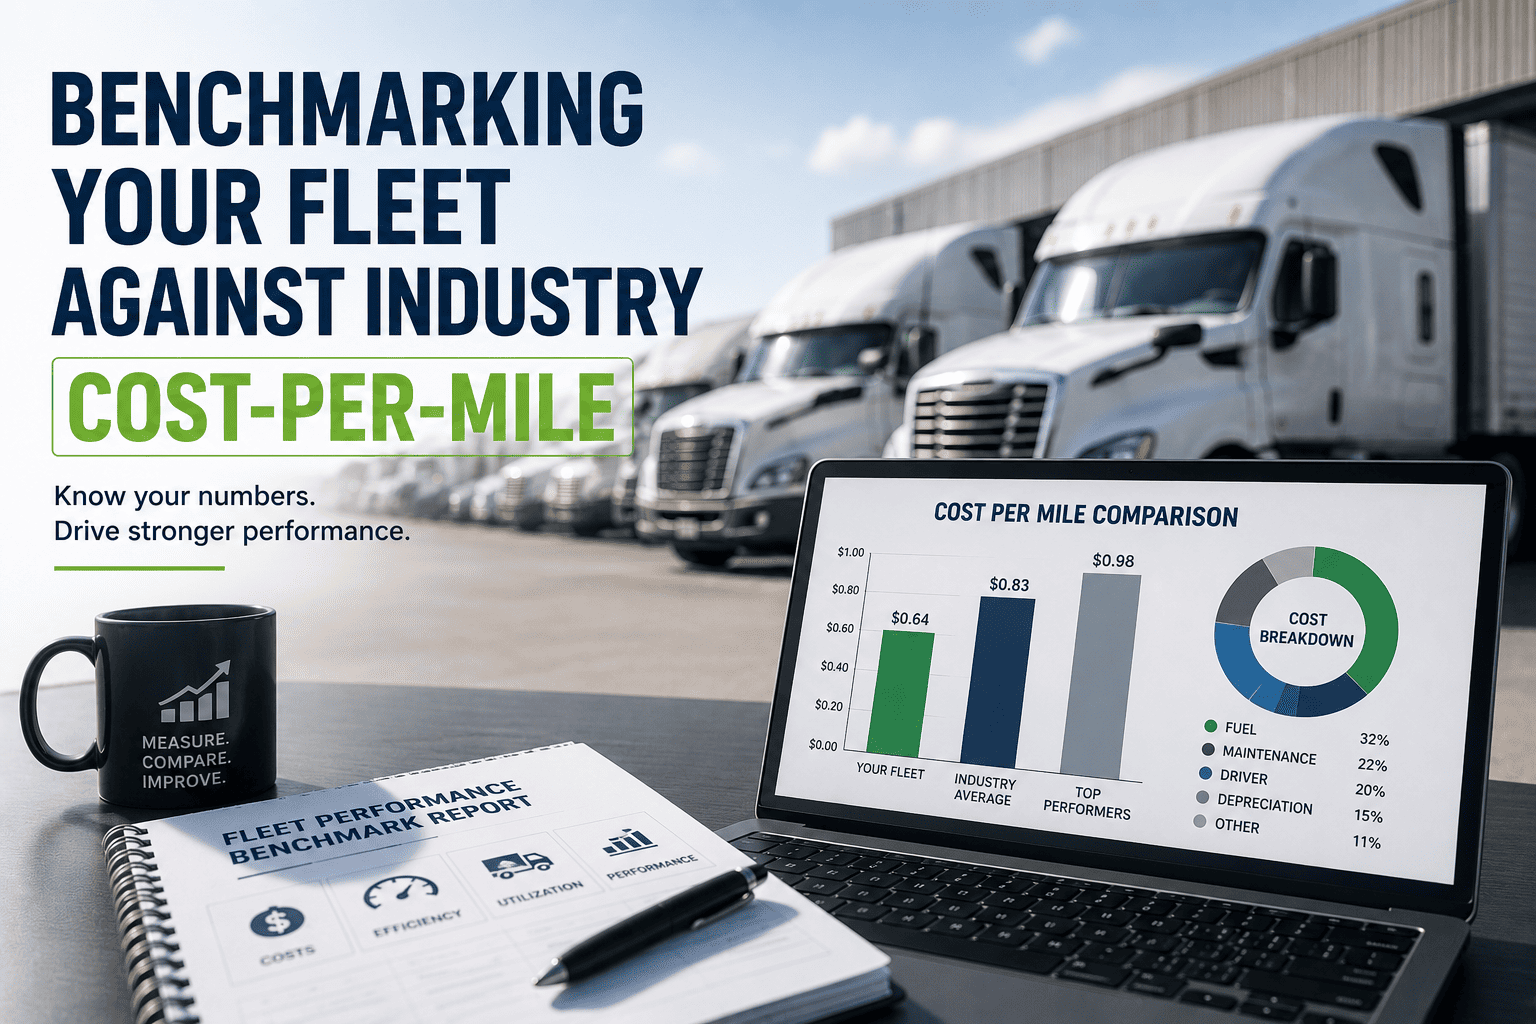
The benchmark itself has moved over time. Older ATRI operational cost analyses covering more than 100,000 trucks and tractors reported tire CPM closer to 3.8 cents; more recent updates put the long-haul average at 4 to 5 cents, reflecting higher tire and casing prices rather than worse fleet management. That upward drift makes the metric more important, not less — a fleet that has not recalculated its tire CPM in a year or two is very likely benchmarking itself against a number that no longer applies, and either overpaying for a tire contract it thinks is competitive or underestimating how much room it has to negotiate.
Where Your Fleet Ranks on the Tire CPM Curve
The spread between a well-run tire program and an undermanaged one is not small. On a 120,000-mile-per-year tractor, the gap between 3 cents and 7 cents per mile is roughly $4,800 per truck, per year. Multiply that across a fleet and the tire line item becomes one of the largest controllable costs on the entire P&L.
Your Tire Spend Already Has a True Number. You Just Haven't Isolated It Yet.
Every purchase order, mount ticket, road call, and casing return already exists somewhere in your operation — scattered across vendor invoices, shop logs, and spreadsheets. OxMaint pulls all four cost components together automatically and attaches them to the vehicle and the mile, so your real tire CPM is always one dashboard away instead of a week of reconciliation at renewal time.
The Five Levers That Actually Move Your Tire CPM
Tire CPM is not a number you negotiate down with your dealer once a year. It is the output of five operational habits, tracked continuously, that either compound in your favor or quietly inflate your average every single day.
Fleet-Wide CPM Hides the Trucks Actually Costing You Money
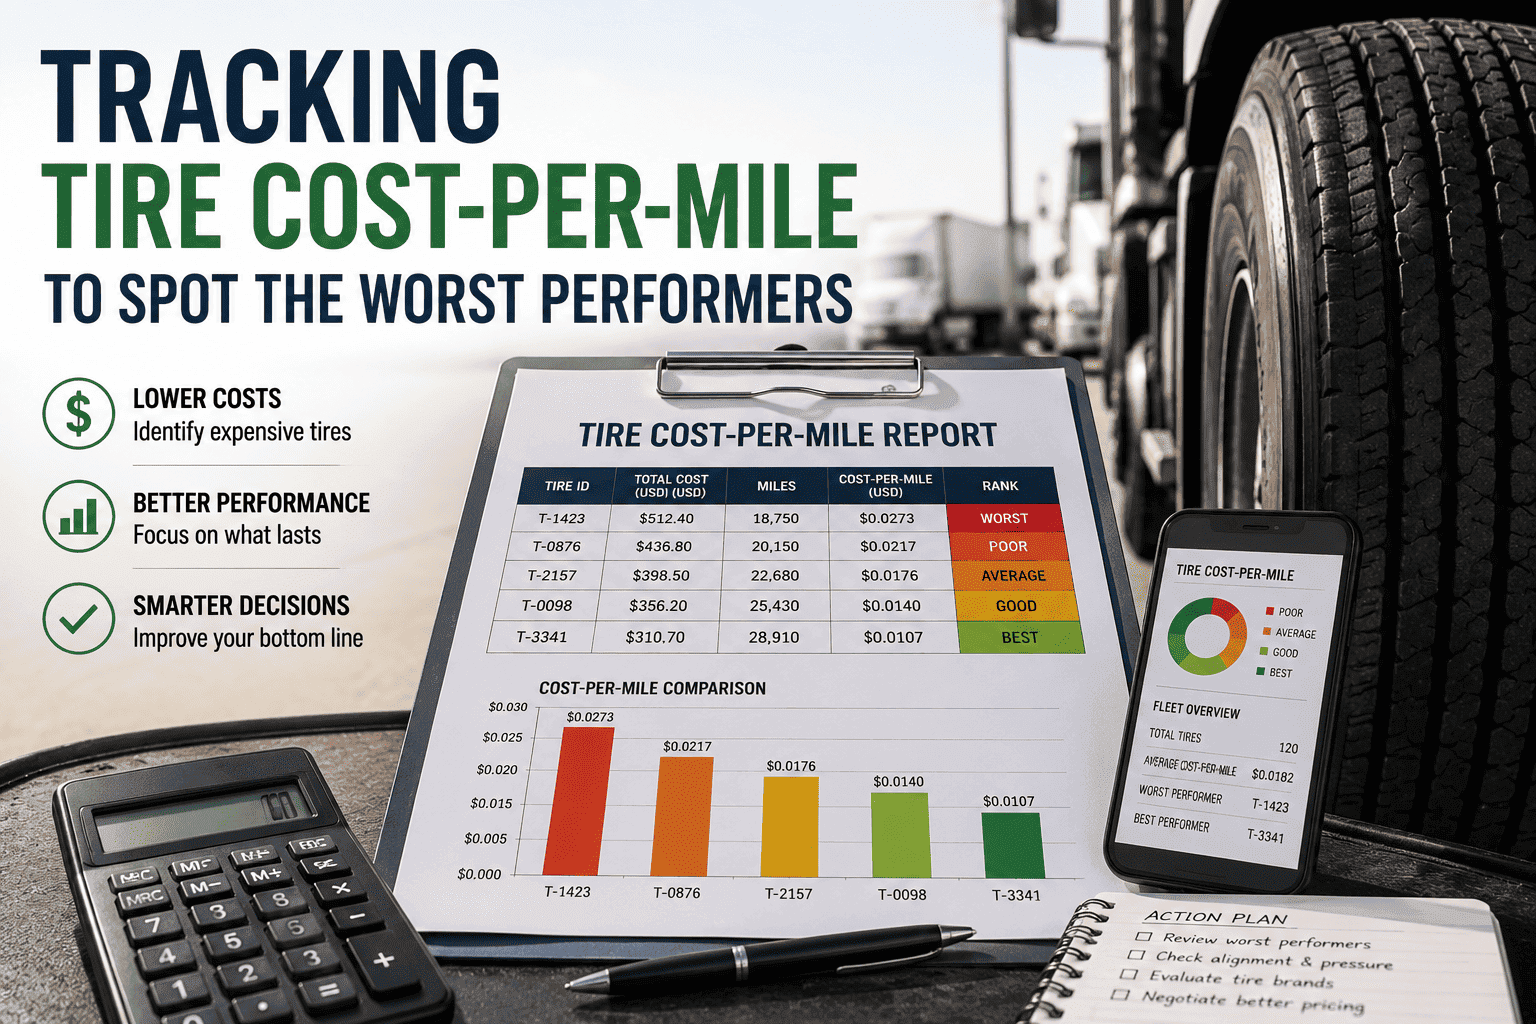
A single fleet-wide tire CPM number is useful for benchmarking against ATRI, but it is close to useless for finding the problem. A fleet averaging 4.6 cents per mile can easily contain a handful of trucks running at 8 or 9 cents, dragging the average up while the rest of the fleet performs at or below best-in-class. The only way to find them is to break the same formula down per truck.
| Truck ID | Annual Miles | Annual Tire Spend | Tire CPM | Vs. Fleet Average |
|---|---|---|---|---|
| Unit 104 | 118,000 | $3,650 | $0.031 | 33% below average |
| Unit 118 | 96,000 | $4,420 | $0.046 | At fleet average |
| Unit 127 | 102,000 | $5,180 | $0.051 | 11% above average |
| Unit 132 | 89,000 | $7,920 | $0.089 | 93% above average |
| Unit 145 | 111,000 | $6,650 | $0.060 | 30% above average |
Illustrative example based on a 100-truck fleet running a $0.046 blended average. Unit 132 alone accounts for nearly double the fleet-average spend per mile — the exact truck a fleet manager needs to inspect for alignment issues, mismatched duty routing, or a driver behavior pattern before the next renewal, not after it.
In practice, the trucks that end up at the top of this list rarely have one obvious cause. It is usually a combination of a slightly out-of-spec alignment that nobody flagged during a routine inspection, a route that shifted from highway miles to a stop-and-go regional lane without the tire spec being reconsidered, and a driver who has picked up a habit of running slightly underinflated. None of those three things shows up clearly in a fuel report or a maintenance ticket on its own — they only become visible once tire spend is tied directly to that specific vehicle and compared against the rest of the fleet on a consistent, recurring basis rather than once a year at renewal.
How OxMaint Calculates and Tracks Tire CPM Automatically
Tire CPM is only actionable if it updates continuously and breaks down to the individual truck. OxMaint builds that visibility as a byproduct of daily maintenance operations, not a separate spreadsheet exercise someone owns quarterly. The same data that keeps your DOT inspection and preventive maintenance records current is reused to keep tire economics current too, so nobody on the team is asked to double-enter a purchase order or chase a road-call invoice from a third-party service provider weeks after the fact.
The result over a full renewal cycle is a fleet that walks into a tire contract negotiation with real numbers instead of a gut feeling. Instead of accepting the vendor's proposed rate increase because last year's invoice total looked roughly similar, a fleet manager can show exactly which brand, which spec, and which retread mix produced the lowest cost per mile across the fleet — and negotiate from that position instead of from memory.
Fleet Tire CPM — Questions Operations Teams Ask Before Their Next Tire Contract
What exactly should be included in a fleet tire cost per mile calculation? +
What is considered a good tire CPM benchmark for a commercial fleet? +
How much does retread mix actually affect tire cost per mile? +
Why does per-truck CPM matter more than the fleet-wide average? +
How often should a fleet review its tire cost per mile? +
Stop Guessing Your Tire Spend. Start Measuring It Per Mile, Per Truck.
OxMaint automatically tracks every tire purchase, service ticket, road call, and casing life against the vehicle it belongs to, turning tire cost per mile into a live number instead of a once-a-year spreadsheet exercise. See exactly where your fleet sits on the CPM curve and which trucks are costing you the most, starting today.