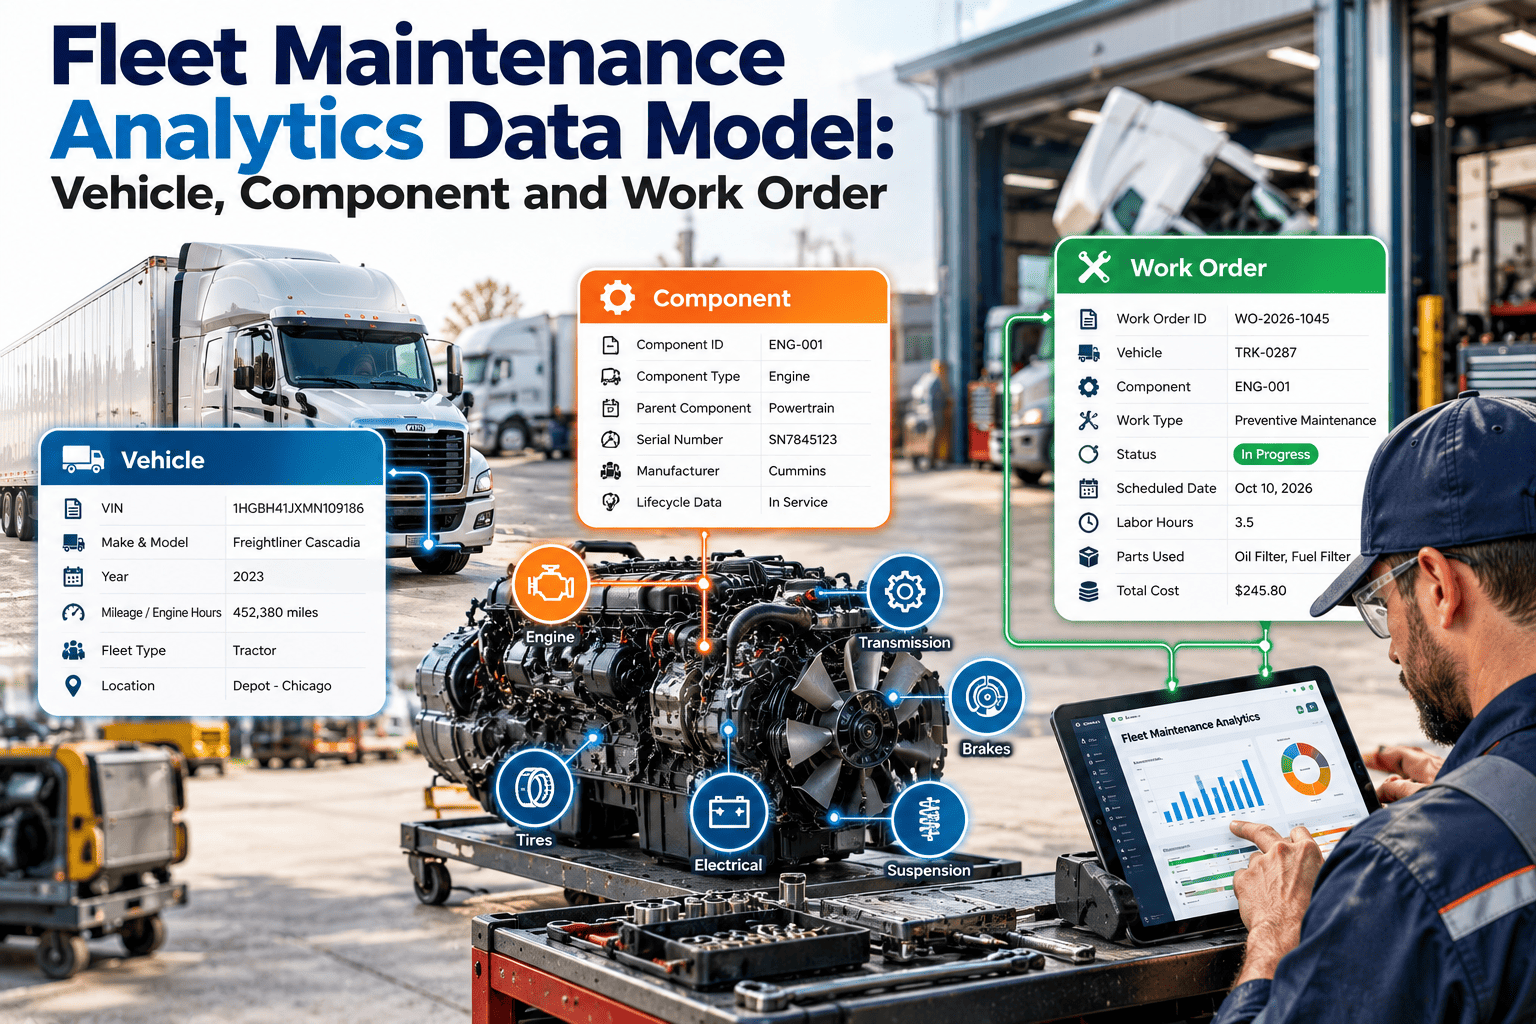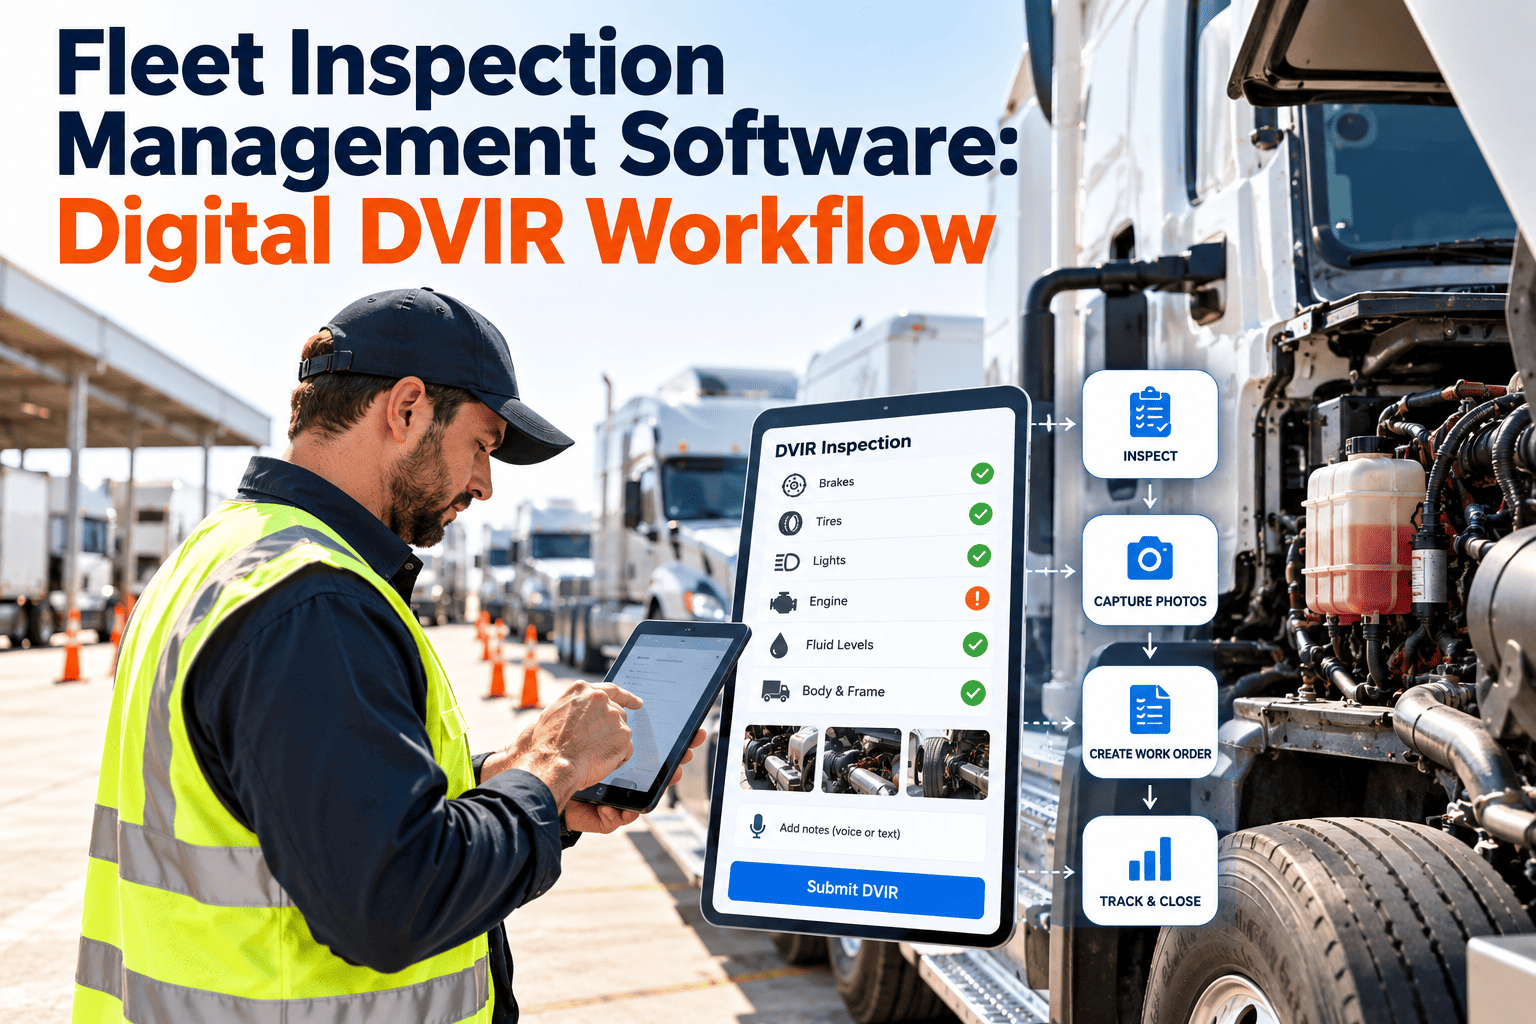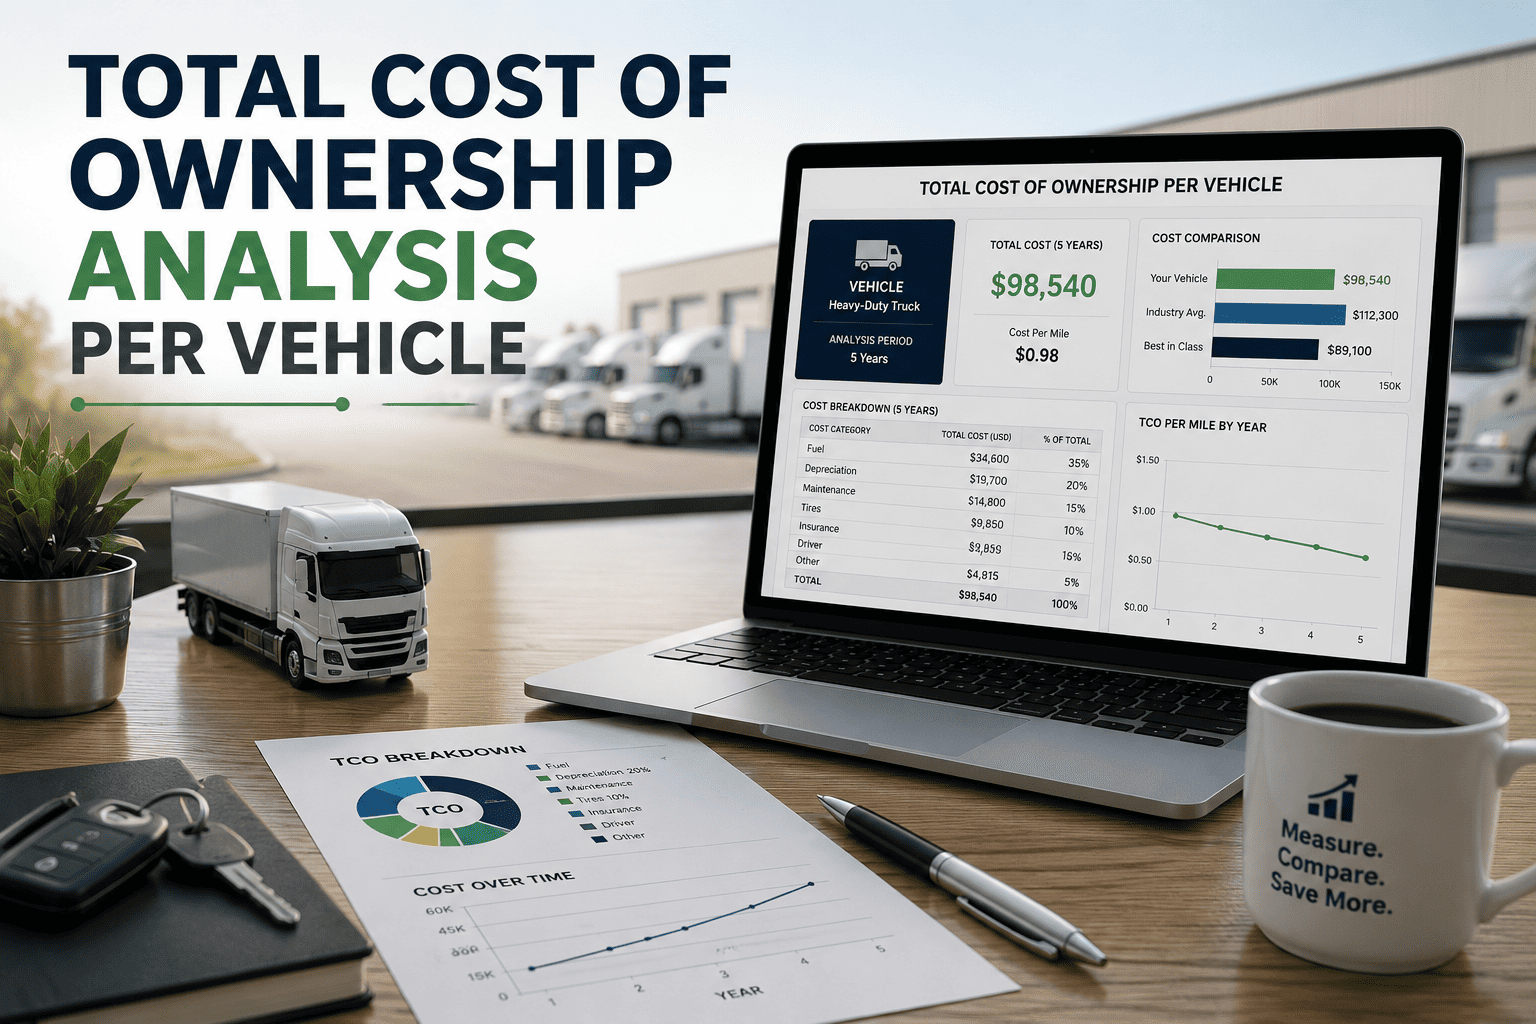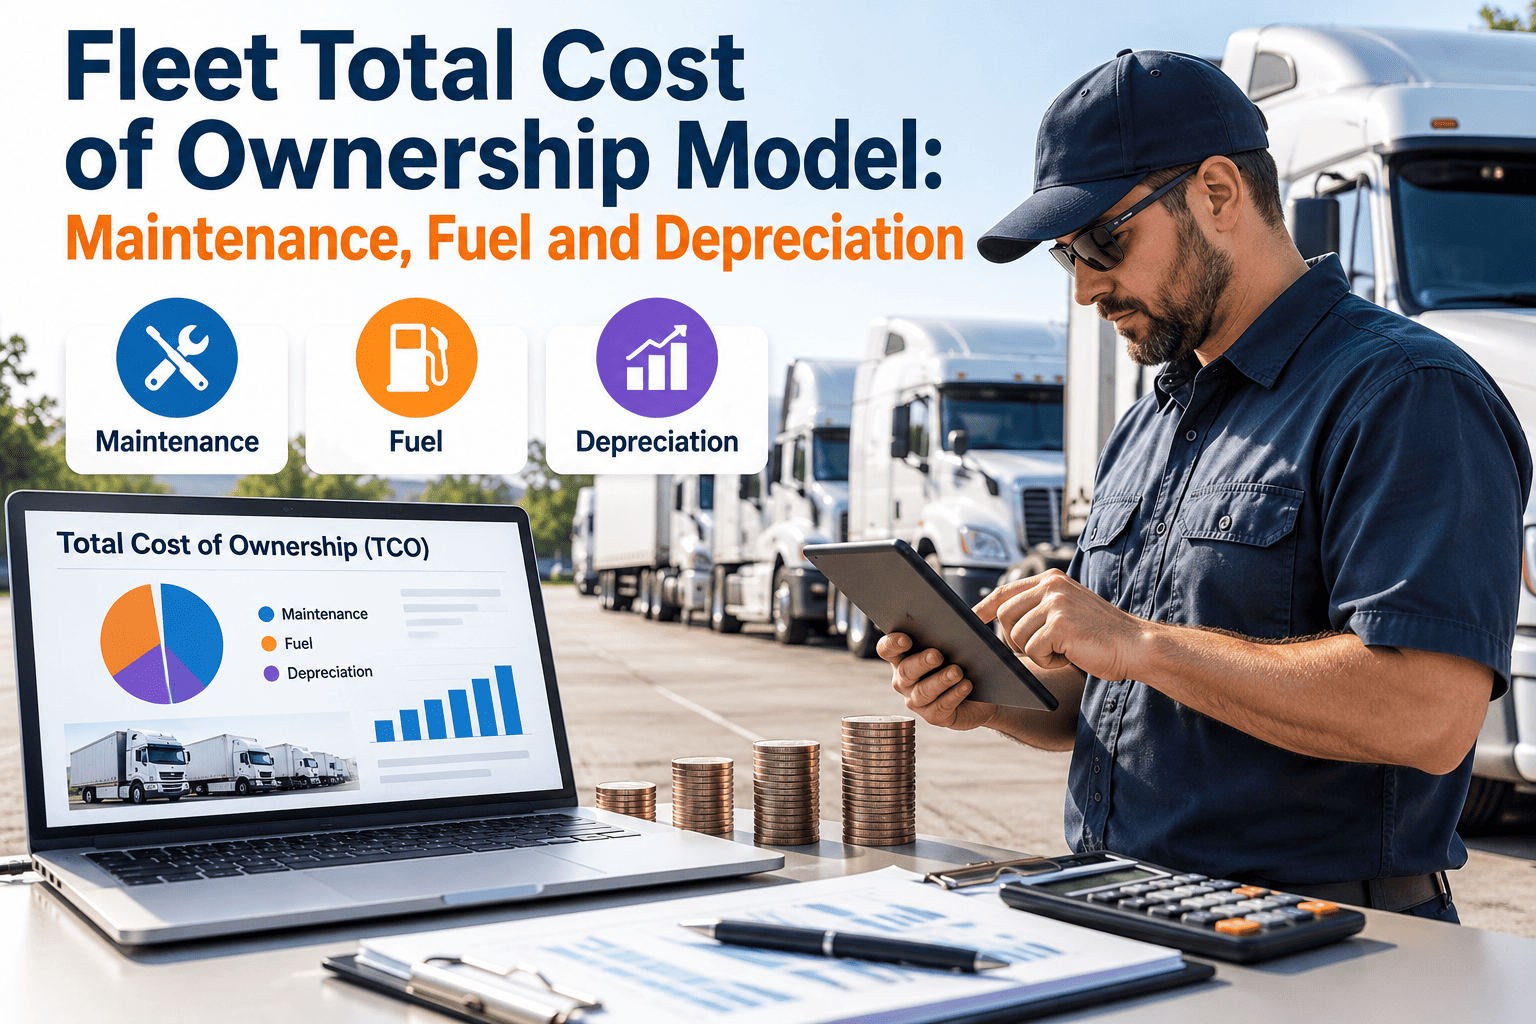
A fleet manager who only watches the repair budget can miss the real story. A truck with modest maintenance bills may still be expensive if it burns more fuel, loses value quickly, or spends too many days out of service. Total cost of ownership, or TCO, pulls these pieces together so vehicles can be compared on the same footing across their entire life. This guide shows how to build a practical TCO model around maintenance, fuel and depreciation, which data each part needs, and how maintenance records inside a fleet maintenance management platform turn the model from a spreadsheet exercise into a living decision tool.
Fleet total cost of ownership: the model behind retain, repair and replace decisions
Combine maintenance, fuel, depreciation and downtime into one cost per mile or per hour, then use it to compare units, classes and replacement timing.
Why single-line budgets mislead
Most fleets track costs in separate places owned by separate teams. That structure hides the trade-offs that matter most.
Siloed view
- Finance sees depreciation and lease cost on one report
- Fuel is reviewed by operations by route or driver
- Maintenance is reported as a monthly shop total
- Older units look cheap because their book value is low
- Replacement requests rely on opinion and recent breakdowns
TCO view
- Every unit carries all cost layers in one record
- Cost per mile or hour makes different vehicles comparable
- Maintenance spend is linked to age, usage and repair type
- Old units are judged on running cost, not book value alone
- Replacement timing is supported by the cost trend
The cost categories and where the data lives
A model fails when one category is missing or estimated loosely. Identify the source and the owner of each input before building any formulas.
| Cost category | What it includes | Typical source | Data owner |
|---|---|---|---|
| Acquisition and depreciation | Purchase price, upfitting, expected resale value, financing or lease cost | Purchase records, accounting, appraisals | Finance |
| Fuel and energy | Fuel purchases, electricity, DEF, idle time | Fuel cards, tank systems, telematics | Operations |
| Maintenance and repair | Labor, parts, outside vendor work, preventive and corrective jobs | Work orders and inventory records | Maintenance |
| Tires | New, retread, repair and road service | Work orders, tire program invoices | Maintenance |
| Insurance, registration, permits | Premiums, licensing, inspection fees | Insurance and compliance files | Risk or admin |
| Driver and operating cost | Wages, if compared across vehicle types with different labor needs | Payroll, dispatch | Operations |
| Downtime | Lost revenue, substitute vehicles, delay penalties | Work order out-of-service time, dispatch | Operations and maintenance |
The core formulas
Keep formulas simple and transparent so finance, operations and maintenance can all check them. Choose one reporting period and apply it consistently.
TCO = Depreciation + Financing + Fuel + Maintenance + Tires + Insurance and fees + Downtime cost
Cost per mile = TCO for the period / Miles driven in the period
Annual depreciation = (Purchase price - Expected resale value) / Years in service
Maintenance per mile = (Labor + Parts + Vendor repairs + Tires) / Miles driven
Fuel per mile = Fuel cost in the period / Miles driven in the period
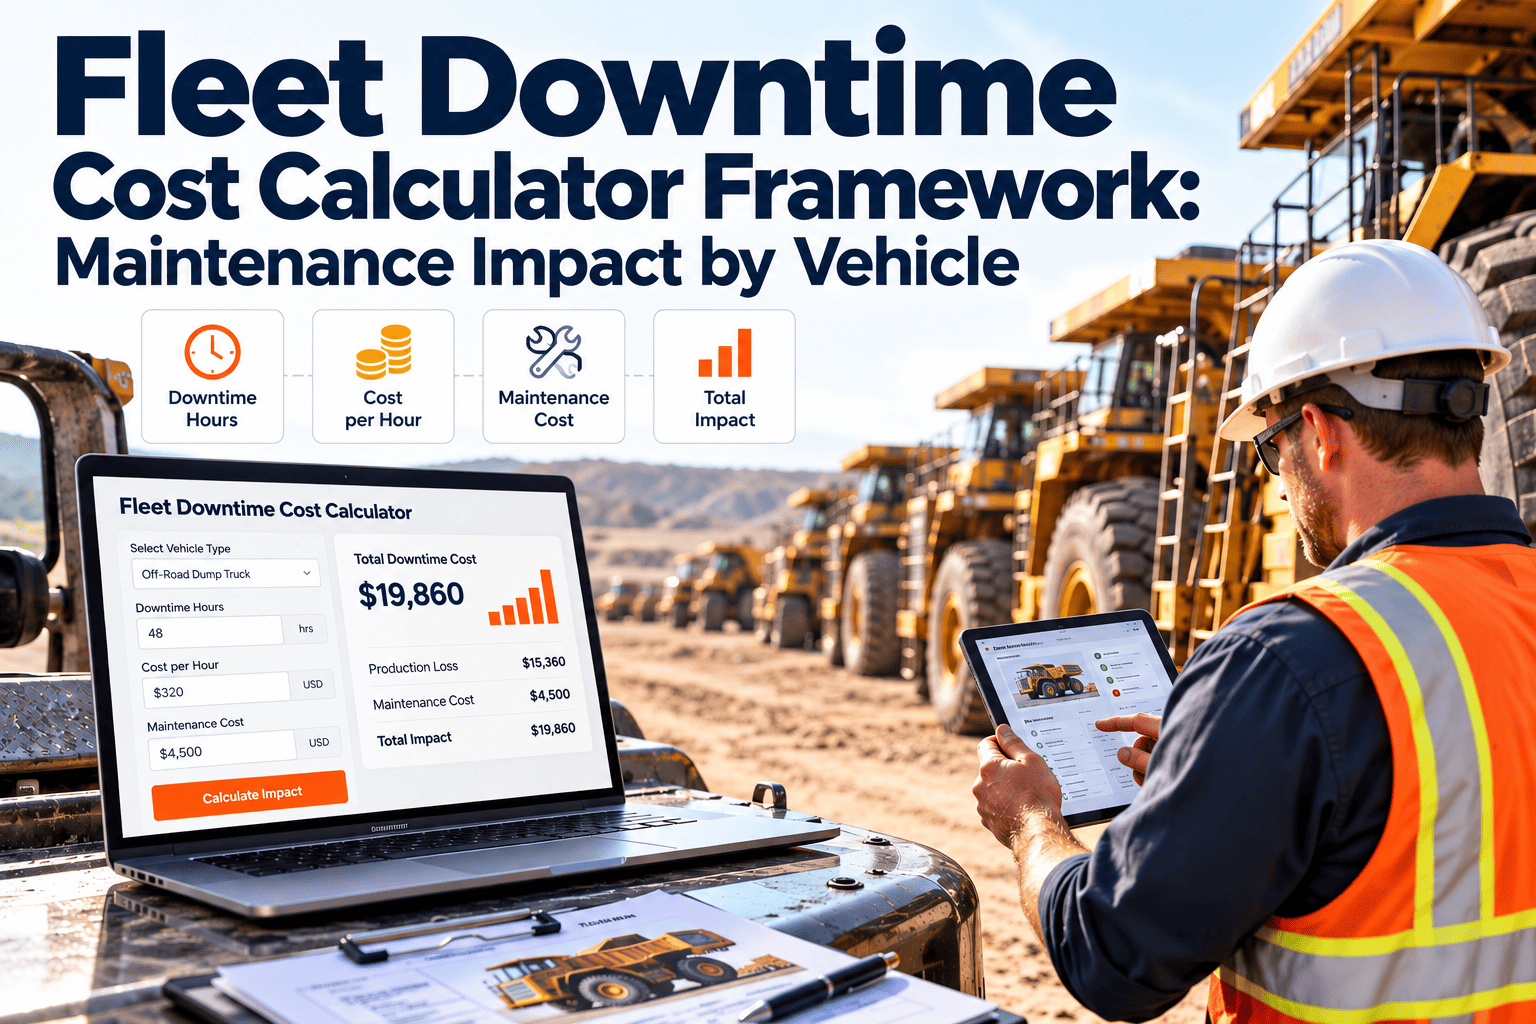
Downtime cost = Days out of service x Daily cost of lost or substituted service
For equipment measured in hours, replace miles with operating hours. Use the same denominator for every unit in a comparison.
Feed your TCO model with maintenance data you can trust
Capture labor, parts, vendor spend and downtime on every work order in Oxmaint, and see cost by unit, class and location.
Maintenance: the cost layer you can influence most
Depreciation is largely set at purchase, and fuel depends on routes and prices. Maintenance is the layer where process changes produce visible results.
Fuel: more than a price per gallon
Fuel is often the largest operating cost, and it interacts with maintenance condition. A change in fuel economy can be an early warning.
Track these fuel measures
- Fuel cost per mile or per hour for each unit
- Fuel economy trend over time for similar units on similar routes
- Idle time as a share of engine hours
- Fuel purchased versus fuel expected from distance driven
Maintenance conditions that can affect fuel use
- Underinflated or mismatched tires and poor alignment
- Dragging brakes or wheel-end problems
- Clogged air or fuel filters and failing injectors
- Aerodynamic damage and unrepaired body components
Depreciation: use condition, not just age
Straight-line depreciation is easy to calculate but ignores how a vehicle was used and maintained. Combine it with condition and usage to estimate resale value more realistically.
Complete service histories, documented preventive maintenance and clean inspection records support stronger resale conversations, which makes the maintenance system part of the depreciation story.
The ownership curve and the replacement window
Vehicle costs usually shift over time. The conceptual illustration below shows a common pattern, not measured data. Your own records will show where your units sit on it.
Signals that a unit is nearing replacement
No single number decides. Review these signals together, and compare each unit with its own class rather than the whole fleet.
| Signal | What to look at | Possible action |
|---|---|---|
| Rising cost per mile | Trailing twelve-month trend compared with similar units | Review for replacement planning |
| Repeat major repairs | Same system failing across consecutive repairs | Root cause review, then retain or retire |
| Downtime days | Out-of-service time per quarter and its operational cost | Include downtime cost in the comparison |
| Parts availability | Lead times and cost of components for older models | Plan replacement before parts become critical |
| Safety and compliance features | Gaps against current regulations or customer requirements | Include upgrade cost in retain scenario |
| Fuel economy gap | Difference from newer comparable units | Model fuel savings against capital cost |
Build the model in six steps
Common TCO modeling mistakes
A data collection template for the model
Before building any dashboard, collect the same set of fields for every unit. The table below can be used as a starting template, whether you work in a spreadsheet or a maintenance system.
| Field | Why it is needed | Refresh frequency |
|---|---|---|
| Unit number, VIN, class, location | Join data from different systems and group results | On change |
| In-service date and purchase price | Depreciation and age banding | Once |
| Expected resale value and method | Depreciation calculation | Annually |
| Lease or finance payment | Financing cost per period | Monthly |
| Miles or hours in period | Denominator for cost per mile or hour | Monthly |
| Fuel cost and quantity | Fuel cost per mile and efficiency trend | Monthly |
| Maintenance labor, parts and vendor cost | Maintenance cost per mile and cost mix | Monthly |
| Out-of-service days | Downtime cost | Monthly |
| Insurance, registration and fees | Fixed ownership cost | Annually |
Using TCO in budgeting and purchasing
A TCO model earns its place when it changes decisions. Three situations benefit most: annual budgeting, vehicle specification and retain-or-replace reviews.
Budgeting
- Build maintenance budgets from cost per mile by class and expected utilization, not from last year's total alone
- Reserve funds for known major events such as engine overhauls and tire replacements
- Separate planned preventive spend from unplanned repair spend so improvement efforts are visible
Vehicle specification and purchase
- Compare candidate models using fuel economy, expected repair cost and parts availability, not only price
- Review your own repair history by make and model before choosing the next order
- Consider the cost of training, special tools and diagnostic software for new equipment types
A simple retain-or-replace comparison
- Estimate the next period's cost of keeping the unit, including expected repairs, downtime and fuel
- Estimate the cost of the replacement, including depreciation, financing and warranty-covered maintenance
- Compare cost per mile for both options over the same horizon and note the assumptions behind each
- Test the result with a higher and a lower repair estimate before deciding
What the cost mix looks like for different fleets
The same formulas produce different profiles across fleet types. Knowing which layer usually dominates tells you where to look first. These are qualitative patterns to test against your own data.
| Fleet type | Layers that often weigh most | Questions to ask |
|---|---|---|
| Long-haul tractors | Fuel, tires, depreciation | How does fuel economy trend as units age? |
| Local delivery vehicles | Maintenance, brakes, driver time, downtime | Which units cause the most missed routes? |
| Vocational and construction equipment | Maintenance, hydraulics, idle fuel, downtime | Should cost be tracked per hour instead of per mile? |
| Light-duty service vans | Depreciation, fuel, insurance | Is it cheaper to rotate vehicles earlier? |
| Refrigerated transport | Fuel for the unit, maintenance of cooling equipment, spoilage risk | Does the reefer unit need its own cost record? |
Electric and alternative-fuel vehicles
- Replace fuel with energy cost, including charging infrastructure, demand charges and time of use.
- Track battery health and warranty terms, since they strongly influence resale value.
- Expect a different maintenance profile, with fewer engine services but attention to brakes, tires, cooling and high-voltage systems.
- Check which purchase incentives and rebates apply in your region, as they vary and change over time.
Reporting views for different audiences
- Technicians and shop leads: repeat repairs and open work by unit
- Maintenance managers: cost per mile by class, planned versus unplanned share and parts spend
- Finance: total cost by layer, depreciation assumptions and lease schedules
- Executives: fleet-level cost per mile trend, replacement pipeline and risk units
Frequently asked questions
What is included in fleet total cost of ownership?
Depreciation or lease cost, financing, fuel, maintenance, tires, insurance, fees and downtime. Some fleets also include driver cost when comparing different vehicle types.
How does maintenance data improve a TCO model?
Work orders show labor, parts, vendor spend and out-of-service time by unit. You can get started with a maintenance system that records them consistently.
Should we use cost per mile or cost per year?
Cost per mile or hour is better for comparing units with different utilization. Annual cost is still useful for budgeting.
When is the right time to replace a vehicle?
There is no fixed age. Review cost trend, repeat repairs, downtime, parts availability and compliance together, and compare against comparable units.
Can we build this without special software?
You can start in a spreadsheet, but data entry and reconciliation become heavy. You can book a demo to see maintenance cost reported by unit.
See the full cost of every vehicle in your fleet
Connect work orders, parts, inspections and asset history so maintenance cost is ready for every replacement decision.