A logistics director in Ohio ran 84 delivery vans and knew "roughly" what each cost — around $0.62 per mile based on last year's fuel and maintenance invoices. When his finance team ran a full TCO analysis for the annual budget, the real number came back at $0.91 per mile once depreciation, financing interest, downtime, insurance escalation, and administrative overhead were included. The 29-cent gap across 84 vans running 24,000 miles a year was $584,000 in costs the operations budget never showed and the CFO never approved. Six vans were operating 41% above fleet average — replacing them saved $178,000 in the first 12 months. The problem was not overspending. The problem was that the true cost of every vehicle was invisible. If your fleet's cost data lives in five disconnected systems, start a free trial with Oxmaint or book a demo.
Fleet Analytics / Total Cost of Ownership / 2026 Guide
Fleet Total Cost of Ownership Analysis Guide 2026: Per-Vehicle Cost Modeling That Reveals Which Assets Are Draining Your Budget
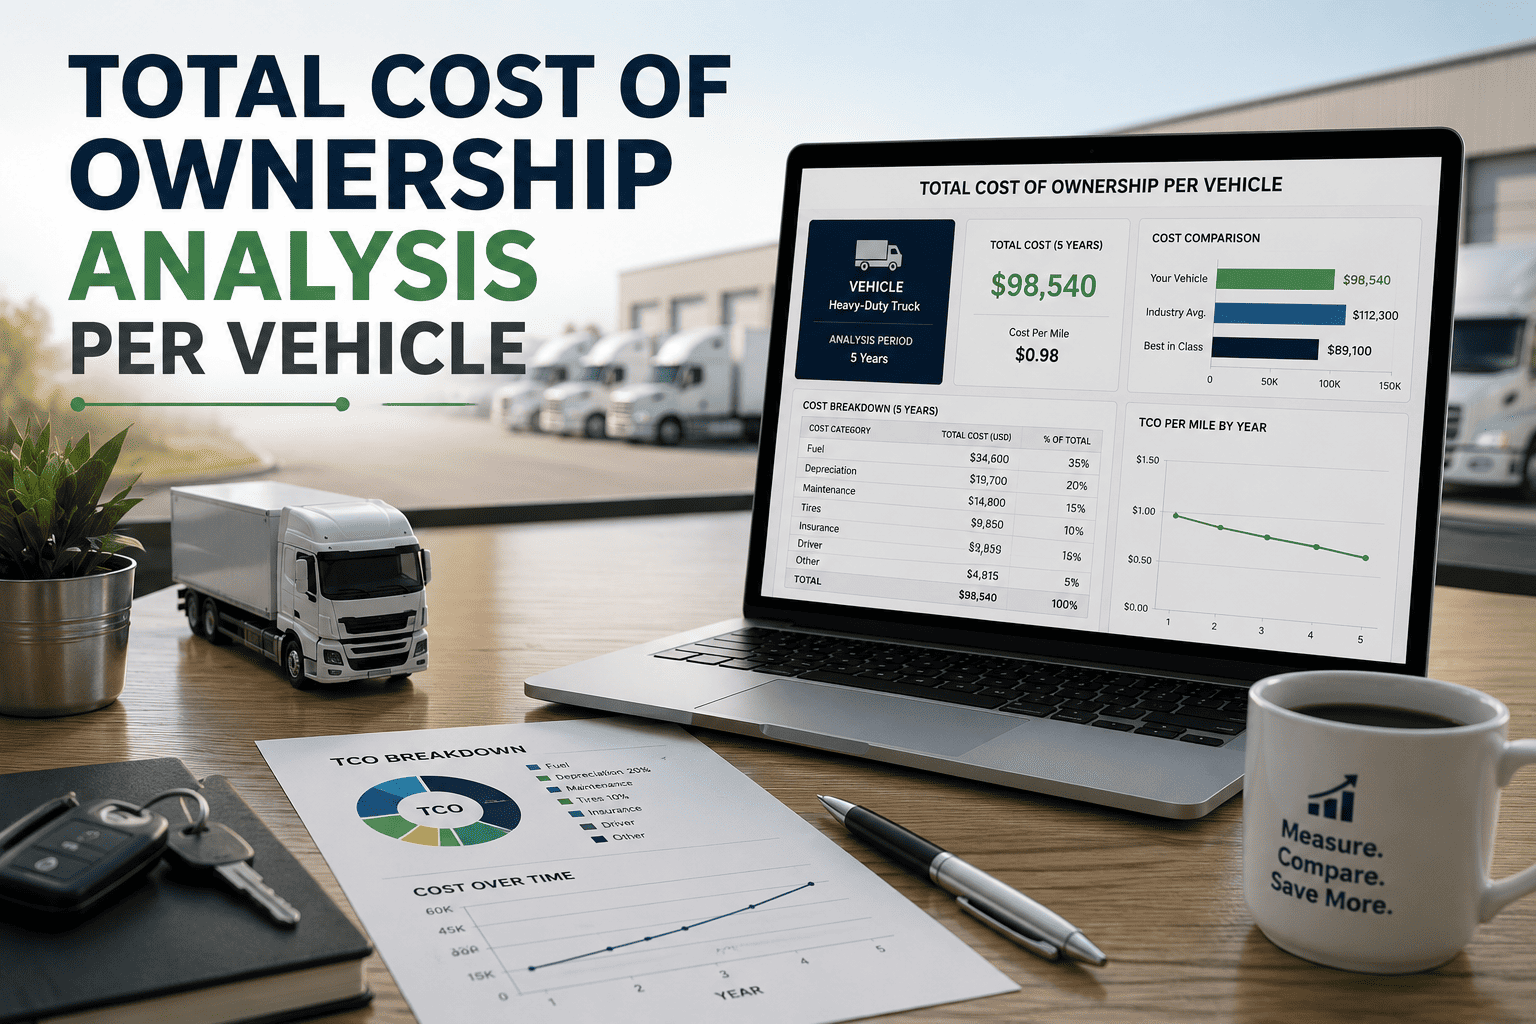
The vehicle with the lowest fuel bill is not always the cheapest to own. TCO analysis assembles fuel, maintenance, parts, depreciation, financing, insurance, downtime, and disposal into a single per-mile number — the only metric that makes replacement, acquisition, and route-assignment decisions defensible.
$2.26
Average total cost per mile across US commercial fleets — Geotab 2024
35-45%
Hidden indirect cost load added on top of directly-tracked expenses
14% vs 38%
Self-reported TCO variance vs third-party audited data — Ryder / KPMG study
41%
Of fleets report $0 for downtime, roadside, or admin — leaving TCO badly understated
The Iceberg Problem: What Fleet Managers See vs. What TCO Actually Contains
Most fleet cost conversations happen around fuel and maintenance because those two categories generate invoices every week. Depreciation is silent. Financing interest is buried in the accounting system. Downtime is measured in missed deliveries rather than dollars. Administrative overhead is spread across payroll. When these five invisible categories are added back, the true cost per mile is 35–45% higher than the visible one — and the ranking of which vehicles are actually most expensive to run changes completely.
Visible
55–65% of true TCO
What Fleet Managers Actually Track
Costs that generate invoices, statements, or bills — easy to see, easy to add up.
01
Fuel Spend
From fuel cards and receipts
02
Work Order Invoices
Shop labor and repair bills
03
Parts Purchases
Direct parts and consumables
04
Insurance Premiums
Annual policy totals
Hidden
35–45% of true TCO
What TCO Actually Contains
Costs distributed across systems — rarely aggregated per vehicle, systematically underreported.
01
Depreciation Curve
Market value loss per vehicle
02
Cost of Capital
Financing interest or opportunity cost
03
Downtime Loss
Revenue lost per hour off road
04
Roadside Recovery
Towing and emergency response
05
Admin Overhead
Per work order processing time
06
Compliance Exposure
DOT, FMCSA penalty risk
07
Efficiency Drift
MPG decline as vehicle ages
08
Disposal Losses
Remarketing and auction fees
Per-Vehicle TCO Automation
Every Cost Category. Every Vehicle. One Live Number That Actually Reflects Reality.
Oxmaint pulls fuel, work orders, parts, depreciation schedules, financing terms, and downtime hours into a single asset record — so per-vehicle TCO is not a quarterly spreadsheet project, it is a column on your fleet dashboard that updates every day.
Cost Per Mile by Vehicle Class — 2026 US Fleet Benchmarks
Total cost per mile scales predictably with vehicle class, duty cycle, and GVWR. The numbers below are typical operating benchmarks for well-managed fleets in 2026 — fleets running above these bands are either operating unusual duty cycles or leaving TCO reduction on the table. The gap between top-quartile and bottom-quartile fleets in the same class is consistently 20–35%, which is where operational improvement generates the largest returns.
Light-Duty Van / Pickup
GVWR under 10,000 lbs
Last-mile delivery, service vans, sales fleets
Medium-Duty Box Truck
Class 3-6 / GVWR 10,001-26,000 lbs
Regional distribution, food service, utility fleets
Heavy-Duty Class 7
GVWR 26,001-33,000 lbs
Refuse, construction, municipal fleets
Heavy-Duty Class 8
GVWR over 33,000 lbs
$1.75–$2.25 / mile visible / $2.74 true
Long-haul trucking, tractor-trailer, tanker
The 8 Cost Components That Make Up True TCO
A defensible TCO model has eight cost components. Skip any of them and the number is directional at best, misleading at worst. Fleets that run TCO analysis on only fuel and maintenance capture less than half the real cost picture, which is why replacement decisions built on partial data consistently mistime the market and burn capital.
01 / Fixed
Acquisition Cost
Purchase price, dealer fees, delivery, tax, initial outfitting, and any specialized upfits (lift gates, refrigeration, dash cameras, telematics install). One-time expense but the largest single line item on day one. Fleet discount negotiation on volume purchases typically saves 4-8%.
Typical share of lifetime cost: 18-24%
02 / Fixed
Financing / Cost of Capital
Interest paid on financed vehicles, or the opportunity cost of cash purchases (return foregone on capital tied up in the asset). At 6-8% APR on a $165,000 Class 8 truck, financing alone adds $12,000-$16,000 per year — a cost often omitted from cash-purchase TCO models.
Typical share of lifetime cost: 6-10%
03 / Fixed
Depreciation
Market value loss from acquisition to disposal — steepest in years 1-2 (35-45% of purchase price), then flattening. Assets typically retain around 20% of purchase price after 5-6 years. Often the largest single lifetime cost category and the one CFOs pay most attention to.
Typical share of lifetime cost: 20-28%
04 / Fixed
Insurance and Registration
Liability, cargo, physical damage, and umbrella coverage plus DOT registration, IFTA, permits, and licensing. Commercial auto insurance rose double-digit percentages annually 2020-2025 and remains under pressure from nuclear verdict trends. Safety score, dash cam program, and claims history drive premium.
Typical share of lifetime cost: 8-12%
05 / Variable
Fuel and Energy
Diesel, gasoline, natural gas, or electricity — the largest variable cost and the one most sensitive to driver behavior. A 10% increase in idle time raises fuel cost 4-6%. Fleet fuel consumes up to 39% of operating budgets for US SME fleets — often the largest single controllable category.
Typical share of lifetime cost: 22-30%
06 / Variable
Maintenance and Parts
Preventive maintenance, unscheduled repairs, tires, fluids, and parts inventory. Newer vehicles (0-3 years) run $0.08-$0.12 per mile; older vehicles (7+ years) jump to $0.15-$0.22. Emergency roadside repair averages $3,200 vs $400-$800 for the same component addressed on a planned PM cycle.
Typical share of lifetime cost: 15-22%
07 / Hidden
Downtime Cost
Revenue lost while the vehicle is off the road — driver wages continuing, customer service impact, rental vehicle costs, and missed delivery commitments. Averages $448-$760 per day for commercial trucks. This is the cost fleets underreport most consistently because no invoice arrives to make it visible.
Typical share of lifetime cost: 6-10%
08 / Hidden
Disposal and Remarketing
End-of-life auction fees, debranding, transport to auction, administrative processing, and net disposal proceeds. Independent remarketing costs $800-$1,400 per vehicle. The final line item that closes the vehicle's lifetime P&L — and reveals whether the acquisition decision generated the return the fleet expected.
Typical share of lifetime cost: 3-5%
The U-Shaped Cost Curve — Why Replacement Timing Determines Fleet Profitability
Cost per mile does not stay flat across a vehicle's life. It follows a U-shape: high in the first two years because depreciation is front-loaded, low in the middle years when the vehicle is paid down but not yet in the maintenance escalation zone, and high again in the late years when reactive repairs, downtime, and fuel efficiency drift compound. Most fleets replace too late — keeping vehicles into the steep right side of the curve because replacement CapEx is visible and rising maintenance is distributed across many small invoices.
Years 0-2
High Total Cost — Depreciation Heavy
$0.95–$1.15 / mile
Depreciation absorbs 35-45% of purchase price in the first 24 months. Financing interest is at peak. Maintenance is minimal, still under manufacturer warranty. The vehicle is expensive because you are paying off the acquisition — not because it is failing.
Not the replacement window
Years 3-5
Sweet Spot — Lowest Total Cost
$0.68–$0.85 / mile
Depreciation curve flattens. Financing is closer to paid off. Maintenance is still on the low end of the escalation curve. This is the financial optimum — the years where the vehicle earns back the acquisition premium and delivers the highest ROI per mile driven.
Peak profit zone
Years 6+
Escalation Zone — Maintenance Explodes
$1.05–$1.55 / mile
Maintenance costs multiply 3-9x versus year one. Downtime frequency rises. Fuel efficiency drops around half an MPG per year. Depreciation is nearly zero — but net operating cost has already exceeded the annualized cost of a replacement. Every mile driven past this point is destroying capital.
Replace before this zone
The Break-Even Math — When to Replace Instead of Repair
The financial break-even test is straightforward: when the annual cost of keeping the vehicle exceeds the annualized cost of a replacement, the vehicle should be replaced. Most fleets never run this calculation because the inputs live in five different systems and reconciling them monthly is a full-time job. The math itself is simple.
Keep the vehicle one more year
Projected maintenance + downtime + fuel-drift penalty + insurance escalation
$28,400
Replace with new equivalent
Annualized acquisition + financing + Y1 depreciation + Y1 maintenance
$21,200
Break-even signal
Keep cost exceeds replacement cost by 34% — replacement decision is financially defensible
Replace
Sample calculation for a 7-year-old Class 6 delivery truck at 180,000 miles. Actual numbers depend on your fleet's cost baseline, financing terms, and duty cycle. Oxmaint runs this calculation per vehicle from live cost data and flags break-even 8 months in advance on average.
Own vs Lease — 5-Year TCO Comparison
The own vs lease decision is routinely made on the wrong inputs. Lease payments are visible and predictable. Ownership costs are distributed, often untracked, and systematically underestimated. The correct comparison requires an apples-to-apples TCO calculation that includes residual value capture of ownership, the flexibility cost of lease restrictions, and the maintenance cost differential between new leased vehicles and older owned vehicles.
| TCO Component (5 years, 100,000 mi/yr) |
Own (Purchase / Finance) |
Full-Service Lease |
Cash Purchase Outright |
| Acquisition / Down payment |
$33,000 down + finance |
$4,500 first + last month |
$165,000 upfront |
| Monthly payment (60 mo) |
$2,650 / mo — principal + interest |
$2,400 / mo — all-in lease |
None — opportunity cost applies |
| Maintenance ownership |
Fleet responsibility — full risk |
Included in lease terms |
Fleet responsibility — full risk |
| Residual value at year 5 |
$41,000 capture — asset owned |
$0 — lease returned to lessor |
$41,000 capture — asset owned |
| Downtime absorption |
Full fleet cost |
Loaner provided under many programs |
Full fleet cost |
| Balance sheet impact |
Asset + liability recorded |
Operating expense — off balance sheet |
Asset only — cash reduced |
| Cost per mile — 5 year lifetime |
$0.62 / mile average |
$0.54 / mile average |
$0.58 / mile average |
Illustrative Class 8 truck comparison. Actual numbers depend on your negotiated finance terms, lease structure, fuel price, and internal maintenance cost per mile. The key insight is that the cheapest option changes based on the fleet's maintenance capability — fleets with strong in-house maintenance and high asset utilization typically win on ownership; fleets with limited maintenance infrastructure typically win on lease.
CFO-Grade TCO Reporting
Stop Making Replacement Decisions From Repair Bill Emotion — Start Making Them From Live TCO Data
Oxmaint's per-vehicle TCO dashboard aggregates fuel, work orders, parts, depreciation, financing, and downtime automatically — so every replacement, acquisition, and route-assignment decision is anchored to a defensible number your CFO trusts.
What Oxmaint Automates for Fleet TCO Analysis
TCO fails not because the math is hard, but because the inputs live in five disconnected systems: fuel data in card portals, work orders in shop software, depreciation in accounting spreadsheets, downtime in dispatch logs, and financing in the finance team's models. Oxmaint consolidates all five into a single asset record — so per-vehicle TCO is a live column on your fleet dashboard, not a quarterly reconciliation project.
01
Live Per-Vehicle Cost Per Mile
Fuel transactions, work order costs, parts invoices, and downtime hours roll up to the asset record automatically. Per-vehicle CPM refreshes every 24 hours. No spreadsheet exports. No quarterly reconciliation. Compare any two vehicles side by side by CPM, by month, or by cost category in under 30 seconds.
CPM as a live dashboard column, not a report
02
Break-Even Replacement Alerts
Oxmaint projects each vehicle's next-12-month cost against the annualized cost of a replacement — and flags the vehicle 6-8 months before keeping it becomes more expensive than replacing it. Replacement CapEx requests to the CFO come with the supporting TCO trajectory attached, not a repair invoice complaint.
Replacement timing driven by cost trajectory
03
Cost Category Trend Analysis
Every cost category is tracked per vehicle over time — so a rising fuel cost per mile is caught as fuel efficiency drift, a rising maintenance cost per mile is caught as component wear escalation, and rising downtime per month is caught as reliability decline. Trend signals surface before annual budget review reveals the damage.
Trend detection before quarterly reviews
04
CFO-Ready Fleet P&L Reports
Vehicle-level lifetime P&L reports show acquisition cost, all operating costs by category, current residual value, and net TCO to date. At disposal, the report closes with the actual proceeds captured — the definitive record of whether the acquisition decision delivered the return the fleet planned for.
Board-grade reporting from live operating data
Frequently Asked Questions
How often should TCO be recalculated per vehicle?+
TCO should update continuously as new fuel, work order, and depreciation data arrives — not quarterly or annually. Monthly reviews are the minimum. Fleets running fixed annual snapshots miss trend signals that appear well before the next review cycle.
Start a free Oxmaint trial to see live per-vehicle CPM.
What is the biggest mistake fleets make with TCO?+
Omitting downtime cost. Ryder / KPMG research shows 41% of fleets report $0 for downtime, roadside, and administrative overhead — the categories most likely to be hidden. TCO calculated without these runs 25-40% below reality and produces replacement decisions that are consistently late.
Should cost of capital be included for cash-purchased vehicles?+
Yes. The opportunity cost of capital tied up in a depreciating asset is real, even without a finance company charging interest. Applying the fleet's weighted average cost of capital (typically 6-10%) to the vehicle's book value produces the correct comparison figure for lease-versus-buy analysis.
How does Oxmaint pull in data from fuel cards and finance systems?+
Oxmaint integrates with major fuel card providers, telematics platforms, and accounting systems through API and file-based imports. Fuel transactions attach to the vehicle by card ID, work orders attach through vehicle ID, and depreciation schedules load from accounting exports.
Book a demo to see the integration architecture.
Is cost per mile or annual TCO the better metric?+
Both — for different purposes. Annual TCO is what goes into the budget. Cost per mile is what drives decisions: which vehicle to keep, which to replace, which route to assign to which asset. Fleets tracking only annual TCO make budget requests correctly but operational decisions poorly.
Fleet TCO Intelligence — Powered by Oxmaint
Every Cost Category. Every Vehicle. Every Day. Turn TCO From a Quarterly Report Into a Live Operating Decision.
Live per-vehicle cost per mile, break-even replacement alerts, cost category trend detection, CFO-grade lifetime P&L reports, and integrated fuel, maintenance, and financing data — the TCO stack that makes replacement decisions financially defensible instead of politically driven.
$2.26
Average total cost per mile — US fleet benchmark 2024
35-45%
Hidden cost load missed by conventional cost tracking
6-8 mo
Advance warning Oxmaint provides before break-even
20-35%
CPM reduction achieved by fleets running live TCO tracking