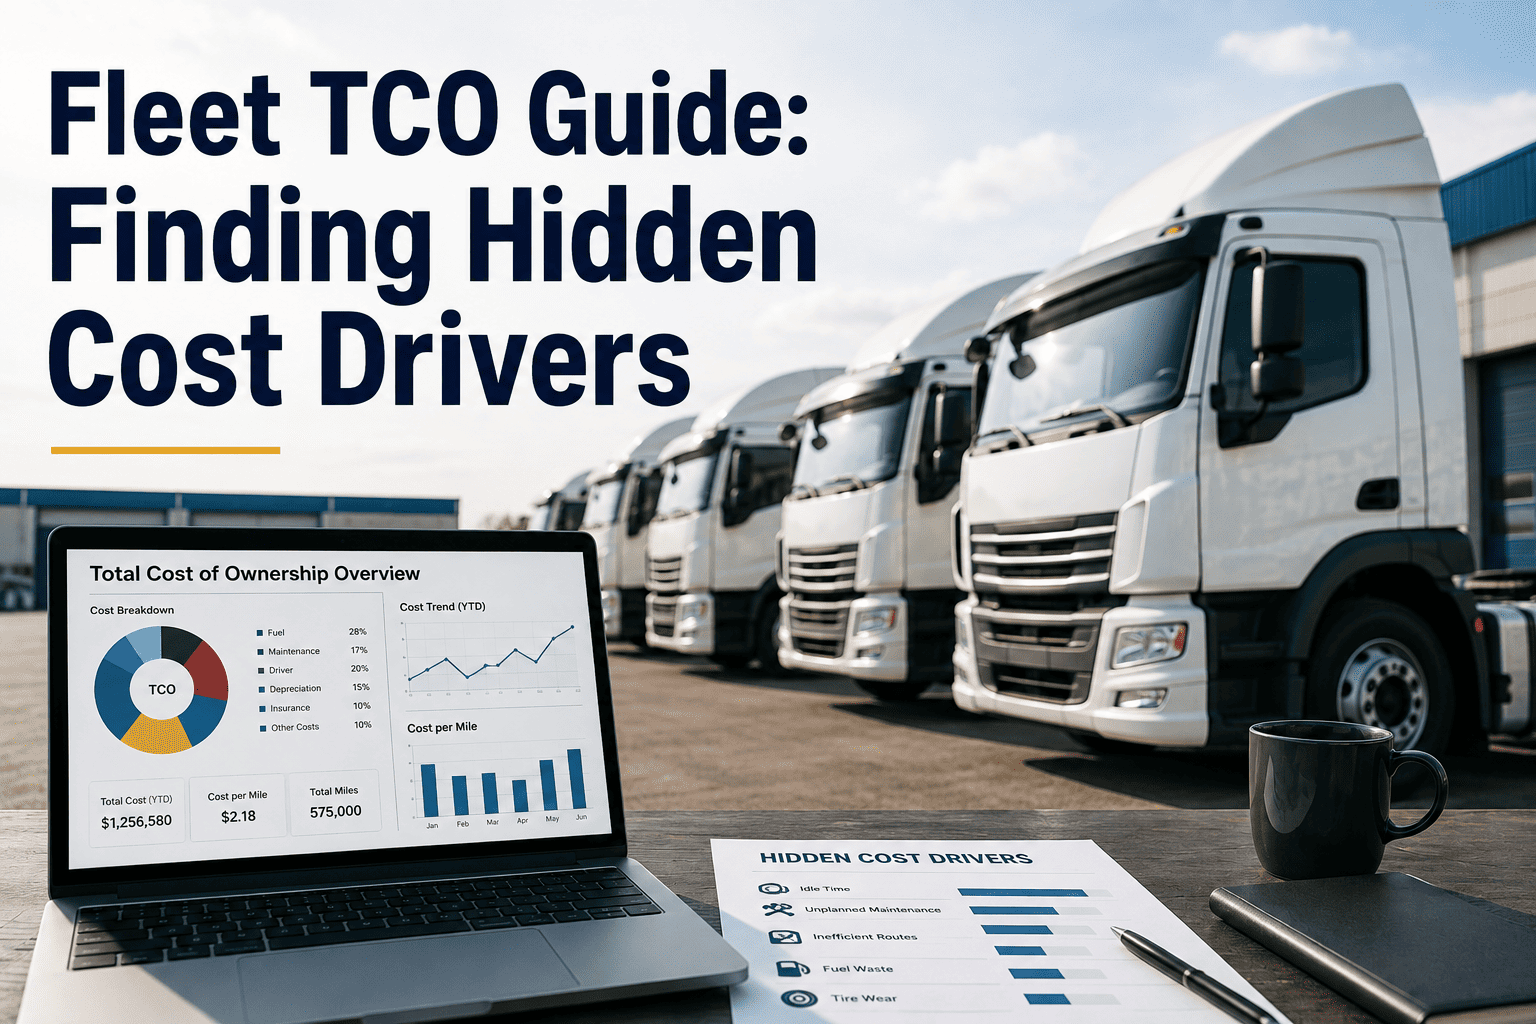
Fleet total cost of ownership reports show fuel, financing, and scheduled maintenance because those are the line items that arrive on a monthly invoice. What they routinely miss is the cost sitting between the invoices — a transmission that fails two years early because a fluid interval was quietly extended, a vehicle sold at auction six months past its optimal resale window, a driver behavior pattern adding thousands in brake wear across a fleet nobody is tracking per vehicle. A fleet manager reviewing cost against a textbook TCO model can be underestimating true lifecycle cost by 20 to 30 percent, because the model captures scheduled cost and misses everything that only shows up when something breaks, depreciates faster than expected, or gets driven the wrong way. Finding these hidden cost drivers means looking inside the ownership lifecycle stage by stage, not at one blended cost-per-mile number. Book a demo to see the hidden cost drivers inside your own fleet's TCO.
Oxmaint tracks the cost categories standard TCO reports miss — unplanned downtime, warranty leakage, deadhead fuel waste, driver-pattern wear, and residual value erosion — attributed to the specific vehicle, system, and root cause driving each one.
Fleet total cost of ownership includes five cost categories most reports never isolate: unplanned downtime, warranty and parts leakage, deadhead and idle fuel waste, driver-behavior-driven wear, and residual value erosion from missed disposal timing. Together these hidden drivers typically add 20 to 30 percent to a vehicle's visible ownership cost — invisible on a fleet-average dashboard because they sit buried inside broader line items like "maintenance" or "fuel" rather than tracked per vehicle and per cause. Oxmaint's TCO analytics isolate each driver per asset, calculate its dollar impact, and rank vehicles by total hidden cost exposure so budget owners can act on the highest-cost problems first.
The Five Cost Categories Your TCO Report Doesn't Show
Every one of these five categories exists inside your current numbers already — they are just distributed across other line items instead of being isolated and attributed to a cause. Once they are separated out, they usually turn out to be the largest controllable share of ownership cost, and the easiest one for a finance team to act on once it has a name and a dollar figure attached.
An unplanned repair costs more than the part and labor line on the invoice. It carries a rush-parts premium, overtime labor, a rental or backup vehicle, and the missed jobs or routes the vehicle should have covered that day. Fleets that track only the repair invoice miss the second and third-order cost entirely — which is usually larger than the repair itself. A component that fails on the road also tends to fail in a way a scheduled replacement never would, taking adjacent parts down with it and turning a routine job into a much larger one.
Component and manufacturer warranties lapse quietly when claim windows aren't tracked against mileage and in-service date at the individual part level. Fleets routinely pay full price for a repair that was still covered, simply because nobody flagged the eligibility window before the work order was closed. Multiply that across a hundred-vehicle fleet and the leak becomes one of the largest preventable line items nobody has a name for.
Fuel spend is visible on every report, but the split between productive miles and empty return legs or excess idle time rarely is. A vehicle burning 18% of its fuel budget on deadhead miles and idle time looks identical to an efficient one on a total-spend dashboard — until the two are separated per vehicle. Route and zone rebalancing usually closes most of this gap without adding a single mile of new infrastructure.
Harsh braking and hard acceleration wear brakes, tires, and drivetrain components faster than mileage alone predicts. Two identical vehicles covering identical mileage can have replacement intervals 30% apart depending on driving pattern — a difference that a mileage-based maintenance schedule never accounts for. Coaching the highest-event drivers is usually the fastest and cheapest fix on this entire list.
Every vehicle has a point on its depreciation curve where holding it another year costs more in maintenance and value loss than replacing it would. Fleets without a disposal-timing signal routinely hold vehicles 6 to 12 months past that point, absorbing both extra repair cost and a steeper resale discount at the same time. The longer a vehicle sits past that point, the harder both numbers are to recover.
Know Which Hidden Cost Is Actually Draining Your Budget — Not Just That Costs Are High
Oxmaint attributes every dollar of hidden cost to a specific vehicle, system, and cause — so the budget conversation starts with a ranked list of what to fix first, not a guess.
Where Hidden Costs Enter the Ownership Lifecycle
Hidden cost doesn't appear at one point in a vehicle's life — it accumulates at four distinct stages, and each stage has a different root cause and a different fix. Treating hidden cost as one problem to solve at once usually fails, because the fix for a spec-mismatch problem at acquisition looks nothing like the fix for a disposal-timing problem years later.
A vehicle specced below its actual duty cycle — underpowered for the load, wrong axle ratio for the terrain, undersized brakes for stop-and-go routes — wears out its major components early. The saving at purchase becomes a multiple of that saving in accelerated repair cost across the ownership period, and it usually isn't discovered until the second or third year of ownership, when the wear pattern is already established.
Deadhead miles, excess idle time, and harsh driving events accumulate silently during day-to-day operation. None of them appear as a separate cost line — they simply raise fuel spend and shorten component life in ways that only show up months later as an unplanned repair, long after the driving pattern that caused it has been forgotten.
A skipped or extended PM interval is the single largest driver of unplanned downtime, and it's also where warranty-eligible repairs most often get paid for out of pocket because the connection between a deferred service and a warranty claim window is never made. One missed interval can cascade into a failure that touches two or three adjacent systems at once.
Without a signal for when a vehicle has crossed its optimal disposal point, fleets default to holding assets until they visibly fail — paying rising repair cost and a falling resale price in the same window, instead of exiting at the point where both curves cross. By the time the decision is obvious, most of the recoverable value is already gone.
Visible Cost vs Hidden Cost — Side by Side
The same dollar often exists on your report today — it's just filed under a category broad enough to hide where it actually came from. Splitting each category out doesn't require a new data source, only a different way of attributing the numbers that already exist in your maintenance and telematics systems.
| Cost Category | Where It Shows on a Standard Report | Where It Actually Lives | Typical Hidden Amount |
|---|---|---|---|
| Unplanned downtime | Filed under "repairs," blended with scheduled work | Rush parts, overtime labor, backup vehicle, missed jobs | $1,850 / event |
| Warranty leakage | Filed as a normal paid repair invoice | Claim window that lapsed unnoticed at the part level | 8–14% of repairs |
| Deadhead & idle fuel | Blended into total fuel spend per vehicle | Non-revenue miles and idle hours no one separated out | 12–20% of fuel |
| Driver-behavior wear | Filed as routine brake and tire replacement | Harsh-event pattern shortening intervals per driver | 25–35% faster wear |
| Residual erosion | Filed as a normal disposal sale price | Months held past the optimal resale point | $2,600–$5,400 / vehicle |
TCO Visibility Dashboard — What Oxmaint Tracks
Most fleets already collect the raw data behind every one of these numbers — maintenance history, telematics feeds, warranty terms, and resale comps. What's missing is the layer that connects them to a single vehicle and a single cause, and that layer is what turns raw data into a decision.
Six metrics tracked per vehicle, updated continuously from maintenance, telematics, and warranty data — the numbers that turn five hidden categories into one ranked action list, ordered by dollar impact rather than by which report they happened to land on.
Results at Fleets Using Oxmaint TCO Analytics
These figures come from fleets that started exactly where most readers of this page are starting — with a cost-per-mile number that kept climbing and no clear way to see which of the five categories was driving it.
We had a TCO model in a spreadsheet for years and it always told us the same story — costs were rising, and nobody could say exactly why. The Oxmaint breakdown showed us that 60% of our unplanned repairs traced back to nine vehicles with the same deferred PM pattern, and that we were holding trucks four to six months past the point where resale value made sense. Fixing both added up to more than we expected, and it changed how we build next year's replacement plan. It also changed the conversation with our board, because for the first time we could show exactly where the money was going instead of just that it was rising.
Frequently Asked Questions
The questions below come up in almost every first conversation about hidden fleet cost — mostly around how confident the numbers are and how quickly they become usable.
Stop Guessing Where Your Fleet Budget Is Leaking. Find the Hidden 20–30%.
Per-vehicle hidden cost attribution, warranty leakage alerts, deadhead tracking, and disposal-timing signals — all in one TCO dashboard, live from your maintenance and telematics data.