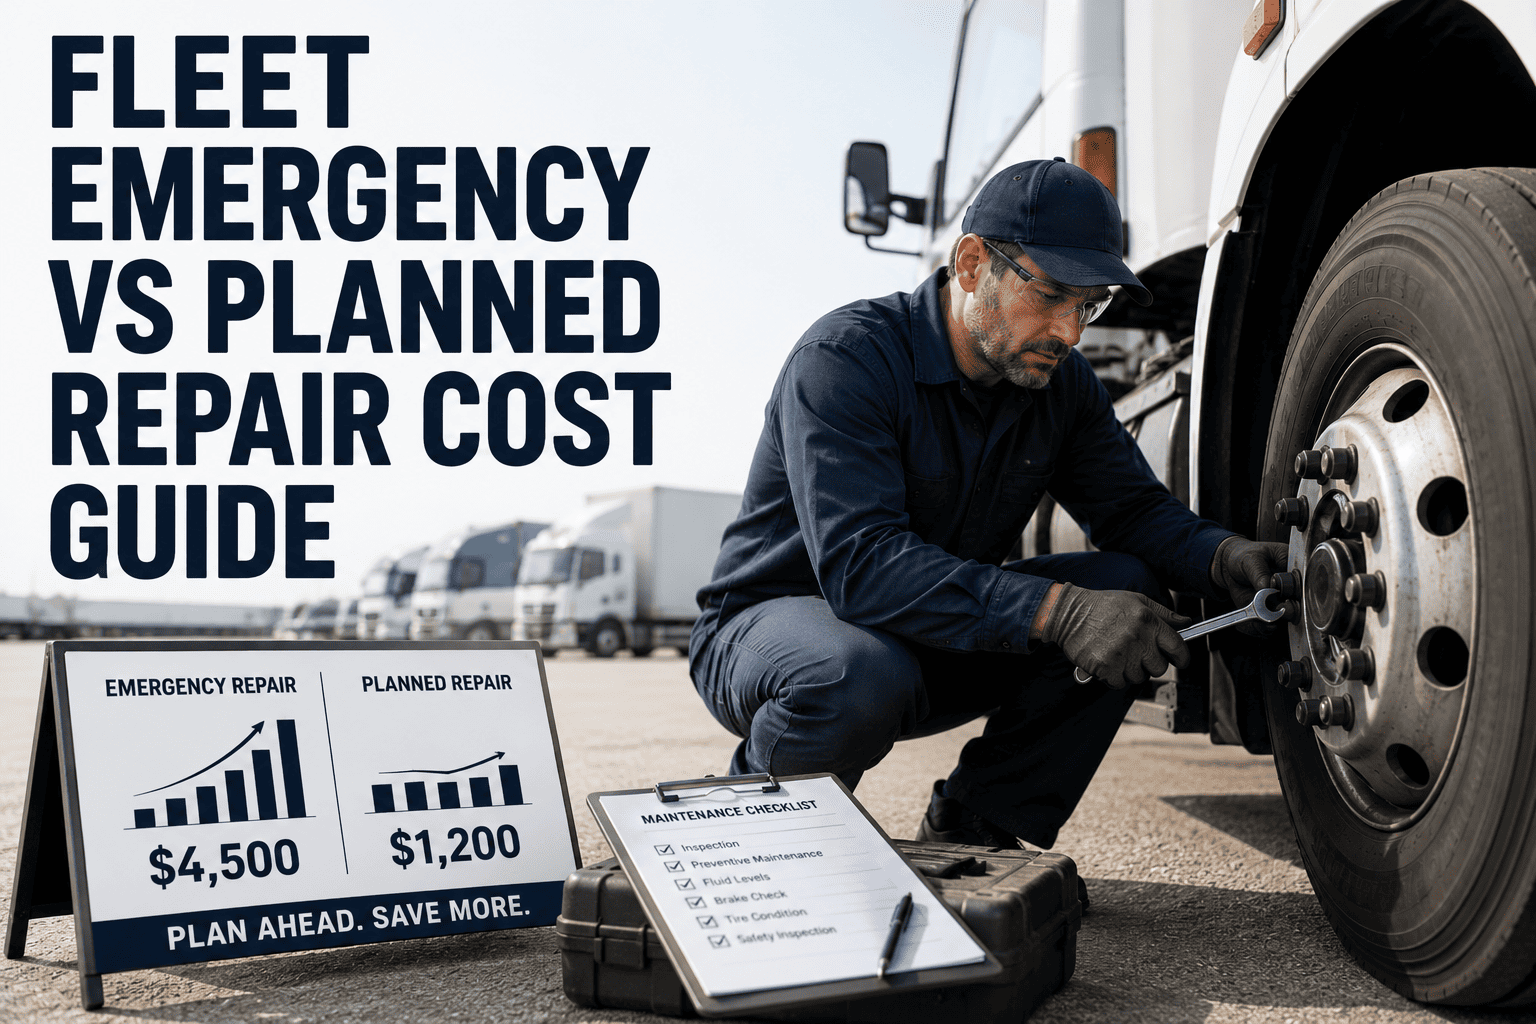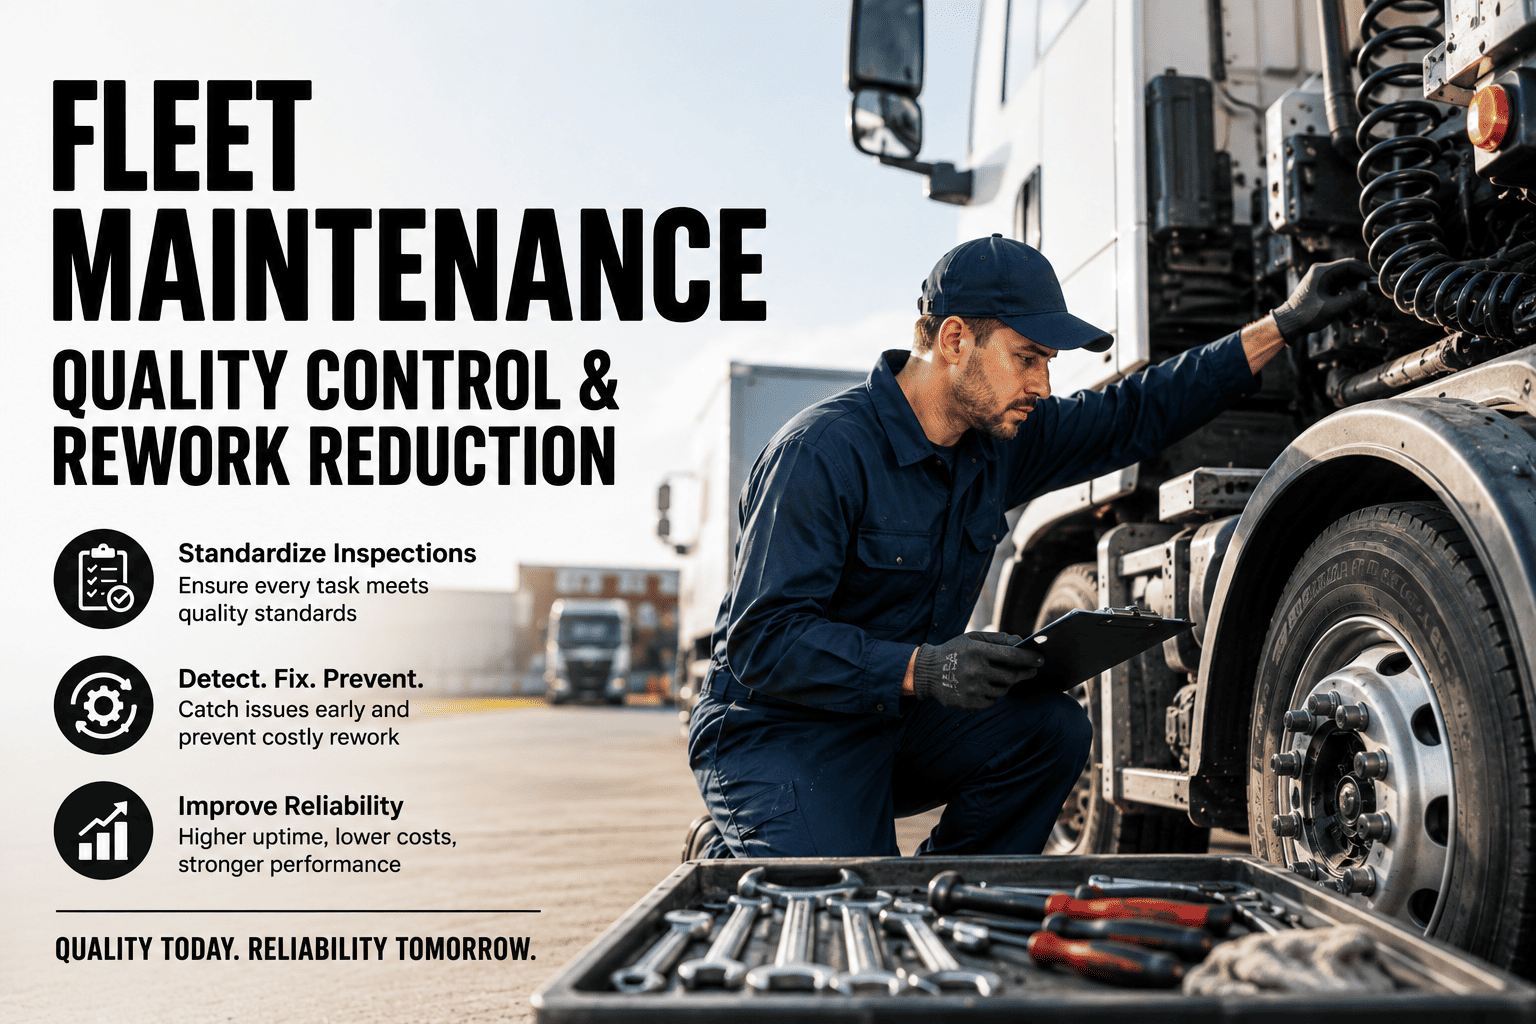
Fleet maintenance quality control is the discipline that decides whether a repair stays fixed — or comes back as a costly rework job that doubles labor, burns parts, and erodes driver trust. Industry data consistently shows that 8–15% of fleet work orders become comebacks within 30 days, and each rework event typically costs 2–3x the original repair once you count repeat diagnostics, second parts pulls, and vehicle downtime. This guide breaks down how to build a fleet maintenance quality control program that measurably reduces rework: QC workflow integration, verification tracking, root-cause analysis, and the CMMS structure that turns quality from a hope into a number. If your shop is still tracking comebacks on whiteboards or in a supervisor's memory, a platform like OxMaint makes the whole system enforceable — Start Free Trial and see your first rework metrics within a week.
What if every repair your fleet shop closed actually stayed closed?
A comeback is never "just one more job." It is double the labor, a second bay slot, a stranded driver, and a quiet vote of no-confidence in your maintenance program. Shops with a formal QC workflow hold rework under 3%. Shops without one often don't even know their number.
Why fleet maintenance rework is your most expensive hidden line item
Most fleet budgets never show rework as its own line — it hides inside "labor," "parts," and "downtime." Unhide it, and the case for fleet repair quality control writes itself.
A 120-vehicle regional distribution fleet closes about 400 work orders a month. At a 10% comeback rate, that is 40 rework events — roughly $24,000/month in repeat labor, duplicate parts and extra downtime. Cutting rework to 3% recovers about $16,800/month, or $200K+ per year, before counting the driver-hours saved. That is the entire business case for maintenance quality control in a fleet shop.
The 5 root causes behind most fleet repair rework
You cannot reduce fleet maintenance rework by telling technicians to "be more careful." Rework is a process output. Fix the process inputs and the comeback rate falls on its own.
Incomplete diagnosis
The technician treats the symptom — replaces the part that failed — without finding why it failed. The new part fails the same way within weeks. Structured diagnostic checklists on the work order force the "why" before the wrench turns.
No post-repair verification
The job closes when the last bolt is torqued, not when the repair is proven. A road test, a loaded-system check, or a supervisor sign-off catches the 1-in-10 miss before the vehicle leaves the bay.
Wrong or substandard parts
Will-fit substitutions and unverified aftermarket parts are a quiet rework engine. Linking parts to asset history in your CMMS reveals which part numbers keep coming back on the same vehicles.
Rushed closeouts under schedule pressure
When dispatch is waiting, documentation and final checks are the first things skipped. Digital closeout steps that cannot be bypassed protect quality exactly when pressure is highest.
No feedback loop to the technician
If a comeback gets reassigned silently, the original tech never learns. Rework attribution — handled constructively — is the single fastest driver of first-time-fix improvement.
How to build a fleet maintenance QC workflow in 4 stages
Effective quality control in fleet maintenance is not an inspection at the end — it is checkpoints woven through the entire work order lifecycle. Here is the structure that gets shops under 3% rework.
Standardize the complaint
Driver or operator reports feed a structured intake: symptom, conditions, fault codes, photos. Vague "brakes feel funny" reports become diagnosable data before a bay is even assigned.
Guided diagnostics and procedures
The work order carries asset history, prior comebacks, torque specs and step checklists. Technicians see that this vehicle had the same code 6 weeks ago — the root-cause clue that memory alone would lose.
Mandatory post-repair verification
Road test results, system pressures, leak-down or regen confirmation — recorded against the work order, with a second sign-off for safety-critical systems (brakes, steering, tires). No verification, no closure.
Comeback capture and root-cause review
Any repeat work order within 30 days is auto-flagged as rework, linked to the original job, and queued for a weekly 15-minute root-cause review: diagnosis miss, part failure, procedure gap, or verification skip.
The KPIs that prove your fleet quality control program is working
What gets measured gets fixed. These five metrics turn fleet maintenance quality from an opinion into a dashboard — and every one of them is trackable inside OxMaint.
| KPI | How to calculate | Good target | What it exposes |
|---|---|---|---|
| Rework / comeback rate | Repeat WOs within 30 days ÷ total WOs | <3% | Overall QC effectiveness |
| First-time-fix rate | WOs closed with no return ÷ total WOs | >95% | Diagnostic quality |
| Verification completion | WOs with signed verification ÷ WOs requiring it | 100% | Process discipline |
| Rework cost per vehicle / month | Total rework labor + parts ÷ fleet size | Trend ↓ 20%/qtr | Financial impact of QC |
| Repeat-failure assets | Assets with 2+ comebacks in 90 days | 0 chronic units | Replacement candidates, lemon parts |
"We thought our comeback rate was around 5%. Once OxMaint started auto-flagging repeat work orders, the real number was 12%. You can't fix what you refuse to count — six months later we were under 3% and our drivers actually trust the shop again."
Fleet Maintenance Manager, 85-vehicle municipal fleet · 5/5How OxMaint turns fleet rework reduction into a system, not a slogan
QC discipline fails when it depends on memory, paper and goodwill. OxMaint's AI-powered CMMS builds the checkpoints into the work order itself — so quality control happens even on your busiest day.
Enforced QC checklists on every work order
Diagnostic steps, torque specs and post-repair verification are embedded in the digital work order and cannot be skipped. Result: verification completion goes from "when we remember" to 100% — the single biggest lever on comeback rate.
Automatic comeback detection and rework analytics
OxMaint links repeat work orders to the original job and technician, then dashboards your rework rate, first-time-fix percentage and rework cost per vehicle. Fleets typically surface 2–3x more rework than they thought they had — then cut it below 3%.
Full asset and parts history at the point of repair
Technicians see every prior repair, fault code and part number on that vehicle before they start. Repeat-failure patterns and problem part numbers become visible — ending the cycle of replacing the same component on the same unit every quarter.
Audit-ready records for compliance and warranty
Every verification, sign-off and root-cause note is timestamped and retrievable in seconds — protecting you in FMCSA audits, warranty claims and liability disputes, and proving PM and repair quality without a paper chase.
See your real rework number — book a 30-minute demo
We will show you exactly how OxMaint flags comebacks, enforces verification, and dashboards first-time-fix for a fleet like yours. Most shops find the payback inside the first month.
Fleet maintenance quality control: frequently asked questions
What is a good rework or comeback rate for a fleet maintenance shop?
Best-in-class fleets hold rework under 3% of closed work orders; 3–5% is acceptable, and anything above 8% signals a systemic quality problem. The first step is measuring it honestly — most shops without automated tracking underestimate their true comeback rate by half or more.
How do I reduce comebacks in my fleet shop?
Start with three moves: enforce a post-repair verification step on every work order, auto-flag any repeat repair within 30 days as rework, and run a short weekly root-cause review on those flags. A CMMS like OxMaint automates all three — Start Free Trial to see the workflow on your own work orders.
What causes most fleet repair rework?
Incomplete diagnosis is the leading cause — treating the failed part instead of the reason it failed — followed by skipped verification, wrong or substandard parts, rushed closeouts, and the absence of any feedback loop to the technician. All five are process failures, which means all five are fixable with structure.
How much does fleet rework actually cost?
A single comeback typically costs 2–3x the original repair — commonly $450–$900 for a medium-duty vehicle once you add repeat labor, duplicate parts, bay time and lost vehicle availability. A 120-vehicle fleet at a 10% comeback rate can easily lose $200K+ per year to rework alone.
Can a CMMS really improve repair quality, or just track it?
Both — and the tracking is what enables the improving. OxMaint embeds mandatory checklists and verification sign-offs into the work order itself, so the QC step cannot be skipped under schedule pressure. Then its analytics show which assets, parts and procedures drive your comebacks. Book a Demo and we will walk through it on your fleet's data.
Fix it once. Prove it. Measure it.
Put fleet maintenance quality control on autopilot with OxMaint — enforced verification, automatic comeback detection, and rework analytics your whole team can see.
Free 14-day trial · No credit card · Set up in an afternoon