Cost per mile (CPM) is the single most critical metric for any fleet operation — it tells you exactly what it costs to move one vehicle one mile, capturing fuel, labor, maintenance, and overhead in one defensible number. For fleet managers and finance leaders, reducing fleet cost per mile is the difference between a profitable operation and one quietly bleeding cash through reactive maintenance, untracked downtime, and inflated vendor invoices. The specific operating levers that actually move CPM down are labor, parts, fuel, downtime, and vendor spend — each measurable and controllable with the right systems in place. OxMaint CMMS software gives fleet operations leaders the vehicle-level cost tracking, driver-level attribution, and benchmark reporting needed to execute a fleet cost per mile strategy that turns CPM from a lagging scoreboard number into a managed operational KPI. You can Start Free Trial today or keep reading for the exact levers that drive CPM reduction.
What would a $0.12 drop in cost per mile mean for your fleet this year?
For a 200-truck fleet running 110,000 miles per vehicle annually, shaving just twelve cents off your fleet cost per mile adds up to $2.64 million in recovered operating margin. That is not a theoretical number — it is the exact output of targeted CPM reduction across labor, parts, fuel, downtime, and vendor spend.
Cost Per Mile Levers Ranked by Impact and Effort
Not every cost per mile lever delivers equal return. Based on aggregate fleet maintenance data, these five operating cost per mile drivers are ranked by their measurable impact on CPM — and the effort required to control them. Fleet cost per mile optimization starts by attacking the highest-impact, lowest-effort levers first.
Unplanned Downtime & Preventive Maintenance
Impact: High · Effort: MediumA single unplanned roadside failure costs $500–$1,200 in towing, lost revenue, and emergency repair markups. Fleets that shift from reactive to preventive maintenance using a CMMS typically reduce unplanned downtime by 30–50%. Controlling this lever means scheduling PMs based on actual mileage, engine hours, or condition data — not a calendar guess.
Spare Parts Inventory & Procurement
Impact: High · Effort: MediumOverstocked parts tie up $40K–$120K in dead capital per 100 vehicles. Understocked parts cause downtime. Tracking parts consumption at the asset level and linking purchase orders to work orders eliminates both problems, driving measurable cost per mile improvement through reduced carrying costs and fewer expedited shipping fees.
Labor Utilization & Technician Productivity
Impact: Medium · Effort: HighUnbillable labor hours — searching for parts, waiting for approvals, rekeying paper work orders — consume 20–30% of a technician's shift. Digital work orders with built-in parts catalogs and approval workflows recover 4–6 productive hours per tech per week, directly lowering the labor component of fleet operating cost per mile.
Vendor Spend & Outside Repair Control
Impact: Medium · Effort: LowOutside vendor invoices are where margin leaks invisibly. Without work-order-level approval and benchmarking, fleets routinely overpay 12–18% on outsourced repairs. Centralizing vendor management with pre-approved labor rates and scoped repair limits immediately tightens cost per mile control.
Fuel Consumption & Maintenance-Related Efficiency
Impact: Variable · Effort: LowFuel is 30–40% of total CPM, and maintenance directly affects it. Under-inflated tires, clogged filters, and overdue oil changes can increase fuel consumption by 3–6%. While fuel price is uncontrollable, maintenance-triggered fuel efficiency is fully manageable — making PM compliance a fuel strategy, not just a repair strategy.
How to Calculate and Benchmark Fleet Cost Per Mile
You cannot reduce what you do not measure with precision. The formula for cost per mile is simple, but the data collection behind it is where most fleets fail — relying on spreadsheets, disconnected fuel cards, and paper work orders that make true vehicle-level attribution impossible.
CPM Reduction Strategy: A Month-by-Month Timeline
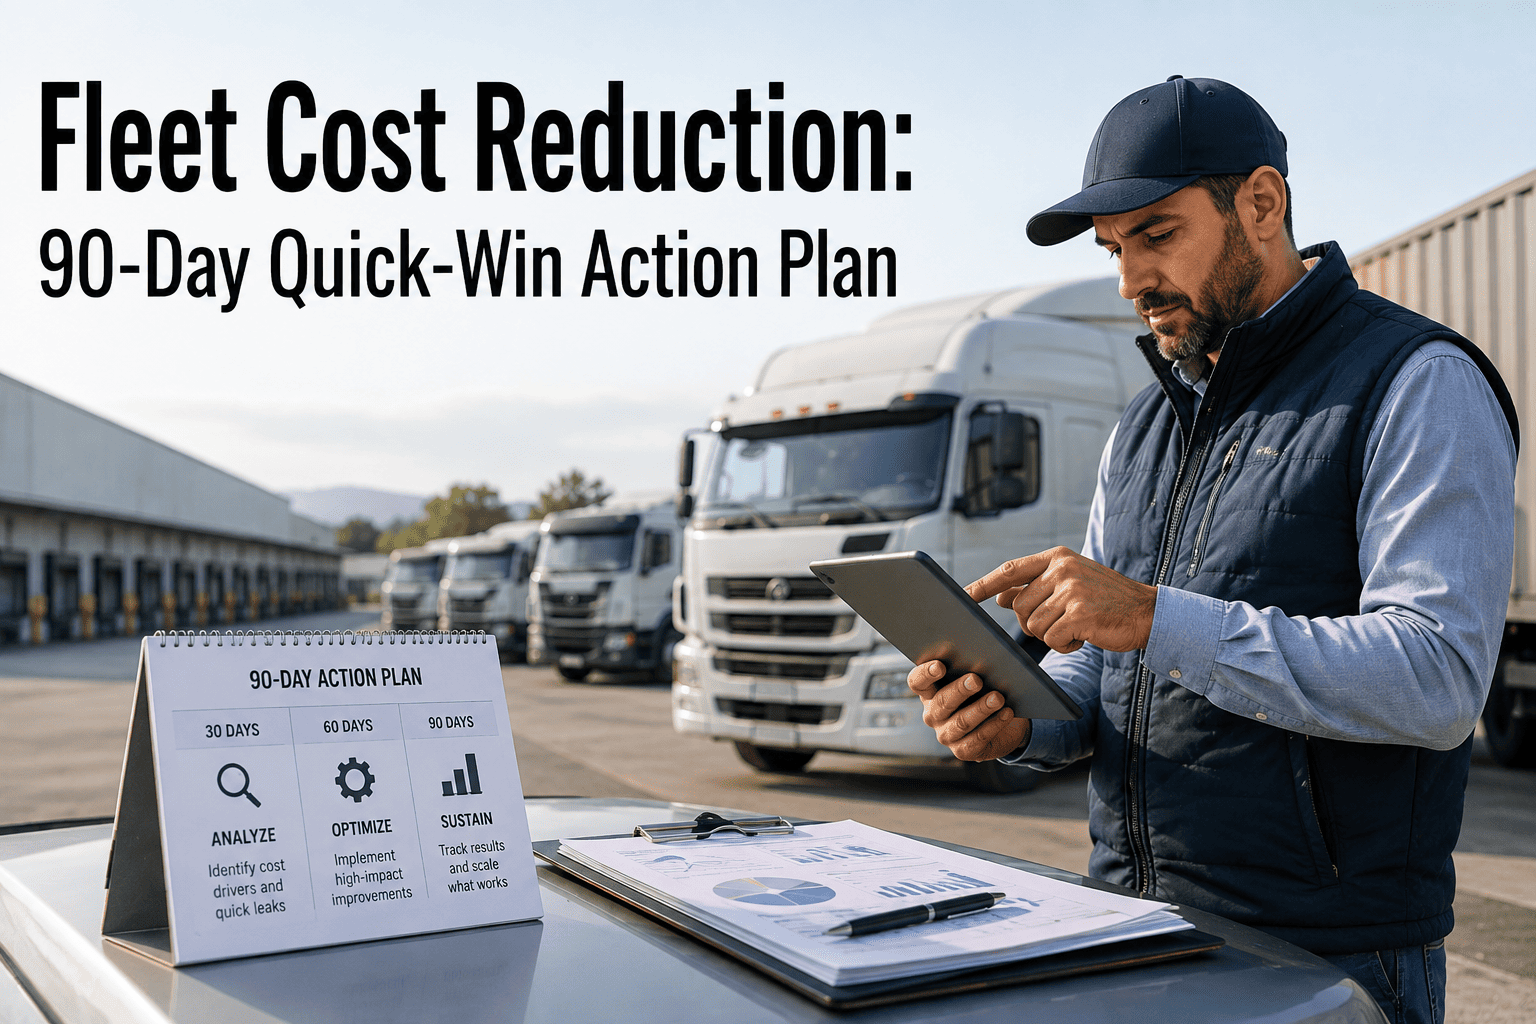
A structured cost per mile improvement program does not happen overnight. Here is a realistic 6-month rollout for a mid-size fleet transitioning from spreadsheet-based maintenance to a CMMS-driven CPM reduction strategy.
Baseline CPM & Asset Registry Cleanup
Import all vehicles, engine hours, and odometer readings into OxMaint. Establish the current true CPM by asset class. Identify the 20% of vehicles consuming 80% of repair spend — the rogue assets dragging your average up.
Digitize Work Orders & PM Schedules
Eliminate paper work orders. Build preventive maintenance triggers based on mileage and engine hours. Every repair now has a digital record linked to a specific asset, technician, and parts issue — creating the data trail needed for defensible CPM reporting.
Parts Inventory & Vendor Controls
Activate spare-parts tracking with min/max reorder points. Set pre-approved vendor labor rates and scope-of-repair limits. Within 30 days, carrying costs drop and unauthorized vendor markups are flagged automatically.
Predictive Analytics Activation
With 90 days of clean data, OxMaint's AI begins flagging failure patterns — specific asset models, routes, or operating conditions that correlate with breakdowns. Shift from time-based PM to condition-based maintenance where the data supports it.
Driver-Level & Route-Level Attribution
Tie fuel consumption and hard-braking events to specific drivers. Identify training opportunities that reduce fuel-wasting behaviors. The fleet that can attribute cost to the driver level can coach it down — typically recovering 2–4% in fuel efficiency.
Benchmark Reporting & CPM Lock-In
Generate the first full quarterly CPM benchmark report by asset class, route, and driver. Most fleets see a $0.06–$0.14 reduction in cost per mile by this point. The CMMS analytics now make CPM a managed KPI — not a number discovered at year-end.
What CPM Reduction Looks Like for a 180-Vehicle Fleet
A regional logistics fleet operating 180 tractors was spending $0.74 per mile — 8 cents above their target benchmark. Their maintenance was reactive, paper-based, and had no vehicle-level cost visibility. Here is what happened when they implemented OxMaint over 12 months.
"The biggest surprise was not the fuel savings — it was discovering that 12 of our 180 tractors were consuming 31% of our total repair budget. OxMaint made that visible in 60 days. We retired the worst offenders and watched CPM drop."
— Director of Fleet Maintenance, 180-vehicle regional carrierHow OxMaint Drives Cost Per Mile Reduction
OxMaint is an AI-powered CMMS and EAM platform built to give maintenance and reliability teams the exact tools needed to control fleet operating cost per mile. Here is how each capability maps directly to a CPM lever — and the measurable outcome it delivers.
Automated Preventive Maintenance Scheduling
Trigger PMs by mileage, engine hours, or condition data — never miss a service interval again. Fleets using OxMaint PM automation cut unplanned downtime by 30–50%, directly reducing the most expensive line item in cost per mile.
Vehicle-Level Cost Tracking & Benchmarking
Every work order, parts issue, and vendor invoice is tied to a specific asset. Generate CPM reports by vehicle, class, route, or driver — and instantly identify the 20% of assets driving 80% of your maintenance cost per mile.
Predictive Maintenance with AI Analytics
OxMaint's AI engine analyzes work order history, fault codes, and usage patterns to predict failures before they happen. Catch a bearing failure at $400 instead of a roadside turbo replacement at $4,200 — the kind of delta that moves CPM measurably.
Spare Parts Inventory & Vendor Management
Track parts stock in real time with automated reorder points. Enforce pre-approved vendor rates and scope-of-repair limits on every outside invoice. Fleets eliminate 40–60% of dead inventory while cutting unauthorized vendor spend by 12–18%.
Where the Dollars Come From: CPM Savings Breakdown by Lever
This table shows the expected annual savings for a 200-vehicle fleet running 22 million miles annually at a baseline CPM of $0.72, implementing OxMaint across all five levers. Your numbers will vary, but the proportions hold across fleet sizes.
| CPM Lever | Mechanism | Annual Savings | CPM Reduction |
|---|---|---|---|
| Downtime & PM Compliance | 30–50% fewer unplanned breakdowns | $420,000 | $0.019/mile |
| Parts Inventory Optimization | Eliminate dead stock, reduce expedites | $185,000 | $0.008/mile |
| Labor Productivity | 4–6 recovered hours per tech/week | $240,000 | $0.011/mile |
| Vendor Spend Control | Pre-approved rates, scope limits | $95,000 | $0.004/mile |
| Fuel Efficiency via Maintenance | PM-triggered 3–6% fuel savings | $310,000 | $0.014/mile |
| Total Annual Savings | All levers activated | $1,250,000 | $0.057/mile |
Stop Guessing at Cost Per Mile — Start Managing It
See how OxMaint turns your maintenance data into a CPM reduction engine. Book a 30-minute demo and we will map your fleet's specific savings opportunities — live, on your own numbers.
Cost Per Mile Reduction: Your Questions Answered
What is a good cost per mile for a fleet?
A good fleet cost per mile depends on vehicle type and duty cycle, but industry benchmarks put a mixed trucking fleet between $0.63 and $0.82 per mile. Top-quartile fleets using a CMMS for preventive maintenance and cost tracking consistently operate in the $0.60–$0.68 range. The key is not hitting a generic number — it is knowing your true CPM at the vehicle level and having the data to push it down. You can Start Free Trial to benchmark your fleet in days.
How do you calculate cost per mile for a fleet?
Cost per mile is calculated by dividing total operating costs — including maintenance labor, parts, fuel, vendor invoices, and overhead — by total miles driven in the same period. The formula is simple; the hard part is capturing every cost at the asset level. Without a CMMS linking work orders, parts issues, and fuel data to specific vehicles, most fleets underestimate their true CPM by 8–15%.
What is the fastest way to reduce fleet CPM?
The fastest CPM reduction comes from two actions: enforcing preventive maintenance compliance to cut unplanned downtime, and setting pre-approved vendor labor rates to eliminate invoice inflation. Both can be implemented in OxMaint within the first 30 days and typically deliver measurable CPM improvement within one quarter. Downtime alone accounts for the largest single-day cost events in fleet operations.
How does a CMMS lower cost per mile?
A CMMS lowers cost per mile by creating the data infrastructure that makes every maintenance cost visible, traceable, and manageable at the vehicle level. It automates PM scheduling to prevent breakdowns, tracks parts inventory to eliminate waste, digitizes work orders to recover labor hours, and provides analytics to identify cost-driving assets. Fleets using a CMMS like OxMaint typically see a $0.06–$0.14 CPM reduction within 12 months. Book a Demo to see the exact workflow on your fleet data.
How long does it take to see CPM reduction after implementing fleet maintenance software?
Most fleets see initial CPM reduction within 60–90 days of implementing OxMaint, driven primarily by PM compliance and vendor controls. The full $0.06–$0.14 per mile reduction typically materializes over 6–12 months as predictive analytics, parts optimization, and driver-level attribution come online. The ROI breakpoint — where cumulative savings exceed software and implementation costs — is usually reached in month 3 to 4 for mid-size fleets.
Your Fleet's CPM Is Higher Than It Needs to Be
Every day without structured cost per mile management is money leaking through unplanned downtime, dead inventory, and uncontrolled vendor spend. OxMaint gives you the system to stop the leak — and the data to prove it. Start your free trial or book a demo to see your fleet's specific savings opportunities.
Free 14-day trial · No credit card