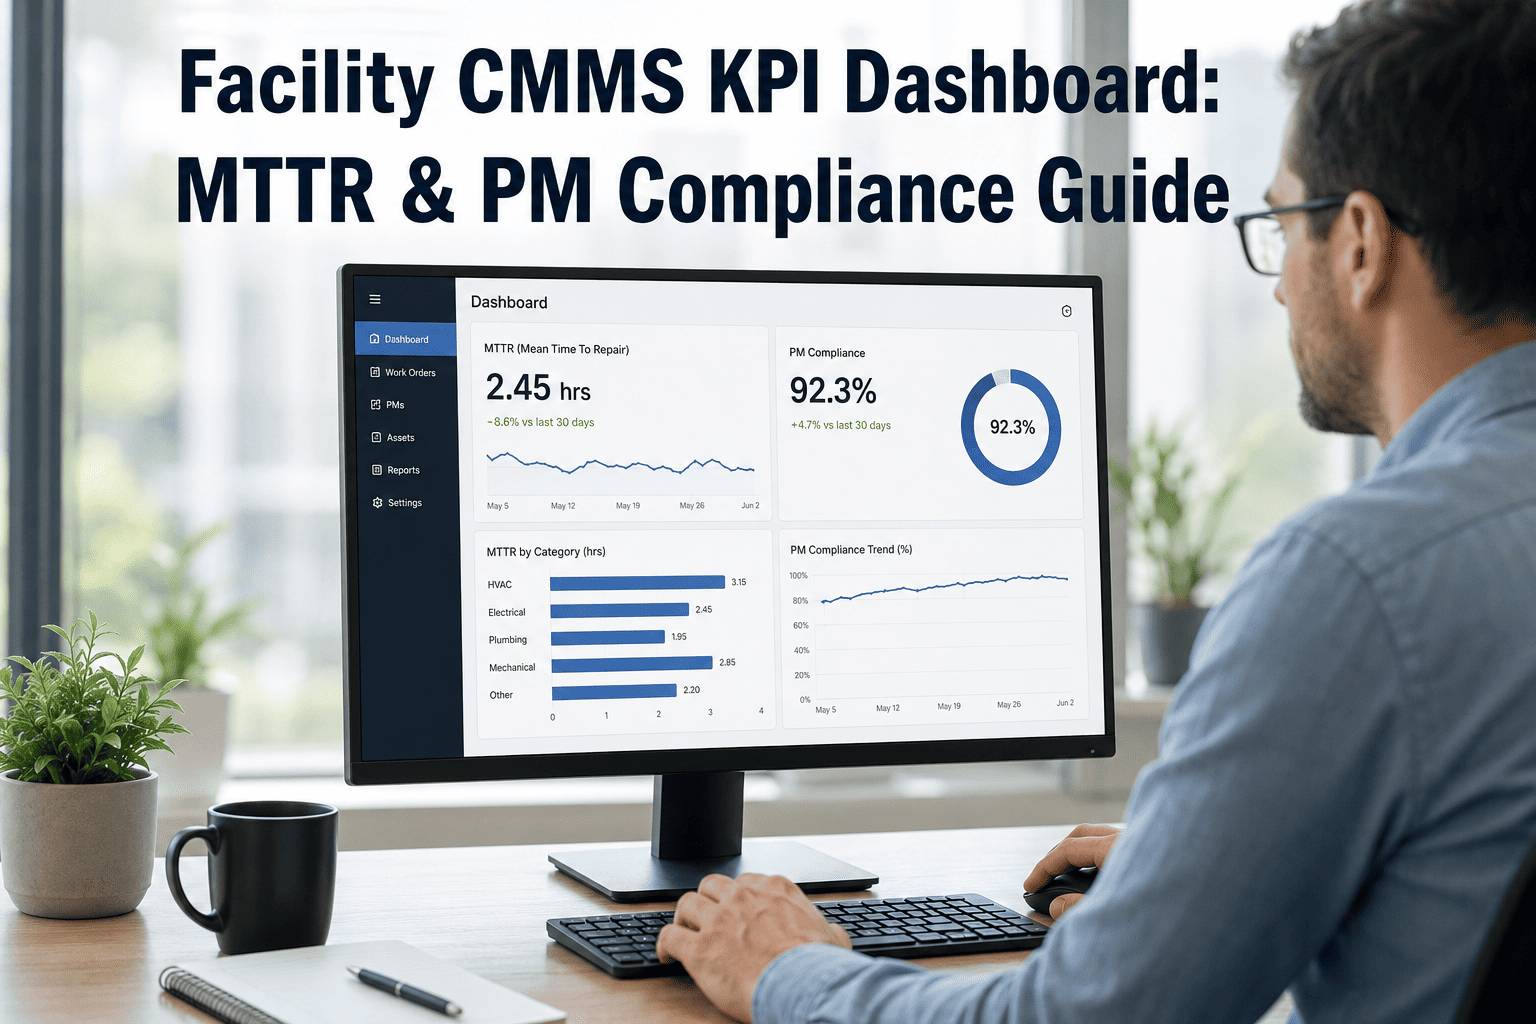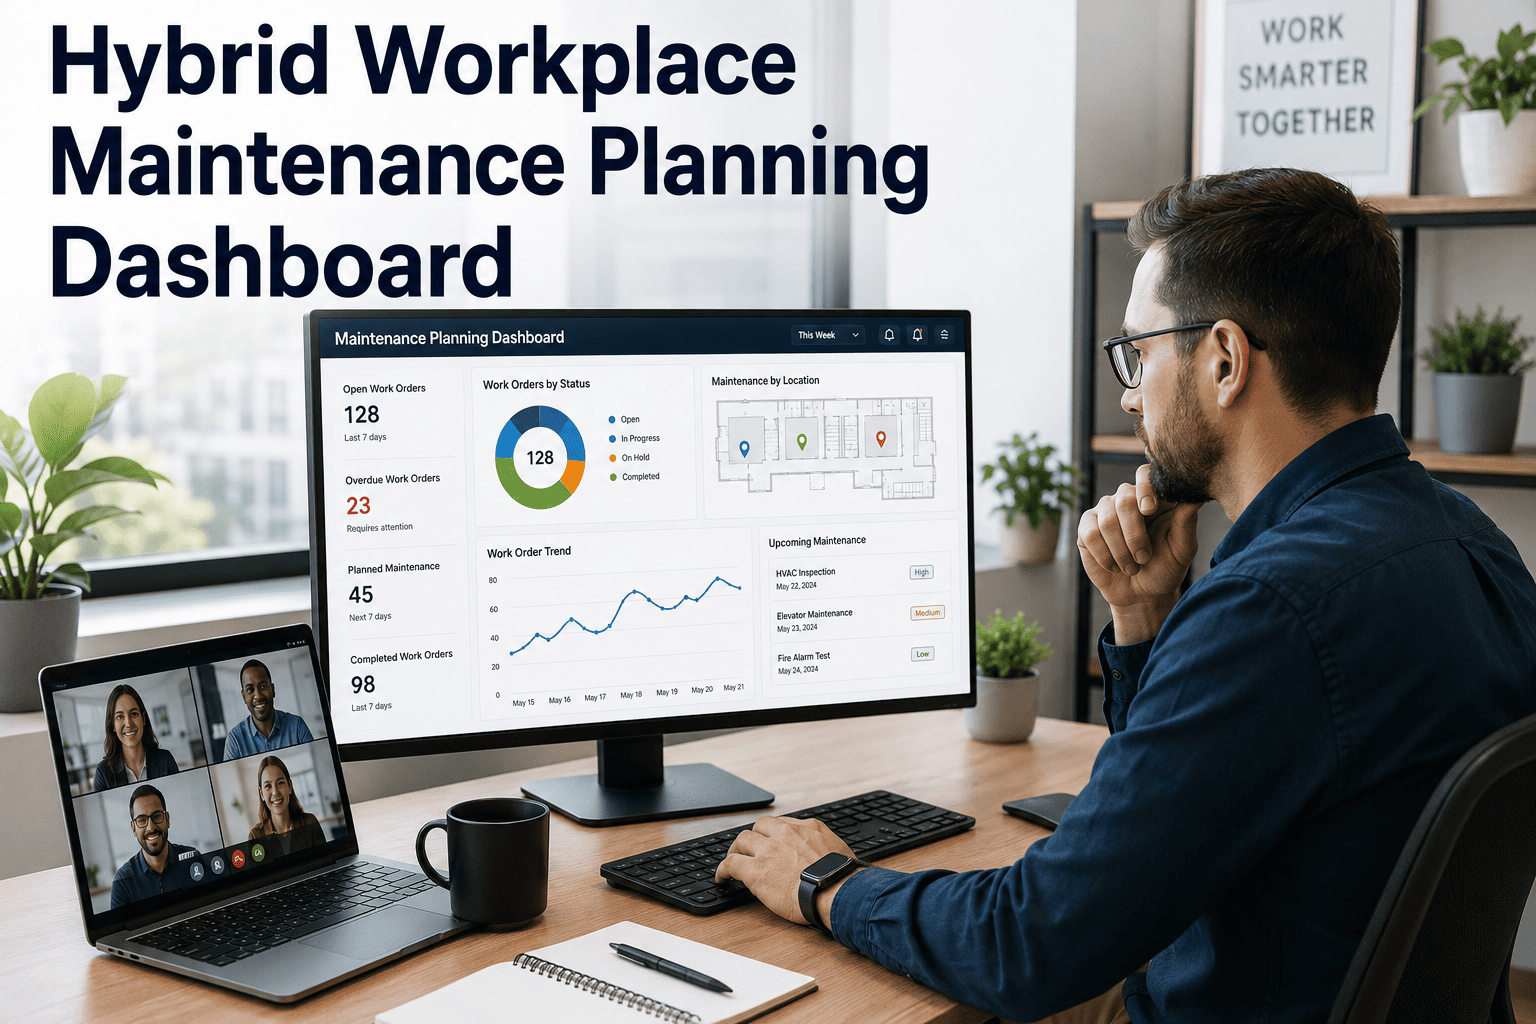
Hybrid work has stopped being a temporary arrangement and turned into the permanent shape of the modern office, with close to 80% of occupiers now running a hybrid policy long-term. That shift quietly broke something most facility teams have not fixed yet: the maintenance calendar. Cleaning crews still service every floor five days a week, HVAC still runs on fixed hours, and inspection rounds still follow the same fixed loop — regardless of whether the building is at 68% capacity on a Tuesday or 20% on a Friday. A hybrid workplace maintenance planning dashboard replaces that fixed calendar with maintenance that follows real attendance patterns, cutting wasted service hours while closing the safety gaps that fixed schedules miss on peak days. Book a demo to see how OxMaint turns occupancy data into a live maintenance plan for your buildings.
Your Maintenance Calendar Still Thinks It's 2019
Global office utilization now sits at 56% against an occupier target of 74% — an 18-point gap that fixed maintenance schedules were never built to handle. Rooms get cleaned that nobody sat in. HVAC zones run full-tilt on half-empty floors. Meanwhile the Tuesday crowd overwhelms restrooms, meeting pods and lifts that were scheduled for a "normal" day that no longer exists.
The Weekly Occupancy Curve Your Cleaning Crew Never Sees
Office attendance no longer spreads evenly across the week — it clusters hard around the middle. Tuesday consistently records the highest attendance industry-wide, while Friday occupancy regularly falls under 20%. A maintenance plan built around "every weekday, same service level" is either overspending on Friday or under-serving Tuesday. There is no version of a fixed calendar that gets both right.
Where the Fixed Schedule Actually Costs You
Three problems repeat across nearly every hybrid office, and none of them show up until someone compares the maintenance log against the badge-swipe data.
Over-servicing empty floors
Full cleaning and full HVAC runtime on zones sitting at 15–20% occupancy, quietly inflating labor and energy cost for space nobody used that day.
Under-servicing peak days
The same fixed staffing level tries to cover a Tuesday running at 3x Friday's occupancy, so restrooms, kitchens and meeting pods fall behind exactly when they matter most.
Inspection blind spots
Safety and life-safety inspection rounds get scheduled on low-occupancy days for staff convenience, missing the conditions that only appear under real peak-day load.
Stop Scheduling Maintenance for a Building That No Longer Exists
OxMaint's facility dashboard reads occupancy patterns and turns them into maintenance triggers — so cleaning, HVAC, lighting and inspection work follow how the building is actually used, not a calendar built in 2019.
How an Occupancy-Linked Maintenance Model Works
Instead of a fixed weekly loop, the dashboard reads a live occupancy signal and converts it into the right maintenance action for that specific day, zone and load — automatically.
Fixed Schedule vs Occupancy-Linked Schedule
The table below lines up the two models directly against the four maintenance categories most affected by hybrid attendance patterns.
| Maintenance Category | Fixed Weekly Schedule | Occupancy-Linked Schedule |
|---|---|---|
| Cleaning | Same crew size, every floor, every day | Crew size and floor coverage scale to that day's live occupancy |
| HVAC | Full-zone runtime regardless of headcount | Zone-level runtime tied to real-time desk and room occupancy |
| Lighting | Fixed on/off timers across the floor plate | Zone lighting follows occupied desks and booked rooms only |
| Inspections | Scheduled on convenient low-traffic days | Scheduled around peak-occupancy days to catch real usage conditions |
What Facility Teams Track After Switching Models
These are the metrics maintenance directors compare before and after moving from a fixed calendar to an occupancy-linked dashboard.
Space Utilization Rate
The healthy range most hybrid offices aim for — enough buffer for peak days without paying to maintain space nobody uses.
Actual vs Target Occupancy Gap
The gap between planned and real attendance. A shrinking gap means your maintenance triggers are matching reality more closely each month.
Peak-Day Inspection Coverage
Percentage of life-safety and condition inspections completed on genuine peak-occupancy days rather than convenient low-traffic ones.
Booking-to-Attendance Ratio
How often booked desks or rooms are actually used. A low ratio flags "ghost bookings" that were inflating your service plan for no reason.
Expert Review
The mistake most facility teams make with hybrid buildings is trying to solve an attendance problem with a real estate decision — cutting square footage — before they've even tried fixing how that square footage gets serviced. Nine times out of ten, the bigger win is cheaper and faster: stop cleaning and cooling space nobody is sitting in on a Friday, and stop under-resourcing the Tuesday crowd that's actually driving your complaints. Once maintenance follows the occupancy curve instead of the calendar, the utilization data you're already collecting for real estate decisions starts paying for itself twice over.
Turn the Attendance Data You Already Have Into a Maintenance Plan
OxMaint connects to your occupancy and booking data to generate cleaning, HVAC, lighting and inspection work orders automatically — matched to how each floor is actually used, day by day.
Frequently Asked Questions
Do we need occupancy sensors before this works, or can we start with what we already have?
Most teams start with badge-swipe data or desk-booking exports, which is enough to build a working occupancy-linked plan. Sensor data improves accuracy over time but is not a prerequisite. Book a demo and we'll map your existing data source to a live dashboard.
How does the dashboard decide when a zone needs cleaning or HVAC service?
Each zone gets an occupancy threshold set by your team — for example, a floor crossing 40% desk usage auto-triggers a cleaning pass. Thresholds are fully configurable per zone, floor and building. Start free to configure your first threshold rule today.
Will switching to occupancy-linked scheduling reduce our cleaning and HVAC staff?
Not typically — most teams redistribute existing staff hours toward peak days instead of cutting headcount. The gain is fewer wasted hours on empty floors, not fewer people. That redistribution is usually what closes the Tuesday service gap.
Can this dashboard also feed our real estate consolidation decisions?
Yes. The same utilization data driving your maintenance triggers doubles as the benchmarking data real estate and finance teams need for footprint decisions. One data source supports both operational and portfolio-level planning. Book a demo to see the reporting view built for that use case.