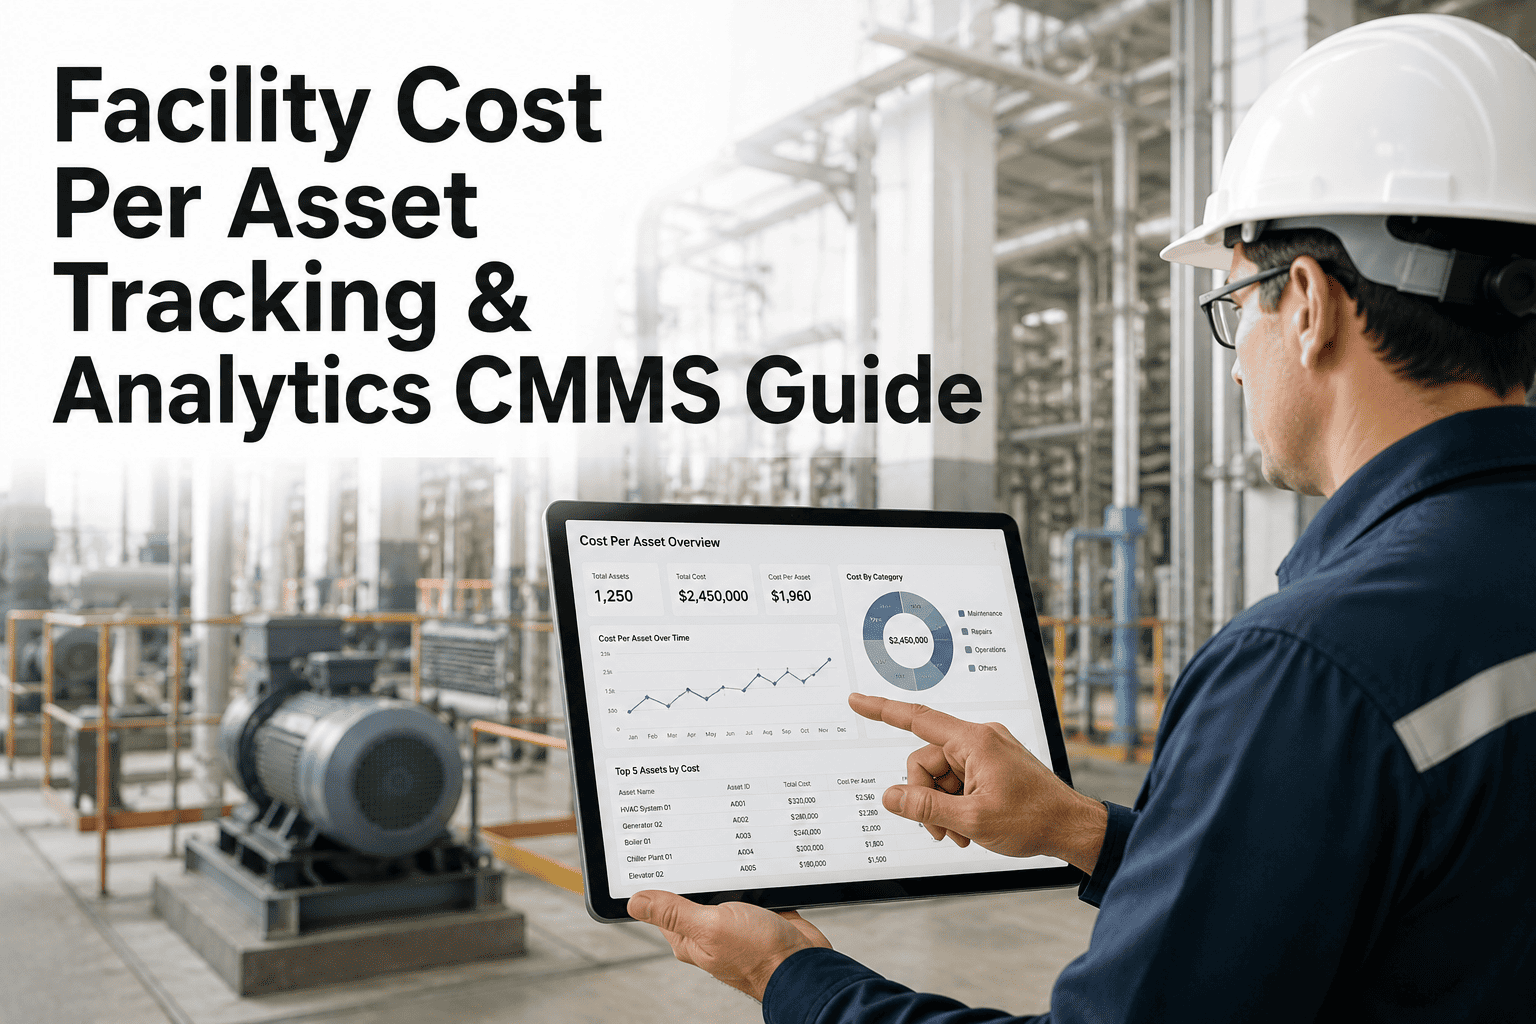
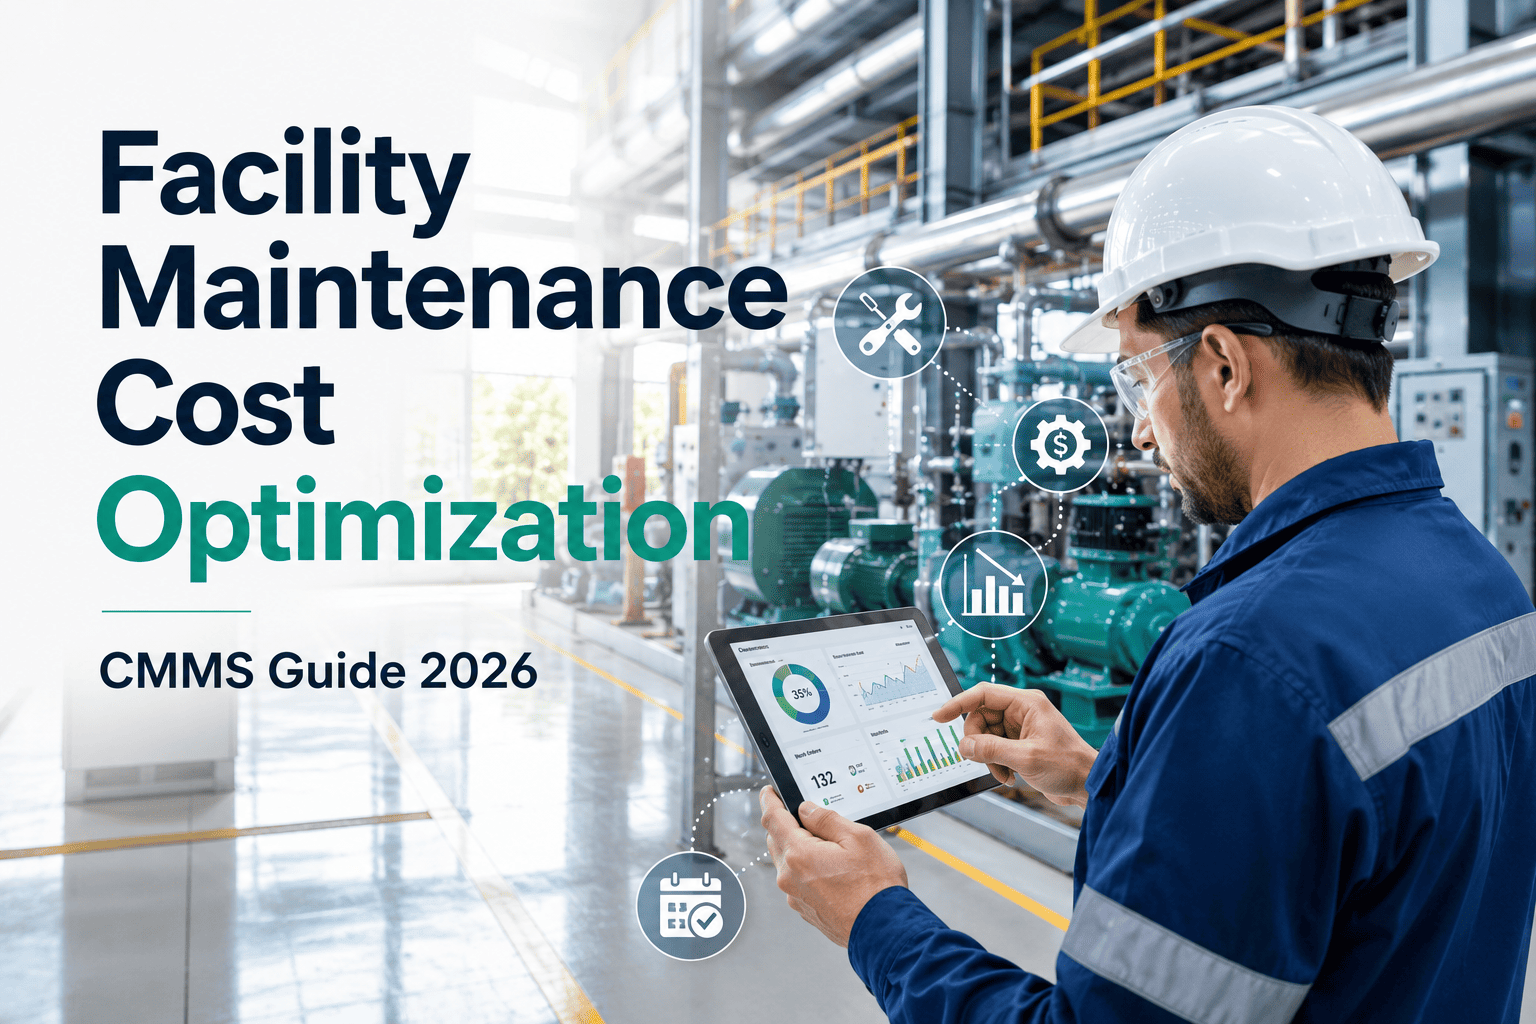
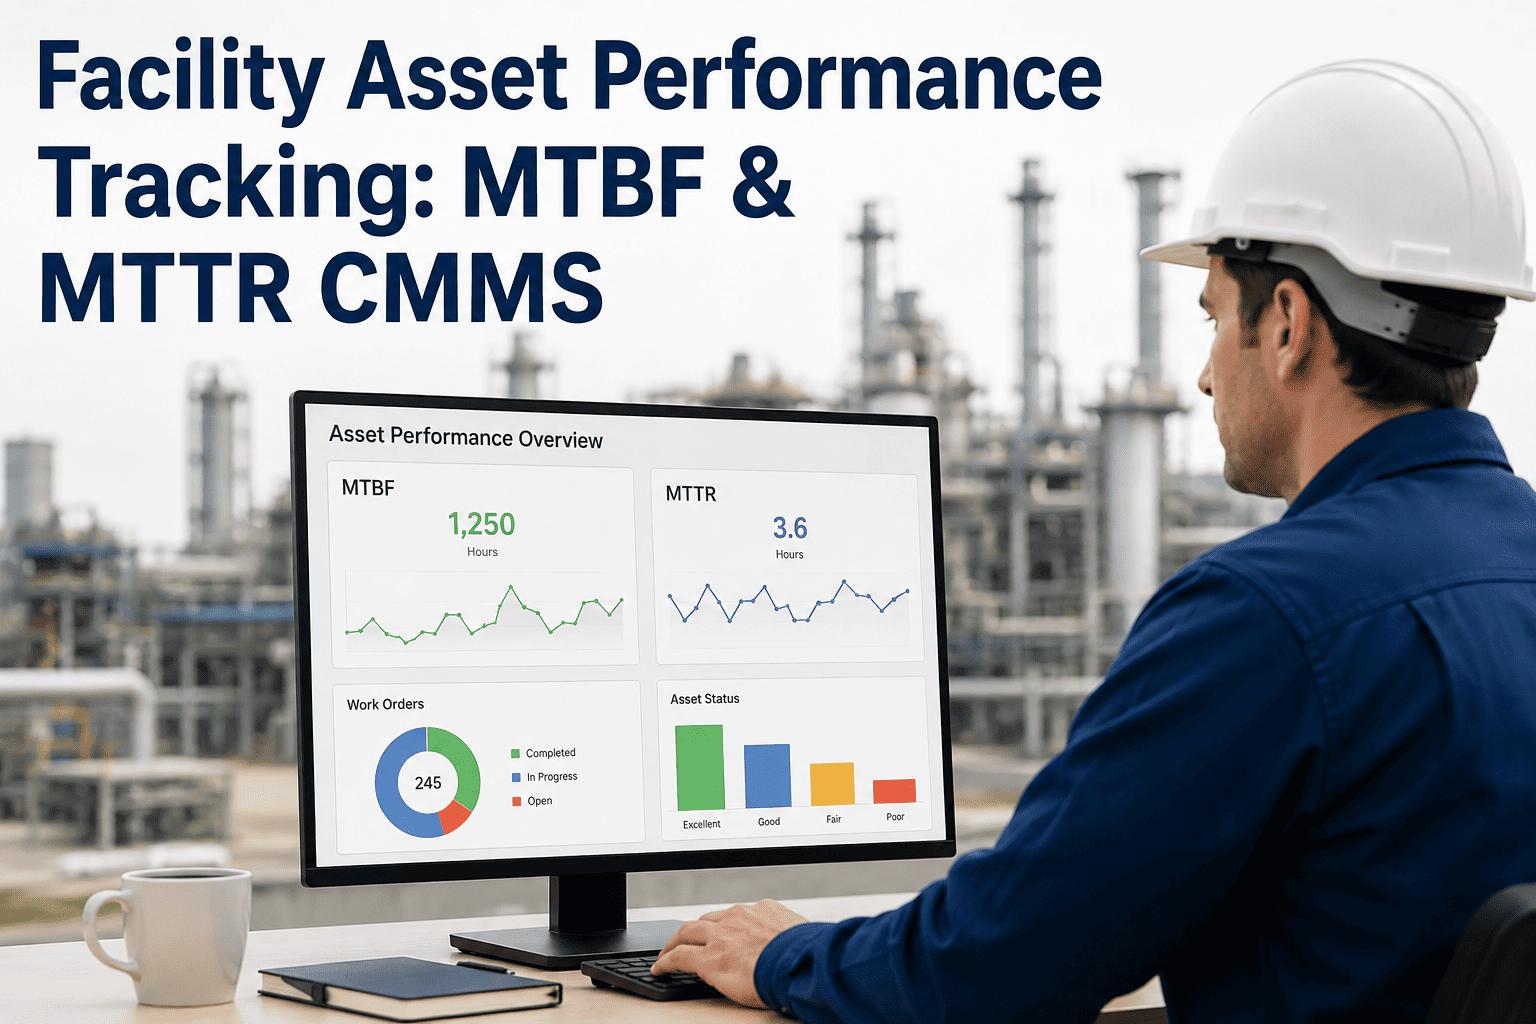
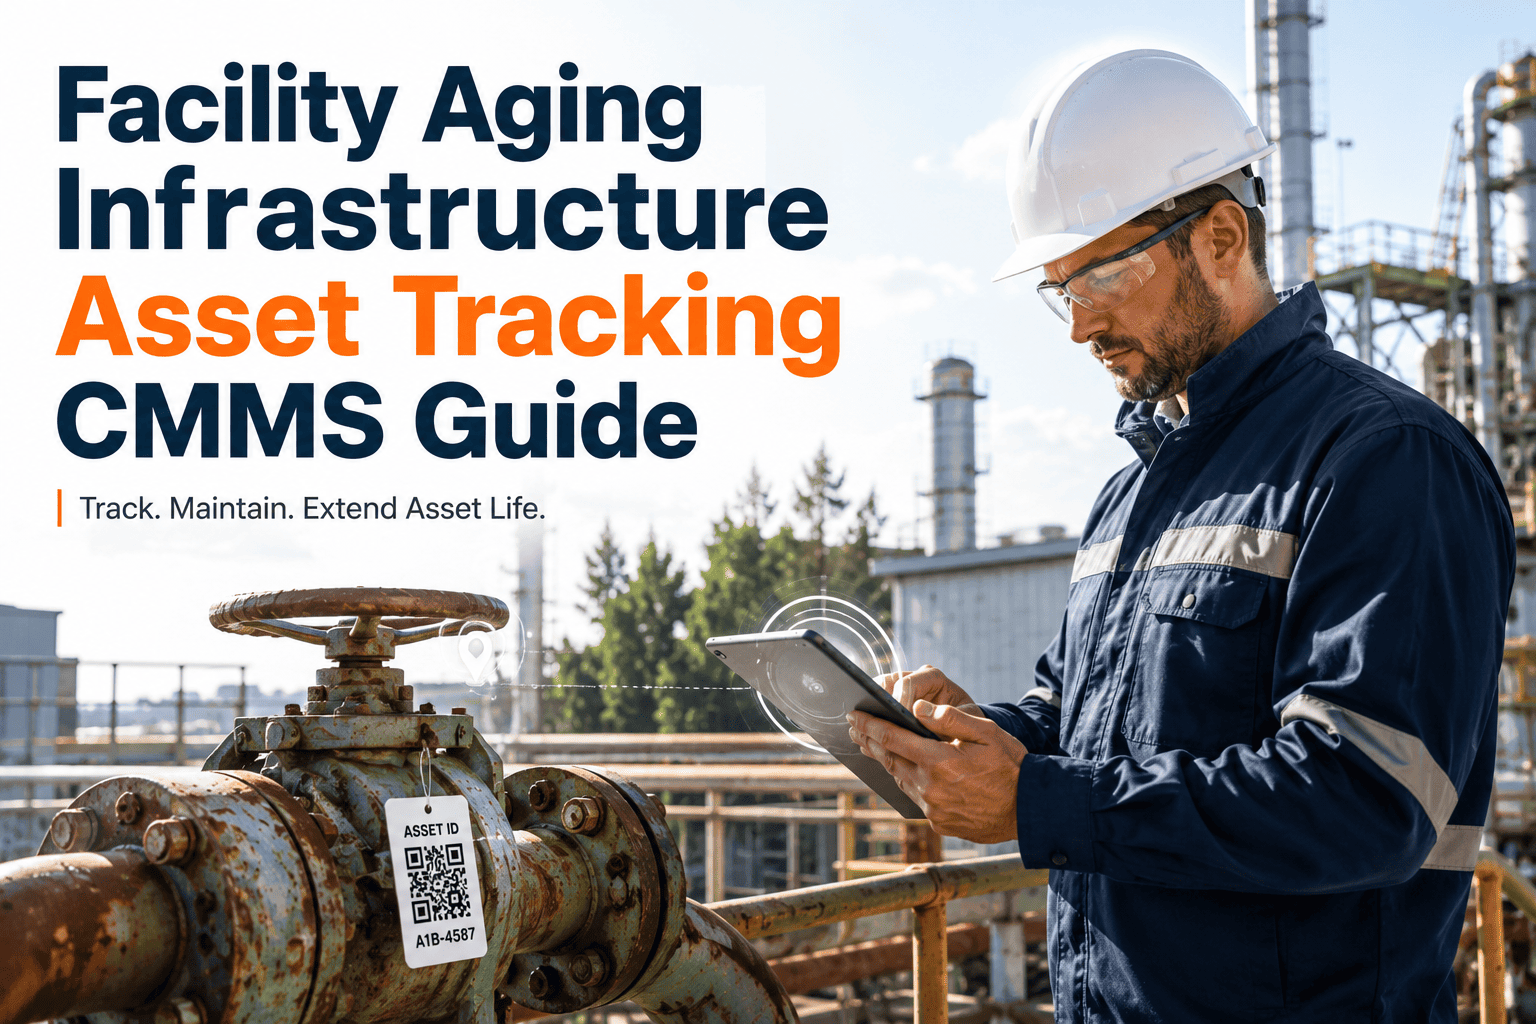
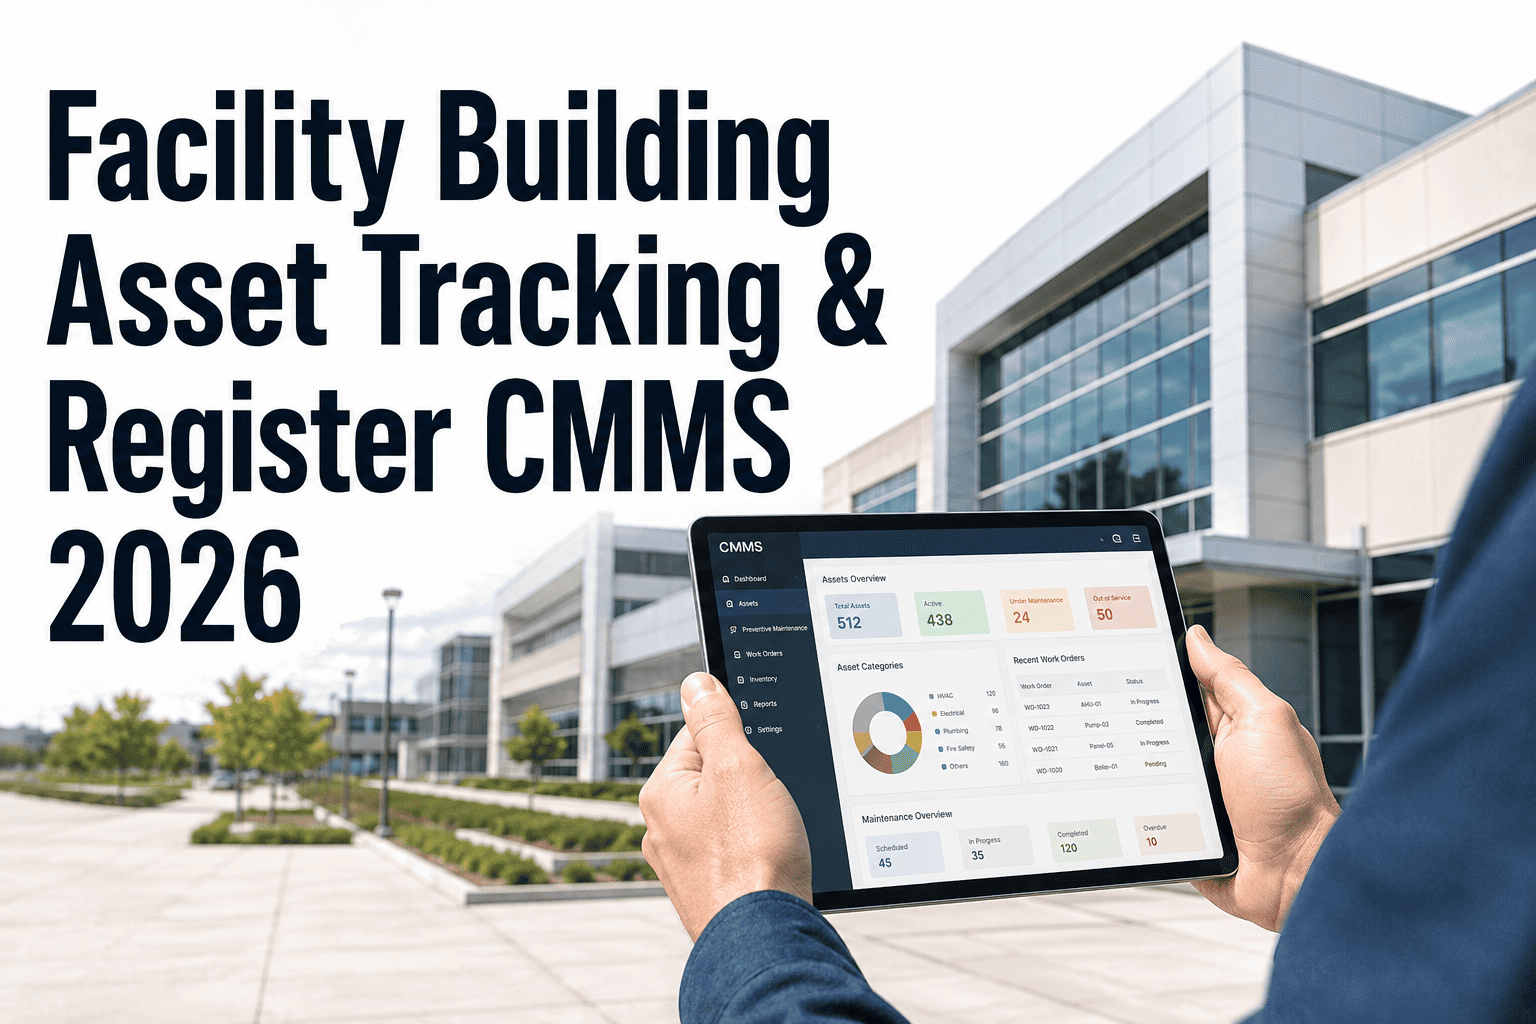
Most facility managers can tell you the total maintenance spend for the quarter down to the last rupee, but ask them what any single chiller, boiler, or air handler actually costs to keep running each year and the answer arrives as an educated guess. That gap between total budget and true per-asset cost is where the biggest facility spending decisions get made blind, from repair-versus-replace to which contractor is really worth the premium. Cost per asset tracking closes it by attaching every labour hour, spare part, invoice, and downtime hit to the specific equipment that caused it. Industry benchmarks put facility maintenance at 2 to 4 percent of replacement asset value each year, yet fewer than one in three teams can produce that number by asset. See how automated per-asset cost capture works on your own equipment register, book a demo or start free on OxMaint.
Complete Guide · Cost Per Asset · CMMS 2026
Facility Cost Per Asset Tracking & Analytics: The 2026 CMMS Guide
Everything a facility team needs to capture true per-asset maintenance cost, read cost trends by equipment type, and turn work-order data into repair-versus-replace decisions the finance team will actually trust.
2–4%
Of replacement asset value is the industry benchmark for annual facility maintenance spend
31%
Of facility teams can produce a complete per-asset cost breakdown on request today
18%
Average maintenance overrun on assets tracked at portfolio level instead of asset level
3.2x
Higher accuracy on repair-versus-replace calls when full asset cost history is on hand
Four Blind Spots Created by Portfolio-Level Cost Tracking
Rolling every asset into one facility budget is fast on paper and expensive in practice. Four blind spots quietly compound until the annual review, when a big variance shows up with no clear owner to explain it.
A
Hidden Cost Leaders
Three or four ageing assets often consume half the maintenance budget, but the pattern stays invisible when spend is only rolled up by building or by site.
B
Repair-vs-Replace Guesswork
Without a running cost total per asset, replacement calls get made on age or gut feel, not on the cumulative repair spend that already exceeded replacement price.
C
Contractor ROI Unclear
A vendor might invoice less per visit but return more often. Without per-asset callback tracking, the cheaper contractor turns out to be the expensive one.
D
Capex Cases Are Weak
A capital request for equipment replacement needs asset-level cost history to defend. Without it, finance pushes back and the failing asset stays in service.
The 6 Cost Streams That Make Up True Per-Asset Cost
Total cost of ownership for a single asset is never one number in one column. It is six separate streams a CMMS captures automatically as work happens, then rolls together into a single record when a financial decision has to be made.
Stream 01
Direct Labour Hours
Every technician hour spent on the asset, captured against the work order at completion. No estimated allocations, no month-end guesswork.
Stream 02
Spare Parts Consumed
Each part pulled from inventory books to the asset that received it, at the actual purchase cost of that part, not a blended annual average.
Stream 03
Contractor Invoices
Every outside vendor visit ties to the specific asset it served, so the running total includes third-party spend alongside in-house labour.
Stream 04
Downtime Impact
Production hours lost or occupancy disruption during unplanned outages, converted to a rupee figure using a rate you set once at the site level.
Stream 05
Energy Consumption
For metered assets, energy draw is captured against the asset record so degradation shows up in the utility line before it shows up in a failure.
Stream 06
Compliance & Inspections
Regulatory checks, certifications, and safety inspections attached to the asset carry their own cost line, from external inspector fees to overtime.
Per-Asset Cost Capture · OxMaint · 2026
Stop Rolling Every Cost Into One Budget Line
OxMaint captures labour, parts, contractor spend, downtime, and compliance costs against each asset automatically, so per-asset totals build themselves as work gets done on site.
The 4-Step Cost Capture Loop That Runs Inside a CMMS
Per-asset cost data is not produced by a report at year-end. It is captured continuously, one work order at a time, through a four-step loop that runs every time a job is opened, worked, and closed.
Step 1
Work Order Opens
A job is created against a specific asset ID. Every hour, part, and invoice from this point forward tags automatically to that asset.
Step 2
Costs Attach in Real Time
Technicians log labour, inventory issues parts, vendors upload invoices. Every entry books to the asset with no separate cost-coding step.
Step 3
Job Closes with Totals
On completion, the CMMS totals every cost stream and adds them to the asset's cumulative record without a manual reconciliation.
Step 4
Analytics Refresh
Cost-per-asset dashboards update immediately, so trend lines and repair-versus-replace flags reflect the job that just finished.
6 Cost Analytics That Turn Data Into Facility Decisions
Capturing cost per asset is step one. The value shows up in the six analytics that clean CMMS data unlocks, each one answering a specific decision a facility manager makes month after month.
Cumulative Cost vs Replacement Value
Running total of asset lifetime spend as a percentage of what it would cost to replace. Once this crosses roughly 60 percent, replacement usually wins on math alone.
Cost Per Operating Hour
Total spend divided by hours the asset actually ran. Levels the field between hard-run and lightly-used equipment of the same type across a portfolio.
Reactive vs Planned Spend Ratio
Share of asset spend going to unplanned emergency repairs. A ratio above 40 percent flags an asset where PM scheduling is quietly failing.
Cost Trend Year Over Year
Same asset's maintenance cost compared to prior year. A 25 percent or greater year-over-year jump is the earliest financial signal of coming failure.
Contractor Callback Cost
How often the same vendor returns for the same fault on the same asset within 90 days. Callback cost quietly doubles the visible invoice cost.
Cost by Failure Mode
Spend grouped by what actually broke, from bearing to seal to control board. Points capex and PM changes at the failure that costs the most, not the most frequent.
Manual Cost Tracking vs CMMS Cost Analytics
| Cost Question a Manager Faces |
Manual Spreadsheets |
CMMS With Per-Asset Cost |
| What does asset #4137 cost to run this year? |
Estimated at year-end by pulling invoices and guessing labour splits |
One click on the asset record shows the live cumulative total |
| Should we replace or repair this chiller? |
Decision made on age and gut feel with no cumulative spend figure |
Lifetime spend against replacement value shown automatically per asset |
| Which vendor gives us the best real value? |
Compared on invoice amount only, ignoring callback rates and rework |
Total contractor spend per asset with callback frequency built into the view |
| Which equipment class is our biggest cost drain? |
Not answerable without a manual roll-up project each time |
Cost by asset class and failure mode dashboards refresh on every work order |
| Are our PM schedules actually paying off? |
Judged by feel, since PM cost and reactive cost live in different files |
Reactive-vs-planned spend ratio shown per asset, per site, per year |
| Can we defend this capital request to finance? |
Business case built from scratch each time with incomplete history |
Complete cost history exports directly into the capex proposal |
Cost Signals to Watch by Equipment Type
Different facility assets fail with different cost fingerprints. Learning to read those signals turns per-asset cost data into an early warning system rather than a lagging quarterly report.
HVAC & Chillers
Watch for energy cost climbing while labour cost stays flat. That gap usually means coil fouling or refrigerant loss well before a hard failure event.
Leading signal: energy drift
Rotating Equipment (Pumps, Motors, Fans)
Frequent small spare-part orders like bearings and seals against the same asset within a rolling 90-day window is the cheapest fault signal to catch early.
Leading signal: repeat small parts
Electrical & Switchgear
Rising contractor callback frequency without invoice inflation. Vendors returning quietly is often the first sign of insulation or connection degradation.
Leading signal: callback rate
Building Envelope & Plumbing
A concentration of small reactive jobs on adjacent assets. A cluster of low-cost tickets in one zone almost always precedes one large expensive one.
Leading signal: reactive cluster
Expert Perspective
The single biggest shift a CMMS creates for a facility team is not faster work orders, it is a defensible cost number against every asset when a capital committee asks for one. When a manager can walk into a review with the running lifetime spend on a specific chiller, along with its callback rate and its reactive-versus-planned ratio, the conversation stops being about opinions and starts being about math. That is the moment cost per asset stops being an accounting exercise and becomes the tool that gets ageing equipment replaced before it fails on the worst possible day of the year.
Priya Ramachandran, CFM, CMRP
Certified Facility Manager and Certified Maintenance and Reliability Professional · 14 years leading facility operations and CMMS-driven cost programmes across commercial real estate and healthcare portfolios
Frequently Asked Questions
What does cost per asset tracking actually measure in a facility CMMS?
It captures every labour hour, spare part, contractor invoice, downtime hour, and inspection cost against a specific asset ID over its life. The result is a running total that answers what any one piece of equipment truly costs to keep in service.
Start free to see the format on your own asset list.
How is cost per asset different from a standard maintenance budget line?
A budget line rolls every asset into one number for a building or site. Cost per asset breaks that number down to the specific equipment consuming it, so cost leaders and repair-versus-replace decisions become visible instead of averaged out.
When should an asset move from repair to replace based on cost data?
Most facility teams use a threshold of 60 percent of replacement value in cumulative lifetime spend, combined with a rising year-over-year cost trend. Sectors with critical uptime often set a stricter 40 percent trigger for mission-critical assets.
Do we need barcodes or RFID tags to track cost per asset in a CMMS?
No. A unique asset ID inside the CMMS is enough to attach labour, parts, and invoices to it. Barcodes and QR tags simply speed up on-site lookup and reduce the risk of a technician logging work against the wrong asset.
How quickly does a facility see meaningful per-asset cost data after CMMS rollout?
Most teams see meaningful cost totals within 60 to 90 days of go-live, once one full PM cycle plus reactive tickets have flowed through the system.
Book a demo to walk through the rollout timeline for your portfolio.
Facility Cost Analytics · OxMaint · 2026
Every Asset Should Have a Cost Story, Not Just Every Building
OxMaint turns every work order into a per-asset cost record automatically, so cumulative spend, cost trends, and repair-versus-replace flags build in the background while your team runs the site.