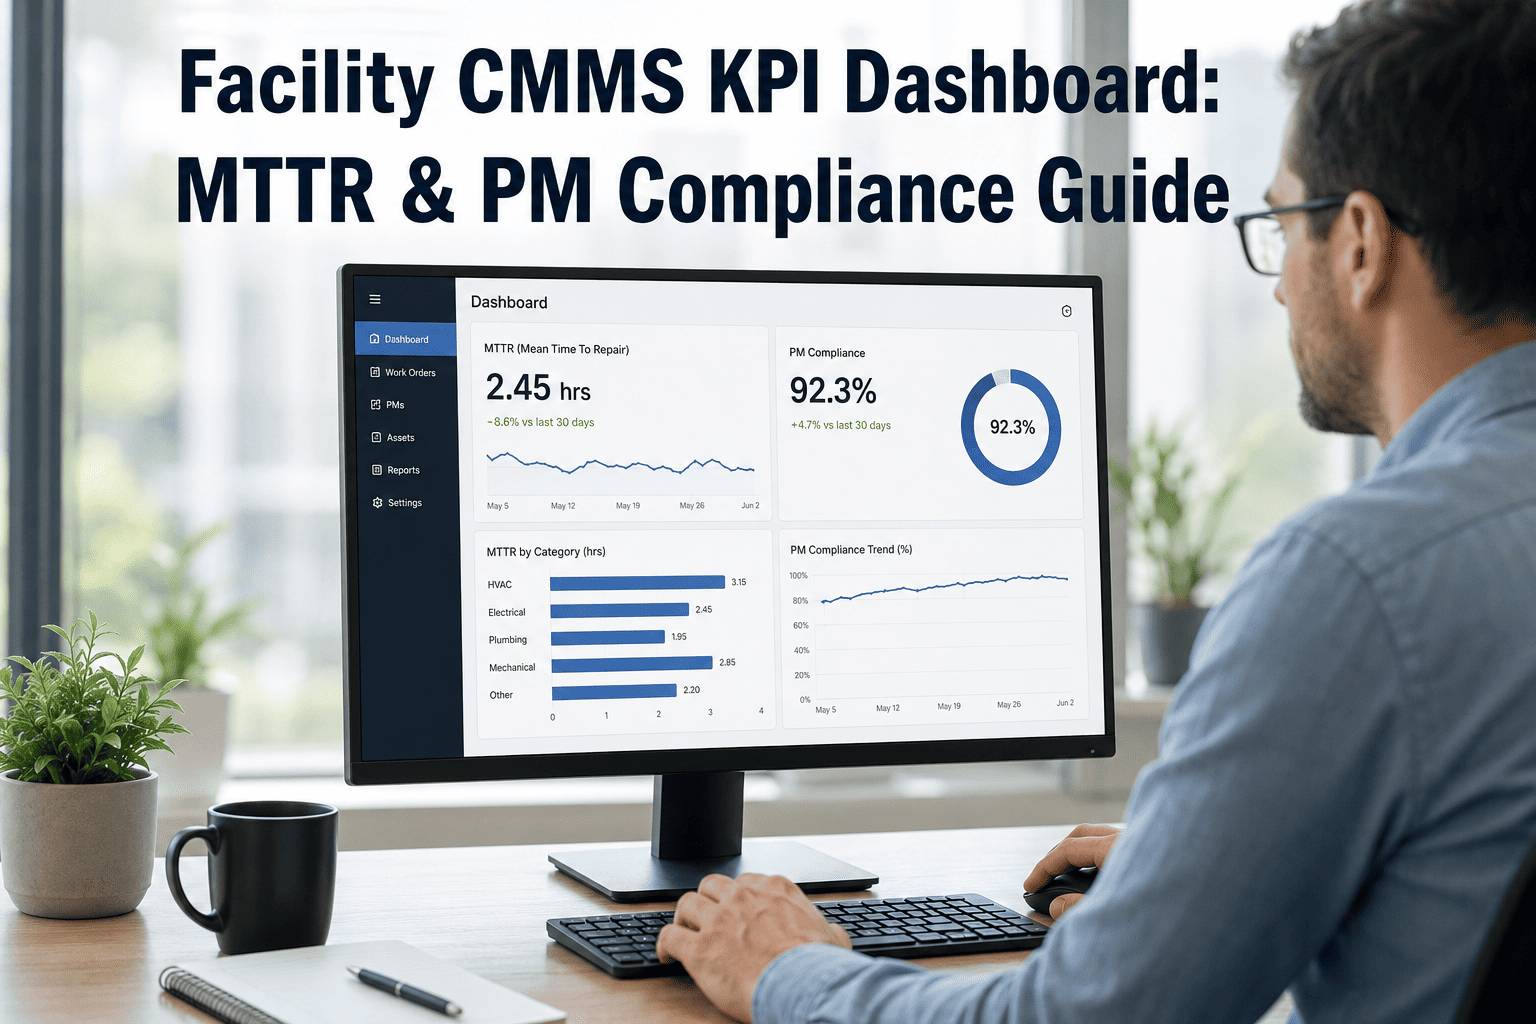
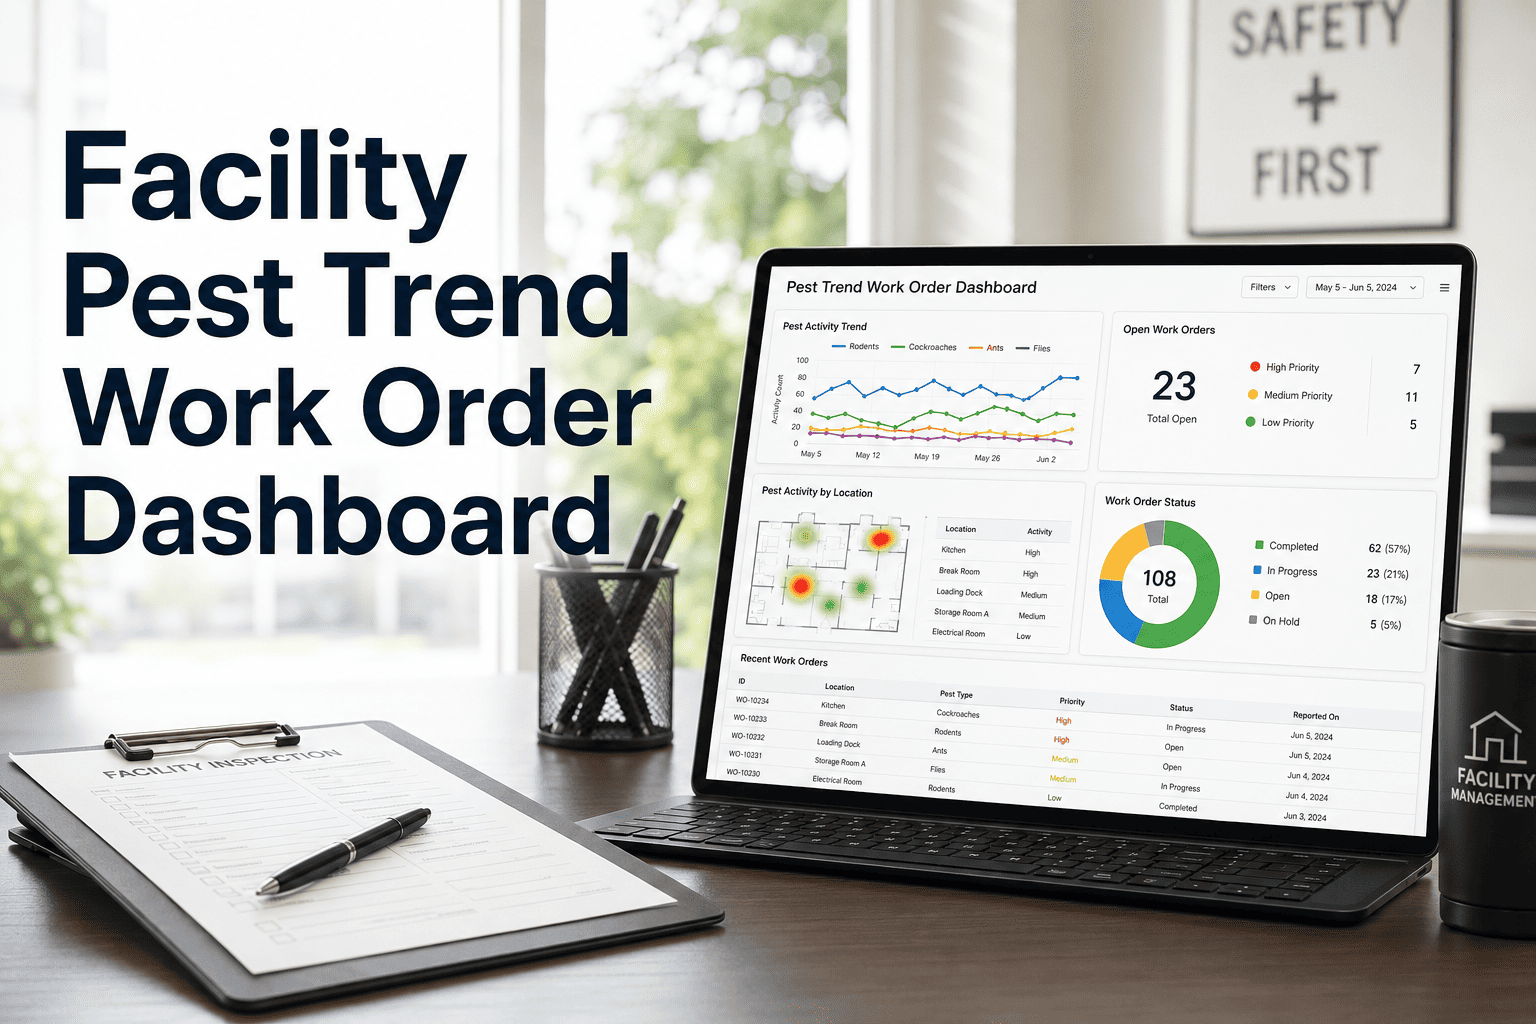
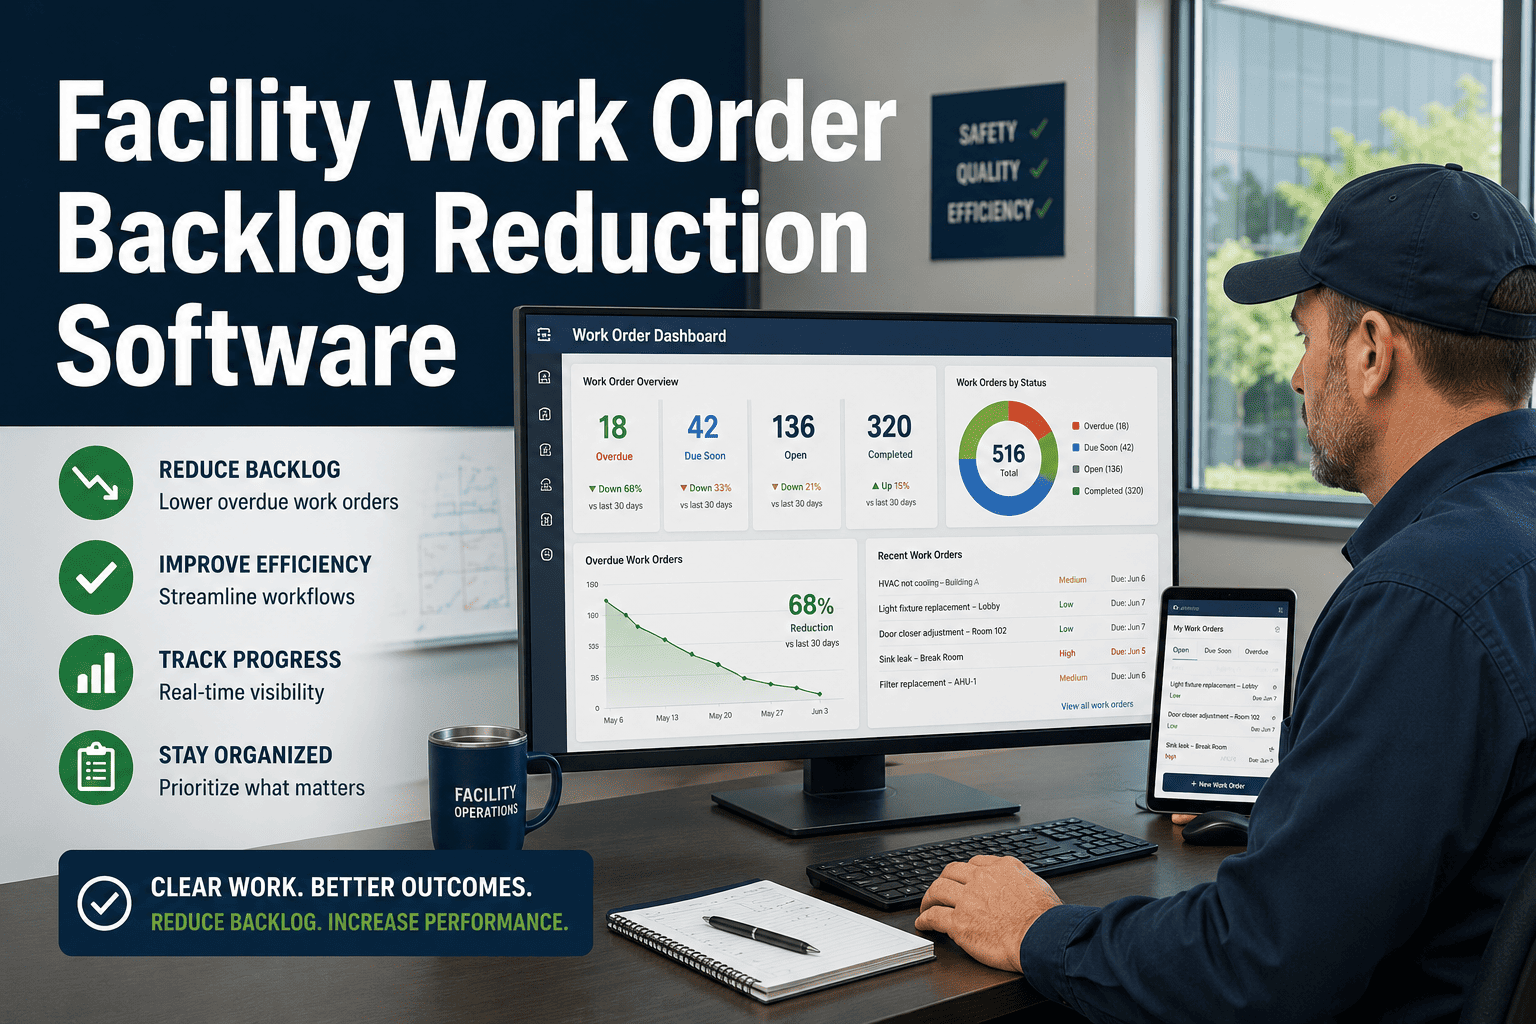
Most facility teams open their CMMS every Monday to the same blind spot: preventive maintenance tasks that quietly slipped past due, a repair backlog nobody has actually measured in weeks, and a maintenance budget that only makes sense once the invoices land. A KPI dashboard fixes this by surfacing five numbers the moment a work order closes — Mean Time To Repair, PM compliance rate, planned-to-reactive ratio, backlog percentage, and cost per asset — so problems show up while they are still cheap to fix, not after a breakdown forces the conversation. Facilities that put this visibility in place typically move PM compliance out of the reactive zone within a year, without adding a single technician to headcount. Start tracking these five KPIs live on Oxmaint and see your first dashboard populate today.
Facility CMMS · KPI Dashboards · Live Analytics
Facility CMMS KPI Dashboard: MTTR, PM Compliance & Backlog, Live
Stop consolidating spreadsheets to answer "are we ahead or behind this month." A live dashboard calculates MTTR, PM compliance, planned-to-reactive ratio, backlog, and cost per asset the instant a technician closes a work order.
Why Spreadsheet KPI Tracking Always Runs Behind
A spreadsheet can hold the same numbers a dashboard shows — the problem is timing. By the time someone exports data, cleans it, and builds the monthly slide, the operational picture it describes is already history.
Data Is Weeks Stale
Manual consolidation means the PM compliance number in this month's report reflects last month's work, not what is overdue right now.
Rescheduled Tasks Hide
Paper checklists let a missed PM get rescheduled without documentation, quietly inflating a compliance rate that looks healthier than it is.
Backlog Grows Unseen
Without a live count, open work orders age past their SLA silently until a supervisor stumbles onto a two-month-old ticket.
No Proof For Budget Asks
Executives want a trend line connected to cost, not a verbal update — and a spreadsheet snapshot rarely survives that conversation.
The 5 KPIs Every Facility Dashboard Should Show First
These five metrics give the clearest read on whether an operation is getting ahead of failures or constantly reacting to them — and they are the fastest to move once a CMMS is calculating them automatically.
01
Mean Time To Repair (MTTR)
Reviewed Weekly
Reactive: 12hrs+
Average: 8–12hrs
World-Class: under 4hrs
MTTR measures total repair time divided by number of repairs. A high number usually points to a structural issue — missing parts, an under-trained crew, or incomplete work order details — not a slow technician.
02
PM Compliance Rate
Reviewed Weekly
Below 65%: Reactive
65–84%: Average
85%+: World-Class
This is the percentage of scheduled preventive tasks actually completed on time. It is the single leading indicator most reliability teams watch first, since low compliance is almost always the root cause behind expensive emergency repairs later.
03
Planned-to-Reactive Ratio
Reviewed Monthly
Under 50% Planned
50–70% Planned
85%+ Planned
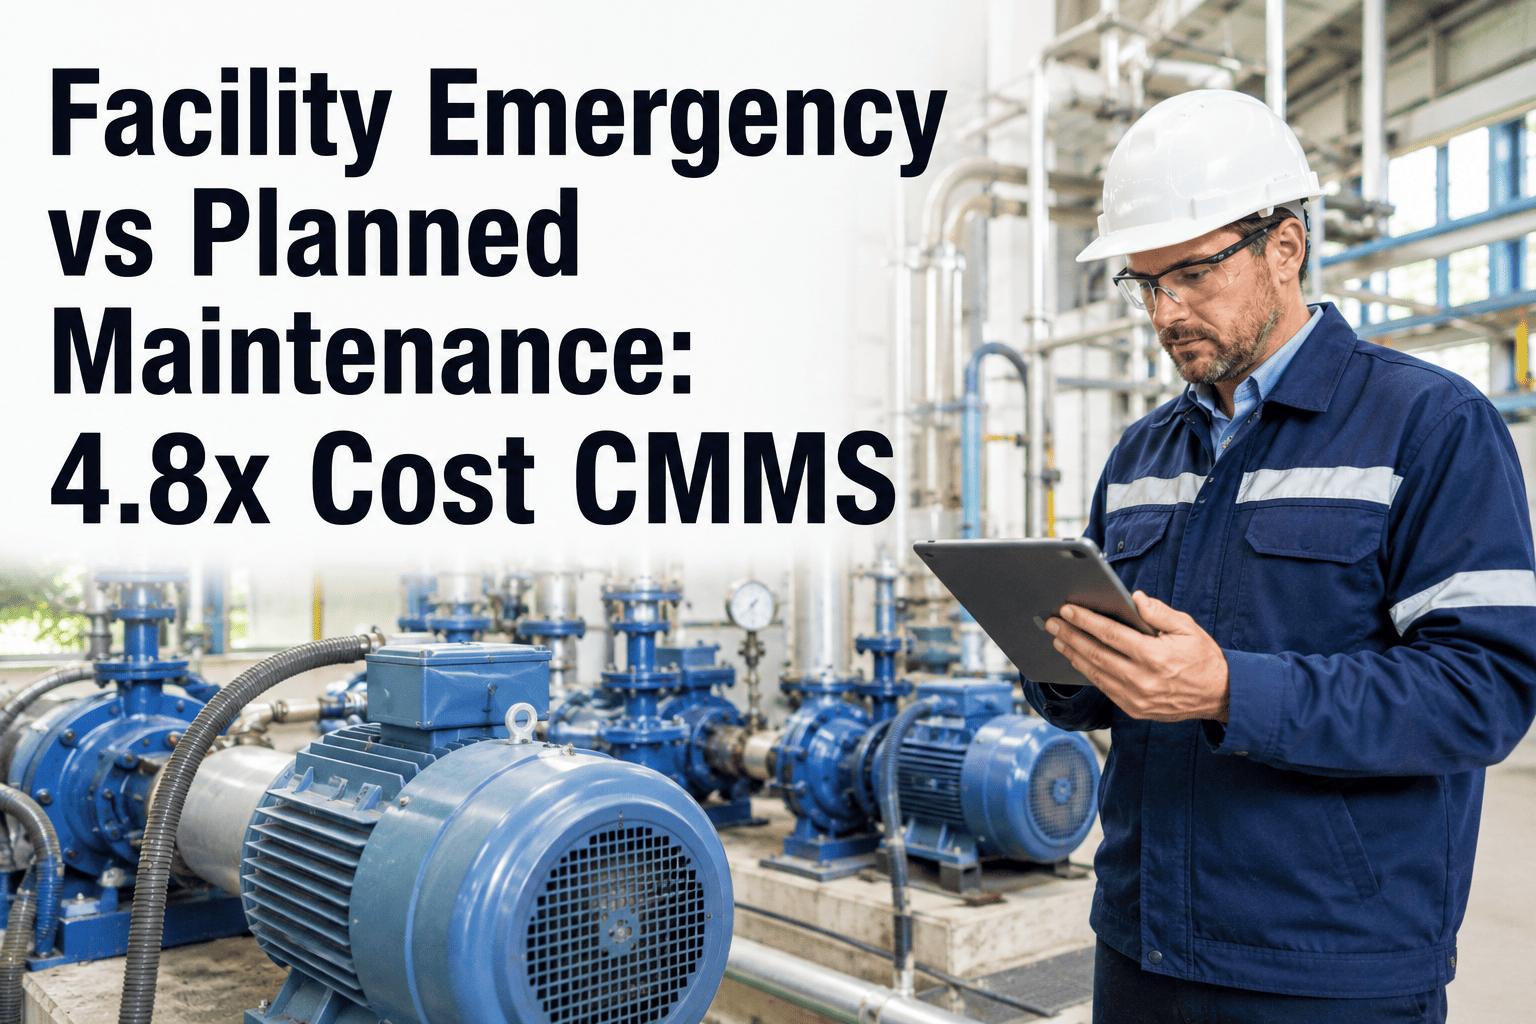
Reactive repairs typically cost several times more per event than the same job done as scheduled maintenance. As this ratio shifts toward planned work, MTTR, asset uptime, and total cost usually improve together.
04
Work Order Backlog Rate
Reviewed Weekly
Over 20%: Buried
10–20%: Average
Under 5%: World-Class
Backlog tracks the share of open work orders that have aged past their expected completion window. A rising backlog is usually the earliest warning sign that a team is understaffed or that dispatch is inefficient.
05
Cost Per Asset
Reviewed Monthly
Rising Trend
Flat Trend
Declining Trend
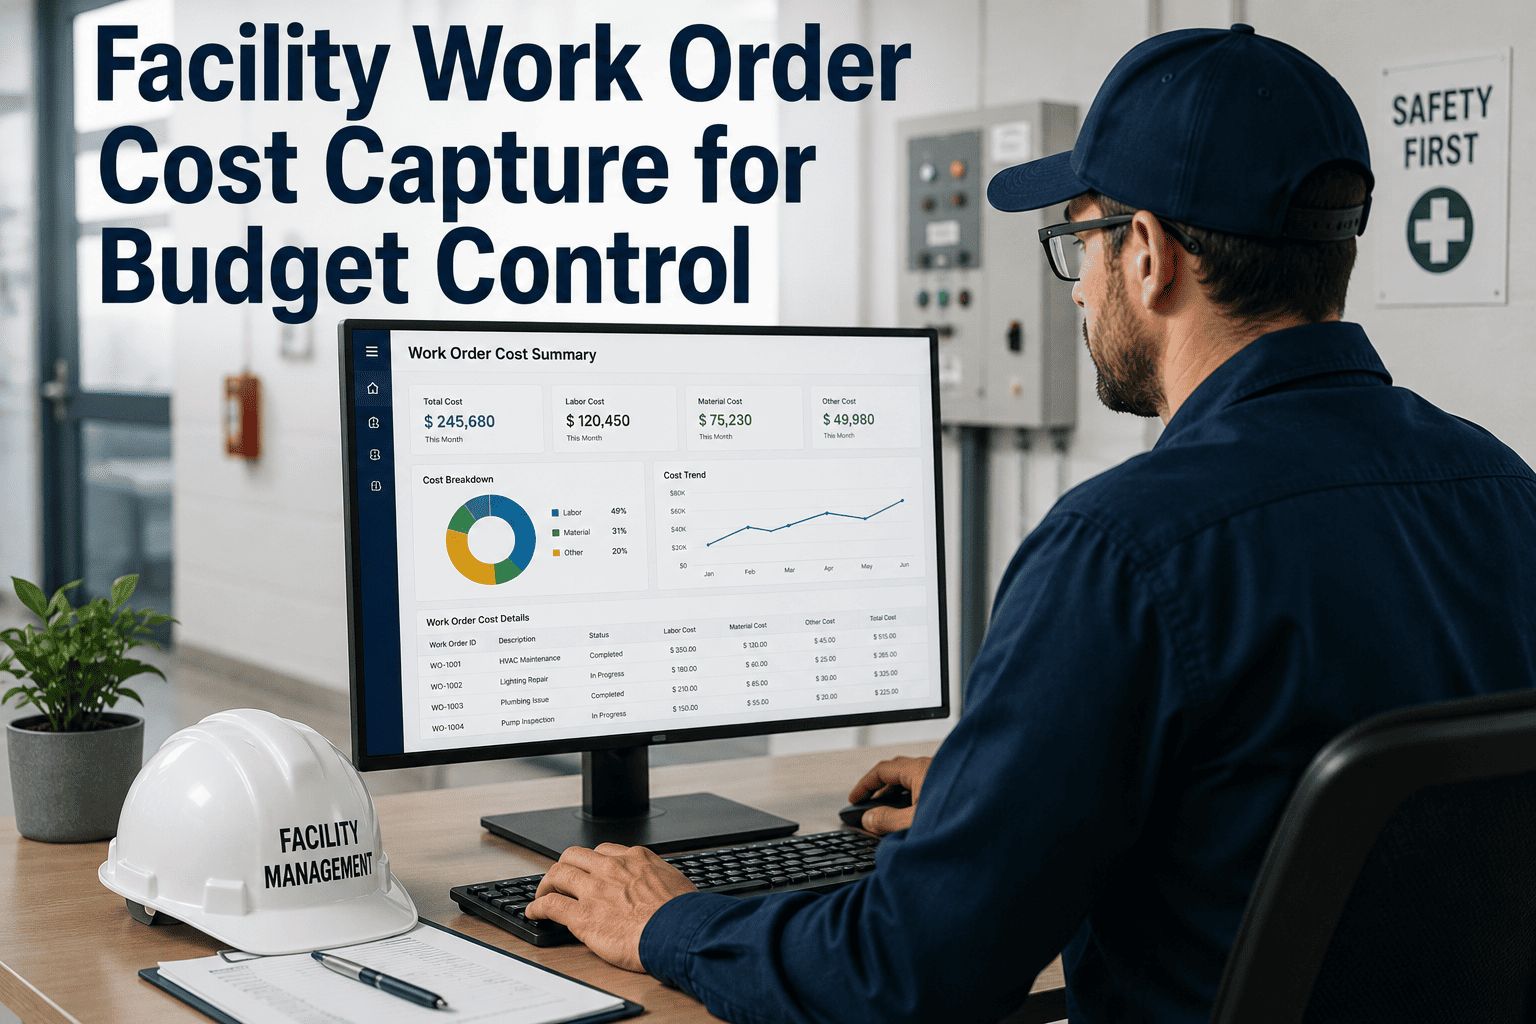
Total labor, parts, and contractor spend attributed to a single asset, tracked over time. When cost per asset climbs quarter over quarter, it builds the exact evidence a repair-versus-replace decision needs.
Every week your KPIs sit in a spreadsheet is another week PM compliance keeps drifting and nobody notices until an asset fails and proves it the expensive way.
Spreadsheet Tracking vs a Live CMMS Dashboard
| Factor |
Spreadsheet Tracking |
Live CMMS Dashboard |
| Data Freshness |
Updated when someone finds time to consolidate exports |
Updates the instant a work order closes |
| PM Compliance Accuracy |
Rescheduled tasks can hide missed PMs |
Overdue tasks flagged before they age past 7 days |
| Backlog Visibility |
Discovered during month-end review, if at all |
Visible on the dashboard in real time, by priority |
| Executive Reporting |
Manual slide build, hours per reporting cycle |
One-click export with trend lines and drill-down |
| Portfolio Comparison |
Separate files per site, hard to compare |
PM compliance and MTTR ranked across every property |
Results Facility Teams See After Going Live
Corporate Campus
PM compliance moved from 38% to 84% in 12 months
Automated scheduling and mobile task closure replaced a paper checklist system that had no reliable way to flag rescheduled or skipped tasks.
Healthcare Facility
MTTR reduced by roughly 20% within 60 days
Mobile work orders routed the right technician to the right asset immediately, cutting the diagnostic time that usually dominates repair duration.
Multi-Site Portfolio
Reactive work orders fell as planned ratio climbed past 80%
Portfolio managers could finally rank properties by PM compliance and cost per asset in one dashboard instead of chasing separate site reports.
Expert Review
FM
Facility Analytics Reviewer
Maintenance KPI & Reliability Review
Most maintenance reports track activity — work orders closed, hours logged — instead of outcomes like reliability and cost. A dashboard only earns its place on a facility manager's desk when it connects PM compliance, MTTR, and backlog to a business decision, not just a chart. Teams that track these five KPIs live, rather than in a monthly spreadsheet, consistently catch small declines before they become the breakdown that costs a quarter's maintenance budget in a single event.
Frequently Asked Questions
What is a good PM compliance rate for a facility CMMS dashboard?
Below 65% is considered a reactive operation, 65–84% is average, and 85% or higher is world-class.
Book a demo to see where your current rate ranks.
How is MTTR calculated automatically on a live dashboard?
MTTR pulls directly from work order timestamps — total repair hours divided by number of repairs per asset class — with no manual entry required.
Start free on Oxmaint to see it calculated from your first closed ticket.
What counts as a healthy planned-to-reactive maintenance ratio?
World-class operations run 85–90% planned work. Most facilities sit closer to 50–70% planned, meaning a large share of the budget still goes to reactive repairs.
How often should facility KPI dashboards be reviewed?
Operational KPIs like MTTR, backlog, and PM compliance are best reviewed weekly. Cost-per-asset and portfolio trends work better on a monthly cycle.
Book a demo to see a role-based review setup.
Can a dashboard break down cost per asset across an entire portfolio?
Yes — when spend is tagged to an asset registry, cost per asset and cost per square foot roll up automatically by building, property class, or full portfolio.
Try Oxmaint free to configure your asset hierarchy.
Stop Reporting on Last Month's Maintenance
See MTTR, PM compliance, planned-to-reactive ratio, backlog, and cost per asset calculated automatically from the work orders your team is already closing.