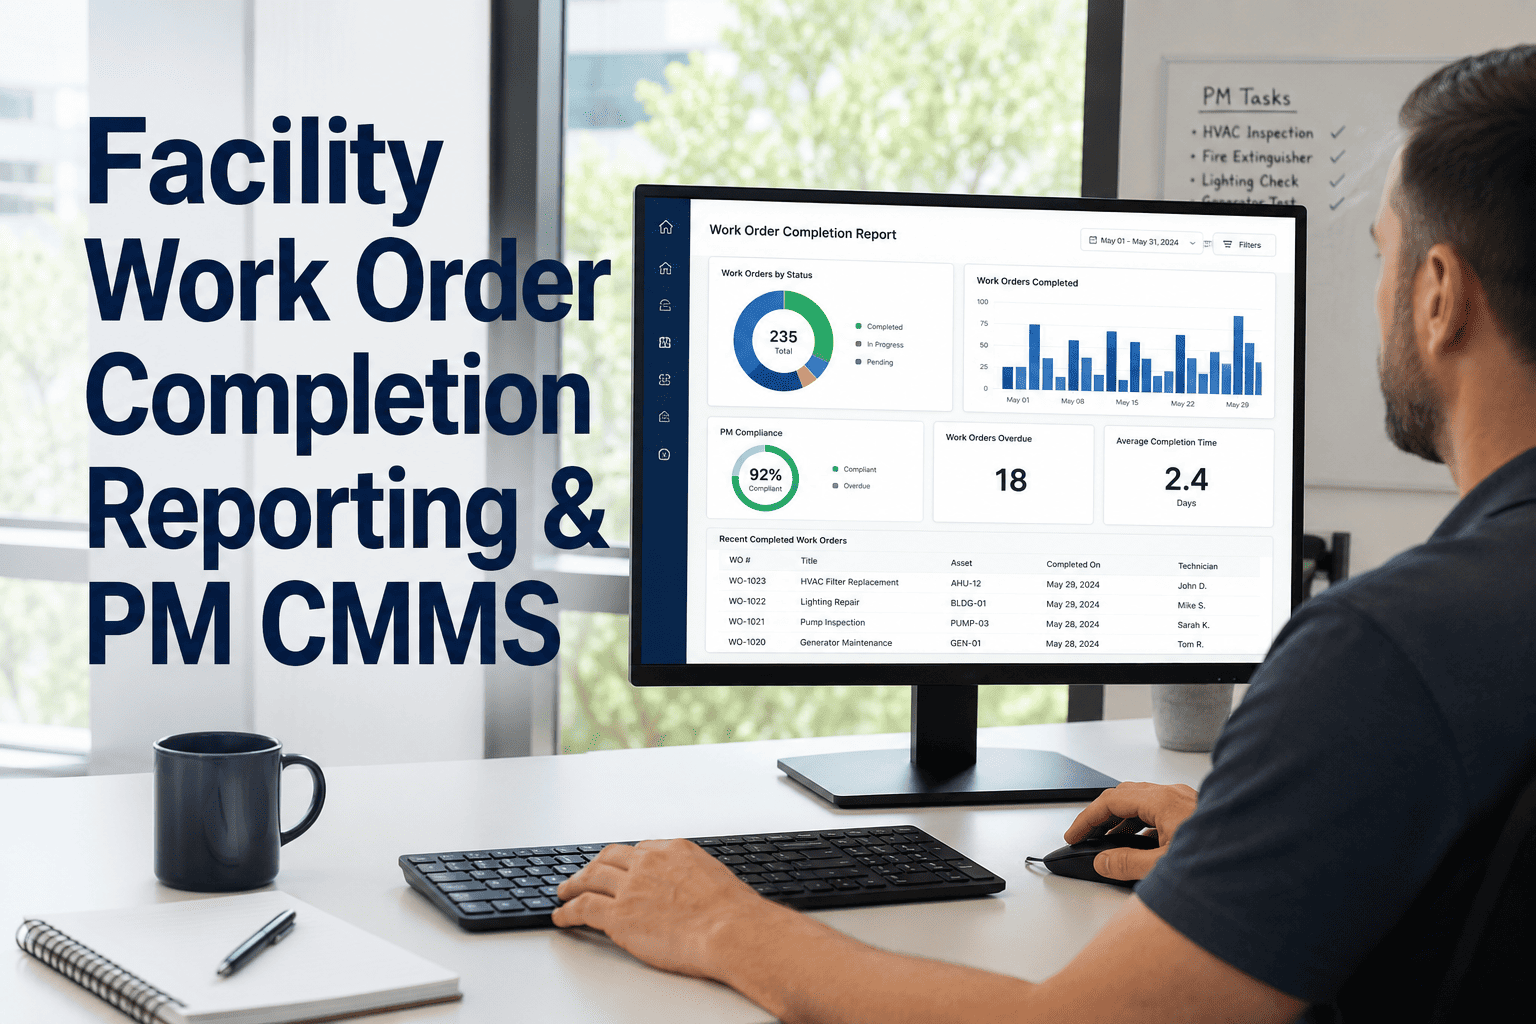
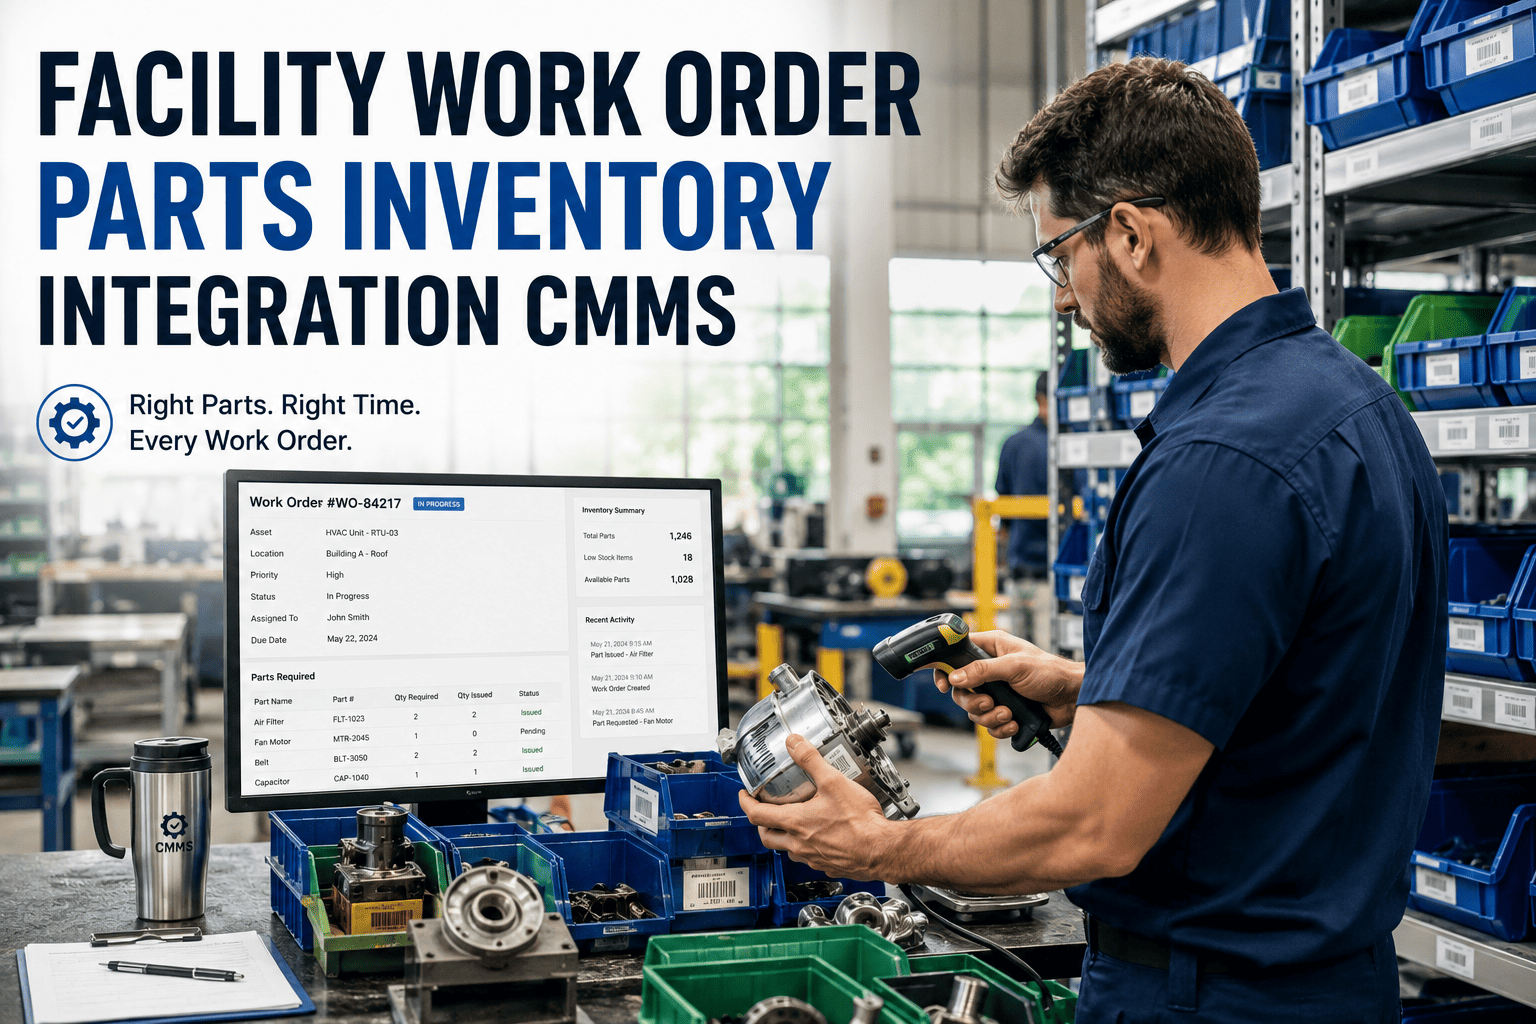
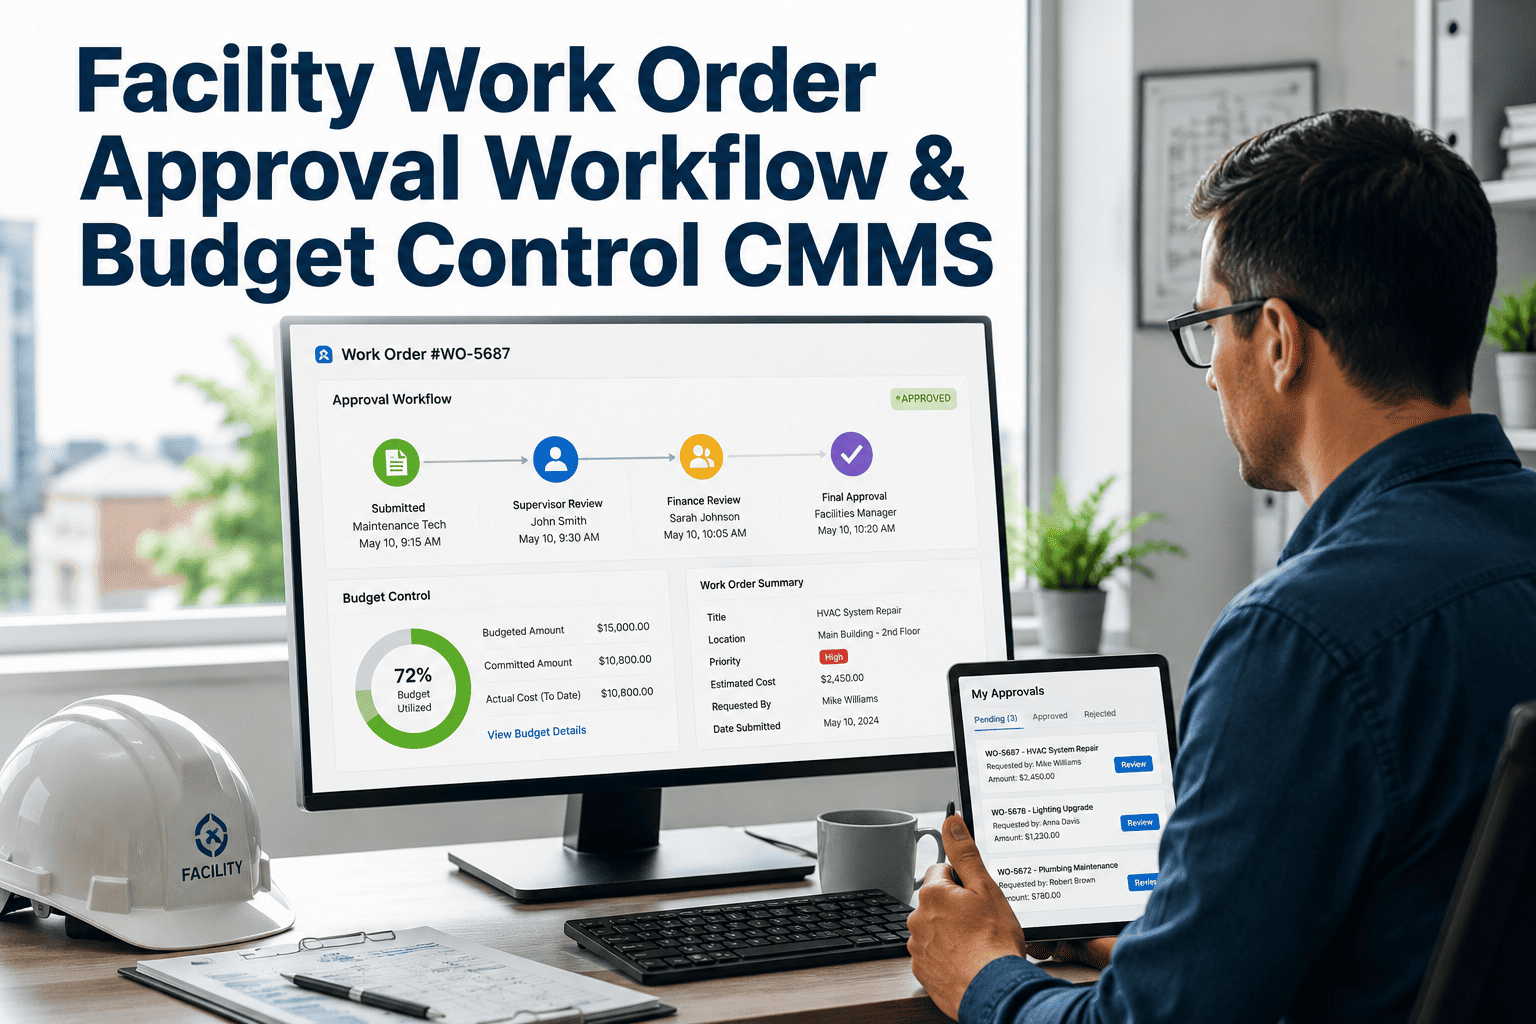
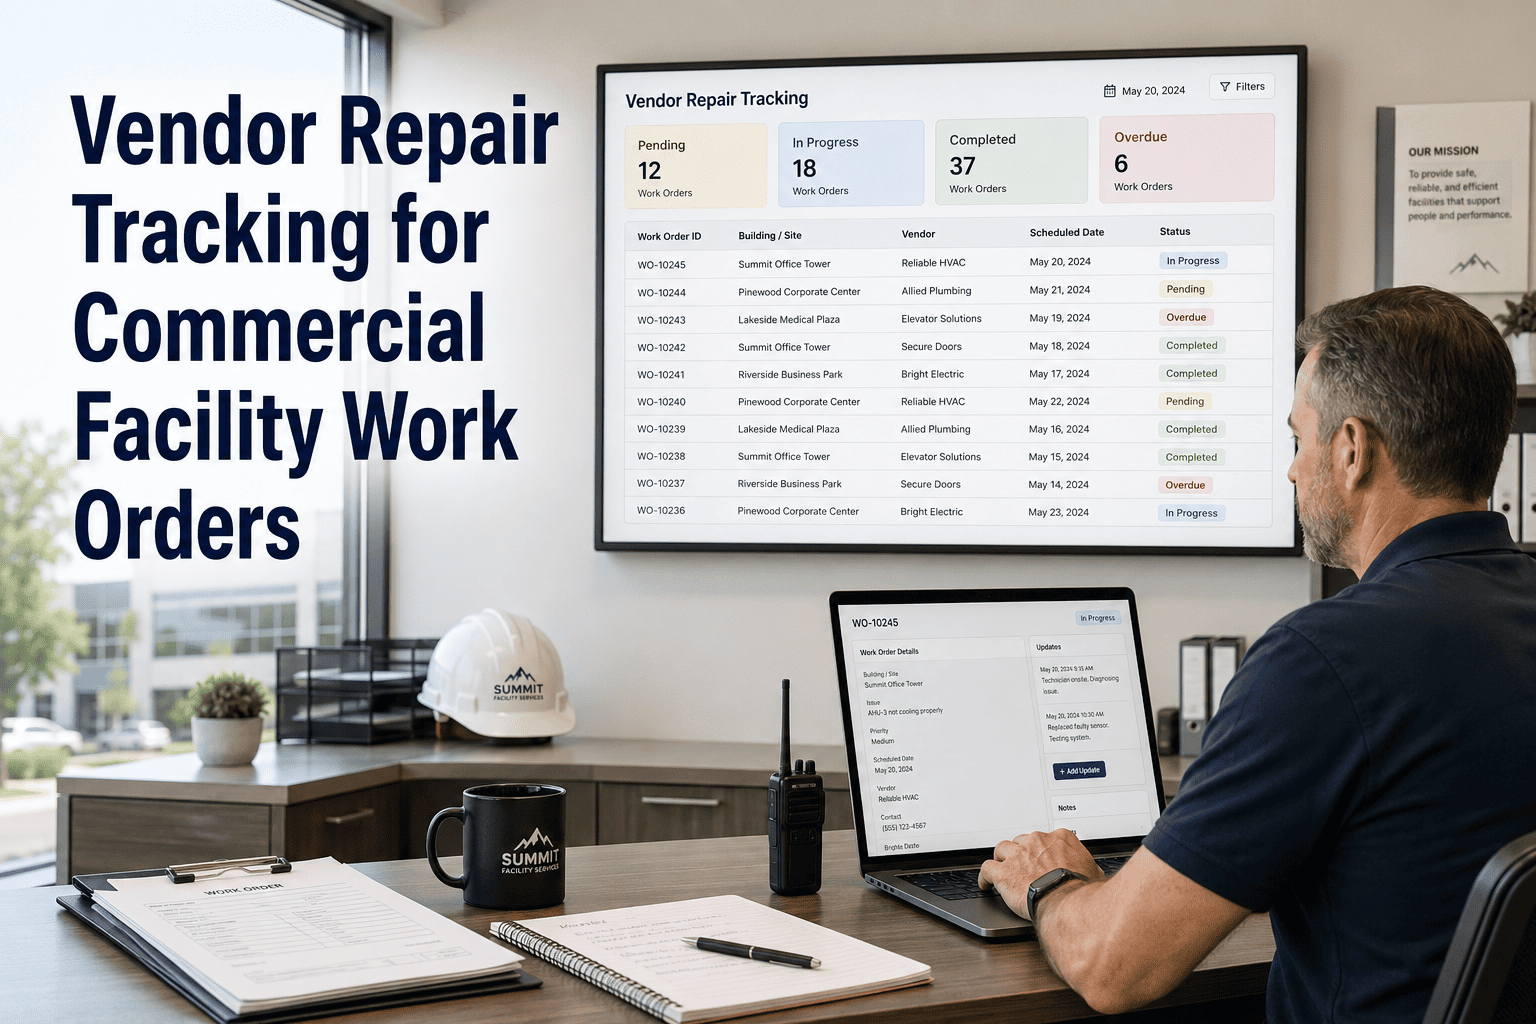
A facility director closes the quarter, opens the budget variance report, and sees that R&M spend is 18% over plan — with no clear answer to the CFO's inevitable follow-up question of "which assets, which cost lines, and why?" This is the modal experience of facility budget control in mid-sized commercial buildings, hospital campuses, and manufacturing sites across the US. The root cause is not spending. It is data capture. A typical facility work order records what was done and when it was closed, but the cost fields — labor hours by rate, parts consumed at unit cost, contractor invoice amounts, allocated overhead — are captured in four different systems (CMMS, payroll, ERP inventory, AP) and reconciled monthly by a spreadsheet that nobody enjoys building. By the time the variance report surfaces the problem, the asset has already accumulated three more work orders, the contractor has already invoiced the next scope, and the budget-control conversation happens 8-12 weeks after the moment when it could have changed the outcome. A Deloitte facility operations benchmark found that mid-sized commercial operations that capture full cost data at the work-order level in real time reduce annual R&M budget variance by 22-34% compared with peers relying on end-of-month reconciliation — not because they spend less, but because they see spend faster and can course-correct within the same budget cycle. OxMaint's Work Order Cost Capture module connects labor hours, parts consumption, contractor charges, and overhead allocation to every work order at the moment they occur — with the asset history, GL mapping, and cost-center allocation embedded so that budget variance surfaces the same day, not the following month. This landing page walks the four cost sources that must connect to every work order, the budget-vs-actual visibility that stops overrun before it compounds, the asset lifetime cost curve that determines when repair economics flip to replacement, the category-and-month variance heatmap that focuses corrective attention where it matters most, and the site-cost hierarchy that lets facility teams roll spend up from a single work order to a portfolio-level dashboard — including how a purpose-built work order cost capture for labor, parts, and contractor charges in a CMMS converts scattered cost data into a controllable operating budget.
Work Order Automation · Cost Capture · Budget Control
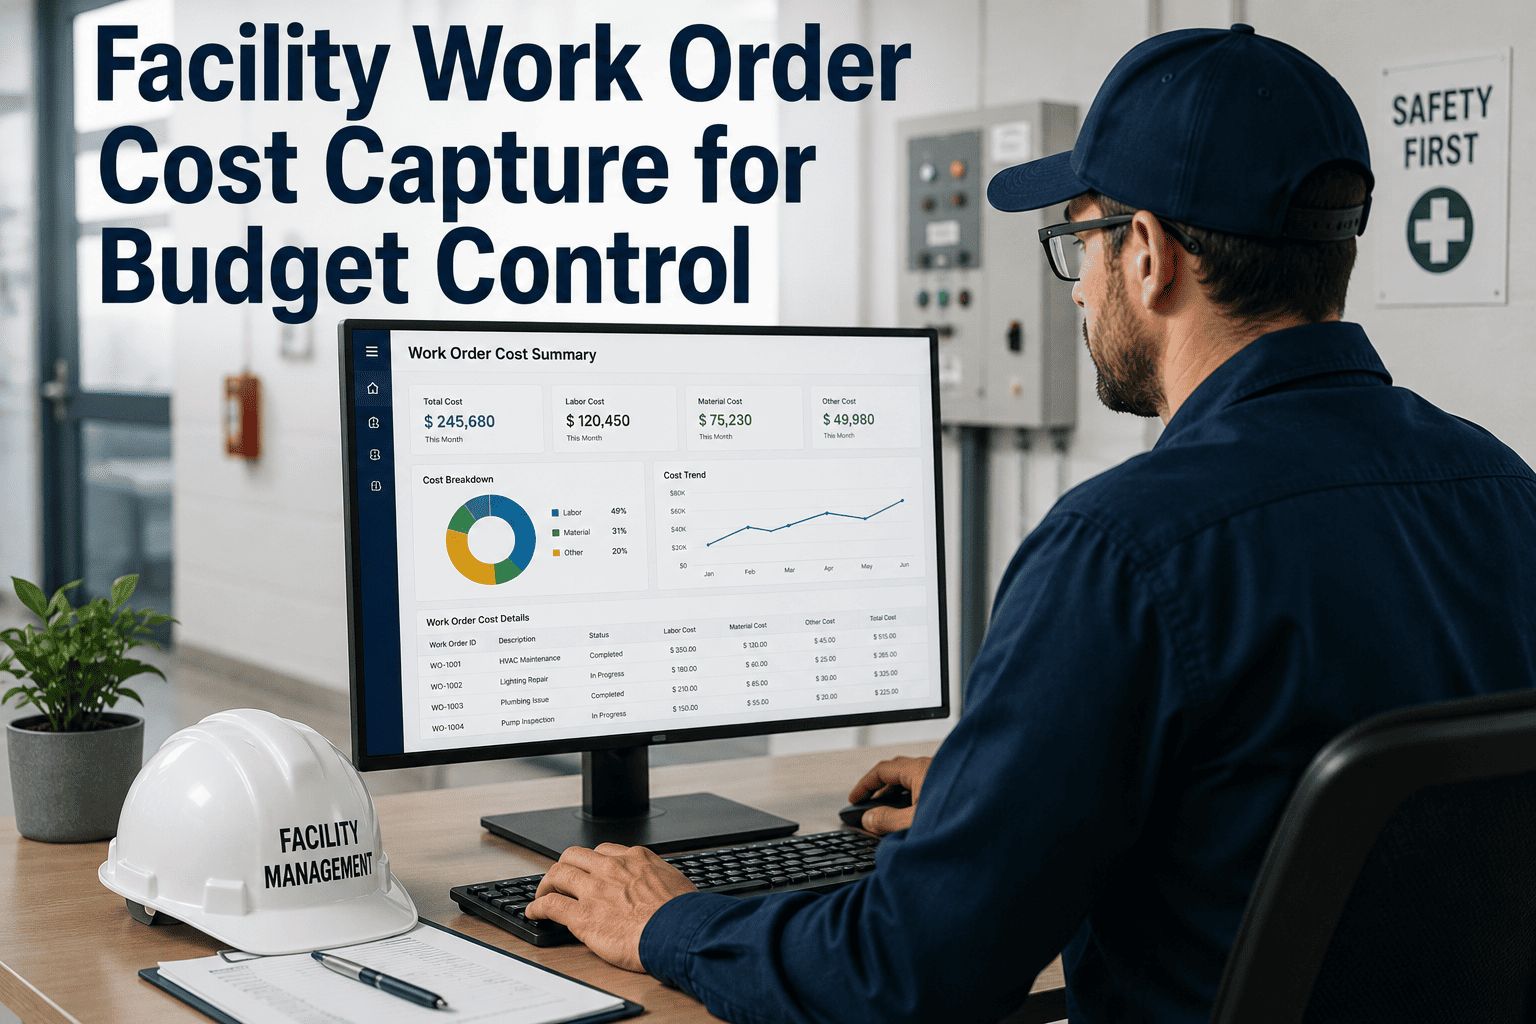
Facility Work Order Cost Capture for Budget Control
Labor hours · parts consumption · contractor charges · overhead allocation — connected to every work order at the moment they occur, with GL mapping and asset history embedded for real-time budget variance visibility.
22-34%
Reduction in annual R&M budget variance for facility operations that capture cost at the work-order level in real time · Deloitte benchmark
4
Distinct cost sources that must connect to every work order: labor · parts · contractor · overhead
8-12 wks
Typical lag between overrun occurrence and variance report surfacing under manual monthly reconciliation
Same-day
Variance visibility when cost capture happens at the work order rather than in the month-close cycle
$18-45/sq ft
Typical annual facility R&M spend range for commercial buildings — the cost line that budget control targets · IFMA/BOMA benchmarks
45-60%
Portion of total facility R&M cost typically consumed by contractor and vendor charges — the biggest cost-capture blind spot
1.5-3.0x
Repair-to-replace ratio at which asset economics flip — impossible to compute without asset lifetime cost history
$2.8M
Recoverable budget authority in a 500K-sq-ft facility from moving variance visibility from monthly to real-time
The Four Cost Sources That Must Connect to Every Work Order
A work order without cost data is a service record, not a budget instrument. The confluence diagram below shows the four cost sources OxMaint captures on every work order — with the source system, capture mechanism, and typical share of total facility spend for each. This is the data foundation behind a real-time asset lifetime cost tracking CMMS workflow for facility teams.
In-House Labor Hours
Mobile-app time capture by technician · start/pause/stop against WO ID · burdened rate per craft · auto-posted at closure
Diagnostic time · repair time · travel · documentation · captured to the tenth of an hour
Parts & Materials Consumption
Inventory scan or manual entry at consumption · unit cost from FIFO/weighted-average · auto-posted to WO cost ledger
Warehouse-stocked parts · direct-buy items · consumables · special-order materials · full unit-level trace
Contractor & Vendor Charges
PO-linked invoice ingestion · 3-way matched against WO scope · labor · parts · after-hours premiums
Trade contractors · service call charges · specialty vendors · after-hours labor · line-item captured
Overhead Allocation
Rule-based allocation applied at closure · configurable percentage of direct cost or per-WO fixed rate
Facility admin · dispatch · supervision · IT · insurance · allocated per organisational policy
Total Work Order Cost
Fully allocated · GL-mapped · cost-center tagged · asset-linked
Every dollar of facility spend traceable to (1) a specific work order, (2) a specific asset, (3) a specific cost center, and (4) a specific GL account · from the moment the labor is logged or the invoice is matched.
Budget vs Actual: Where the Overrun Actually Comes From
A single overspend figure at the site level tells the facility director nothing actionable. The category-level budget-vs-actual breakdown below is what drives targeted correction — and where OxMaint's dashboard focuses monthly review attention.
Electrical & Lighting
-4.4% under
Plumbing Systems
+18.5% over
General Repair
-1.2% under
Life Safety & Fire
-5.7% under
Elevator & Vertical
+9.1% over
Grounds & Exterior
-4.9% under
Total Site Budget vs Actual
$1,340K planned · $1,467K actual
+9.5% over plan · $127K variance to investigate
Real-time variance · not month-end surprises
Connect Every Cost Source to Every Work Order
OxMaint's Work Order Cost Capture module rolls labor, parts, contractor charges, and overhead into every work order — with asset history, GL mapping, and cost-center allocation embedded. Facility directors stop guessing why the budget slipped. CFOs stop hearing about overruns after the fact.
Asset Lifetime Cost: The Curve That Signals Repair-vs-Replace
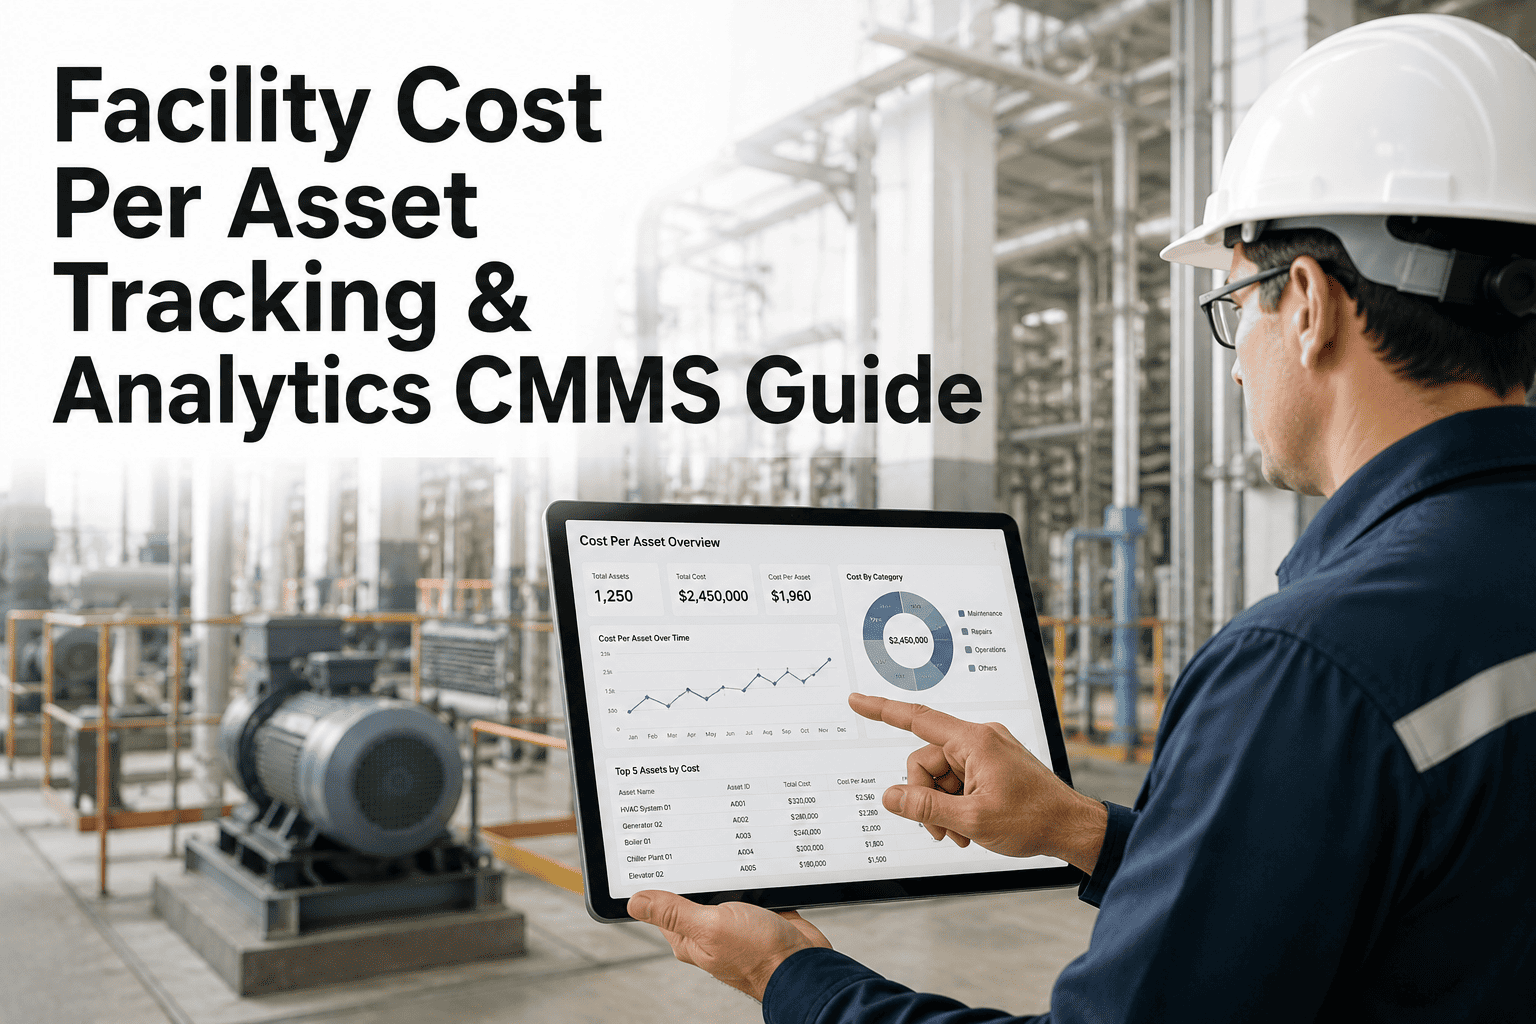
A single work order is a data point. An asset's cumulative repair cost over 24-60 months is a decision instrument. The curve below shows how OxMaint accumulates every cost source across every work order into an asset lifetime cost record — the visualization that identifies the exact moment when repair economics flip to replacement.
50% replacement cost threshold · repair-vs-replace decision point
$5K
$12K
$21K
$28K
$36K
$45K
$56K
$67K
$78K
$86K
M6
M12
M18
M24
M30
M36
M42
M48
M54
M60
Total 60-month repair cost
$86,000
51.2% of current replacement cost
Threshold crossed
Month 54
Auto-flagged for capital planning review
Recommended action
Replacement
Continued repair economics no longer favourable · move to FY capital plan
Category × Month Variance Heatmap: Focus Attention Where It Matters
A rolling category-and-month variance heatmap is what a mature facility team reviews every 30 days to detect emerging cost patterns before they compound. The grid below shows an 8-category × 6-month variance matrix — the same view OxMaint's dashboard surfaces automatically.
Category ▼ · Month ►
M-6
M-5
M-4
M-3
M-2
M-1
HVAC Systems
-2%
-4%
+9%
+18%
+31%
+42%
Electrical
-6%
-3%
+1%
-5%
-8%
-4%
Plumbing
+2%
+11%
+15%
+22%
+19%
+14%
General Repair
+3%
0%
-2%
+1%
-3%
-4%
Life Safety
-5%
-7%
-6%
-4%
-8%
-3%
Elevator
+2%
+8%
+12%
+3%
+9%
+4%
Grounds
-3%
-6%
-4%
+2%
-5%
-4%
Other
+1%
-1%
+2%
+3%
+1%
-2%
Under budget
Within tolerance
Watch
Investigate
Alert
Pattern surfaced automatically
HVAC category shows a 6-month escalating pattern from -4% to +42% — indicating an emerging systemic driver rather than a one-off event. Auto-flagged for asset-level drill-down. Plumbing shows sustained elevation but not escalation — different remediation profile.
Cost Hierarchy: Rolling Up from Work Order to Portfolio
A single work order's cost matters to the facility coordinator who closed it. The portfolio-level roll-up matters to the CFO. The hierarchy below is how OxMaint aggregates cost data from the WO up through the asset, cost center, building, and portfolio — with drill-down at any level.
Level 1
Portfolio
$8.47M
Total facility R&M spend across all sites · CFO / VP Facilities view
Level 2
Building / Site
$1.47M
Per-site R&M spend · Facility Director view · site benchmarking & portfolio comparison
Level 3
Cost Center
$482K
Per-cost-center spend · Facility Manager view · departmental chargeback & allocation
Level 4
Asset
$86K
Per-asset lifetime spend · Reliability Engineer view · repair-vs-replace decision
Level 5
Work Order
$1,772
Per-WO cost with full breakdown · Facility Coordinator view · operational reconciliation
Operational KPIs for a Work Order Cost Capture Program
Real-time cost capture is only credible when the completeness metrics stay above target. The six KPIs below are what a mature facility operation tracks continuously — the same set anchored inside a modern facility budget variance dashboard in a CMMS.
Target: above 95%
Cost Capture Completeness
Percentage of closed work orders with all four cost sources (labor · parts · contractor · overhead) captured. Below 80% breaks budget variance reporting and forces month-close reconciliation.
Target: 100%
GL & Cost-Center Mapping
Percentage of closed WOs with correct GL account and cost-center allocation. Anything less forces manual reclassification and undermines chargeback accuracy.
Target: same-day
Variance Visibility Latency
Elapsed time from cost event (labor logged · invoice matched · parts consumed) to variance report reflecting it. Same-day is the target; monthly is the historical baseline that misses the correction window.
Target: under 8%
Budget Variance Magnitude
Category-level actual-vs-plan variance at quarter close. Above 15% signals systemic mis-planning or emerging asset failure patterns that require budget rebasing.
Target: above 90%
Asset Cost History Completeness
Percentage of assets with 24+ months of complete cost history captured. Below 60% cripples repair-vs-replace decision-making and capital planning accuracy.
Target: under 3%
Reclassification Rate
Percentage of posted cost entries that require manual reclassification during month-close. Elevated rates indicate GL mapping errors that will compound into variance report distortion.
Expert Review
"
In 19 years serving as facility CFO and later as an independent facility financial consultant, the single most predictable pattern I see across mid-sized commercial and healthcare operations is a facility team that closes work orders competently and then loses the cost trail somewhere between the CMMS and the general ledger. The facility manager knows what got done. The controller knows what got paid. Nobody has a complete view of what the individual asset cost or which categories are driving the variance until three or four weeks after month-close — at which point the corrective conversation is stale. The economic case for real-time work order cost capture is unusually clear. A Deloitte benchmark I reference frequently found 22-34% reduction in annual R&M budget variance for facility operations that capture at the WO level in real time. That is not a hypothetical; that is the delta between operations that see spend as it happens and operations that see spend after the month has closed. OxMaint's cost capture module is one of the very few implementations I have audited that treats the labor entry, the parts consumption, the contractor invoice, and the overhead allocation as connected events on the same work order rather than four separate reconciliation problems. The facility director stops guessing. The CFO stops flinching. And the repair-vs-replace conversation happens 12-18 months earlier — which is where the largest asset-level savings actually accumulate.
Charlotte Nkomo-Kessler, CPA, CFM, MCR
Facility Financial Consultant · 19 years facility CFO and independent financial consulting across US commercial, healthcare, and manufacturing operations · Certified Public Accountant · Certified Facility Manager · Master of Corporate Real Estate · Specialism in facility budget control and CMMS-to-GL integration
Frequently Asked Questions
Q1
How does OxMaint capture in-house labor hours against work orders in real time?
The OxMaint mobile app supports
start/pause/stop time capture against a specific work order ID with a single tap. Technicians log their diagnostic time, repair time, travel time, and documentation time separately, and the platform applies the correct burdened labor rate per craft (mechanical · electrical · plumbing · general) from the payroll master. Time entries auto-post to the WO cost ledger at closure with no manual re-entry required. For technicians who prefer end-of-day batch entry, the same interface supports retroactive time logging with configurable rules for maximum retroactive window.
Book a demo to see the mobile time capture workflow.
Q2
How does the platform handle parts cost when we use a warehouse management system separate from OxMaint?
OxMaint supports bidirectional integration with major WMS and inventory platforms (SAP, Oracle, NetSuite, Fishbowl, Cin7). When a technician consumes parts against a work order, the consumption posts to the WMS in real time (reducing on-hand quantity) and pulls the current unit cost (FIFO, weighted average, or standard cost per your organisational policy) back into the WO cost ledger. For parts consumed without WMS entry (direct-buy items, emergency runs to a hardware store), the technician logs the item and cost against the WO directly. Both paths produce the same cost record structure.
Q3
Can OxMaint show asset-level cost history including work orders from before we deployed the system?
Yes, through
historical cost data ingestion during implementation. Cost history from your prior CMMS, ERP, or accounting system imports into the asset record with source-system attribution so that pre-deployment work orders are visible in the lifetime cost curve. Data quality naturally improves as new work orders are captured through the OxMaint workflow — most operations reach fully-reliable asset lifetime cost data within 12-18 months of go-live. For repair-vs-replace decisions requiring longer history, the imported baseline plus the current period usually provides enough trend visibility to support the capital planning conversation.
Read more on cost data ingestion during implementation.
Q4
How is the overhead allocation calculated and applied — is it configurable per organisation?
Yes. Overhead allocation is fully configurable per organisation and per cost-center pool. Common configurations include: a fixed percentage of direct cost (e.g. 8% of labor + parts + contractor), a per-WO fixed rate (e.g. $50 per work order for admin/dispatch), a tiered percentage that varies by work order category, or a driver-based allocation (e.g. proportional to labor hours). The platform supports multiple concurrent overhead pools if the organisation allocates facility admin, IT support, and insurance separately. Allocation rules are versioned and change-controlled so historical work orders retain the allocation logic that was in effect when they were closed.
Q5
What is the realistic payback window for a work-order-level cost capture program?
For a facility operation with
$5M-$25M annual R&M spend, the Deloitte-benchmarked 22-34% reduction in budget variance typically translates to
$1.1M-$8.5M in recovered budget authority annually — not because spending drops, but because emerging patterns get caught within the correction window instead of after month-close. OxMaint subscription plus implementation cost for that spend range is typically 3-6% of the recovered budget authority. Payback is usually visible on the variance dashboard within 90 days of full cost capture reaching 90%+ WO coverage, and full ROI is measurable within the first 12 months. Beyond the direct variance savings, the asset lifetime cost curve typically identifies 2-4 repair-vs-replace candidates within the first year that would otherwise have consumed another 12-18 months of accumulated repair cost.
Start an OxMaint free trial to model your facility's specific cost capture profile.
From four disconnected cost systems to one connected work order
Labor · Parts · Contractor · Overhead — Connected to Every Work Order · Every Asset · Every Budget Line
OxMaint's Work Order Cost Capture module gives facility management teams real-time visibility into what every asset costs, where every dollar of the R&M budget went, and which categories are trending toward variance before month-close reveals it. The cost infrastructure that turns facility maintenance from an opaque cost center into a budget-controllable line item.