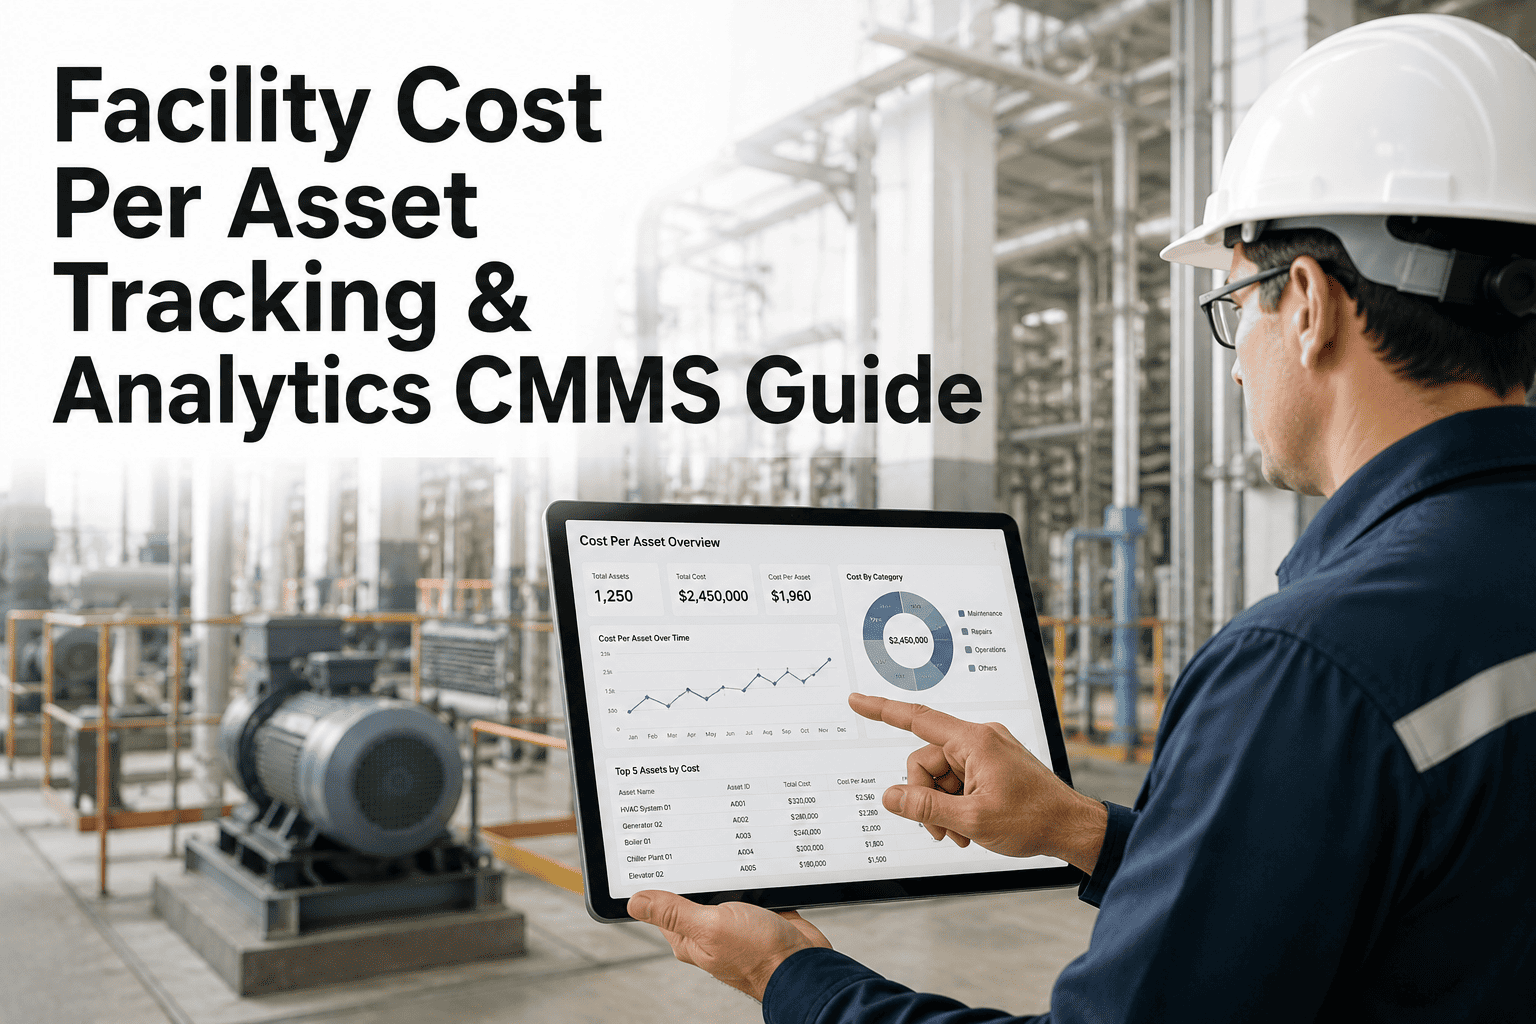
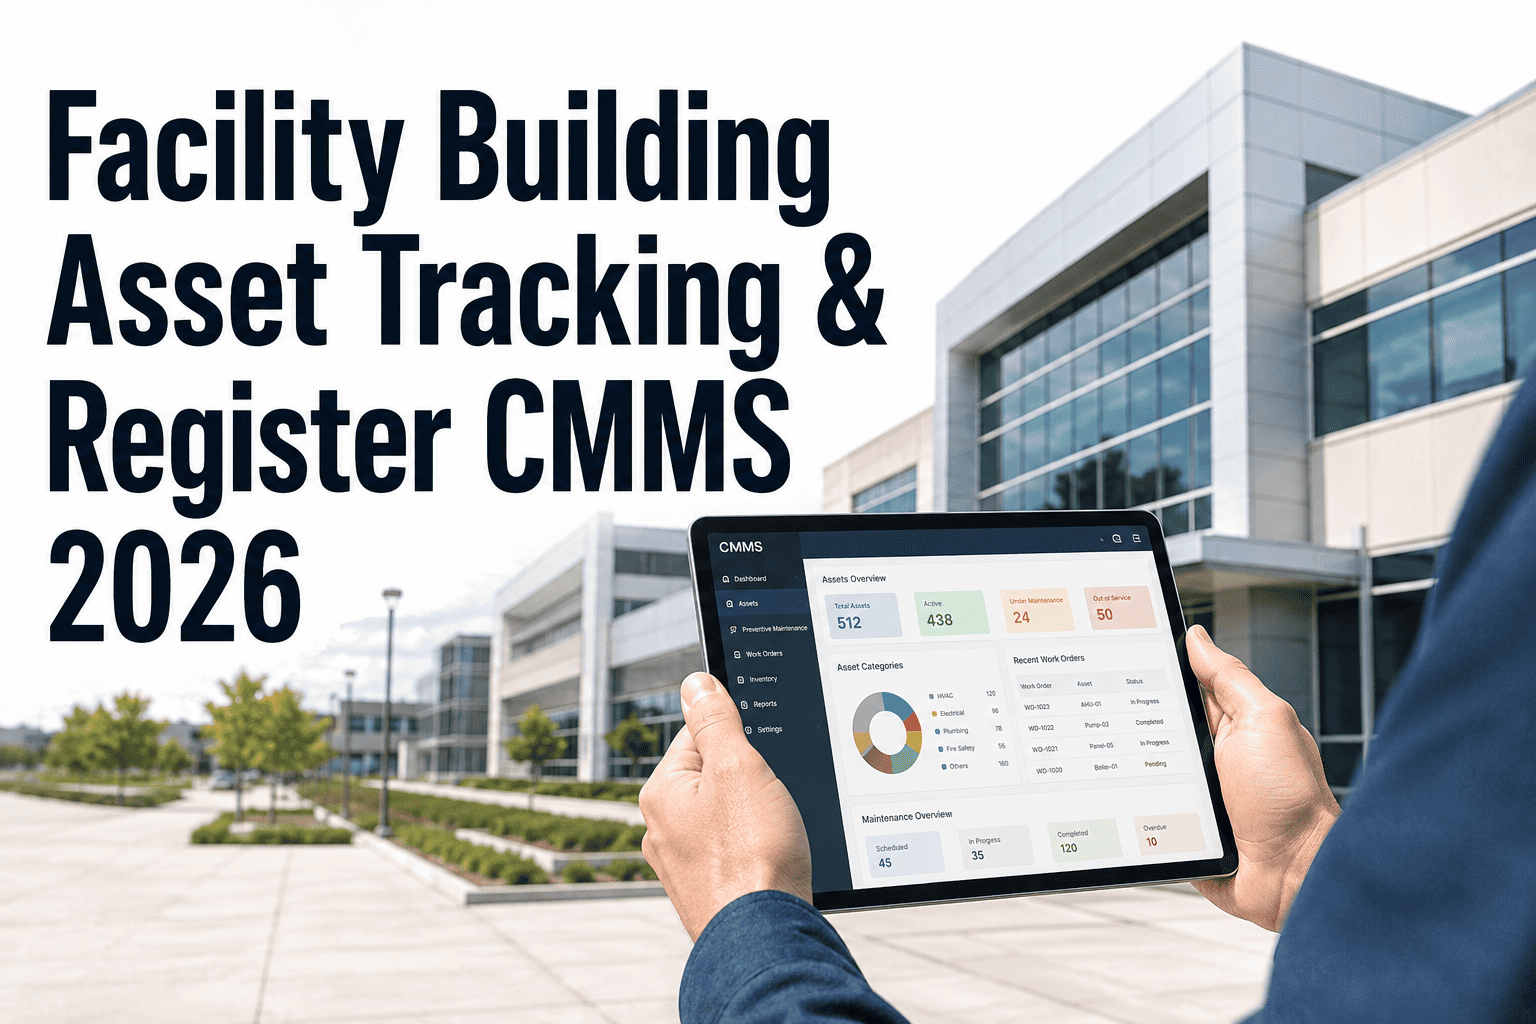
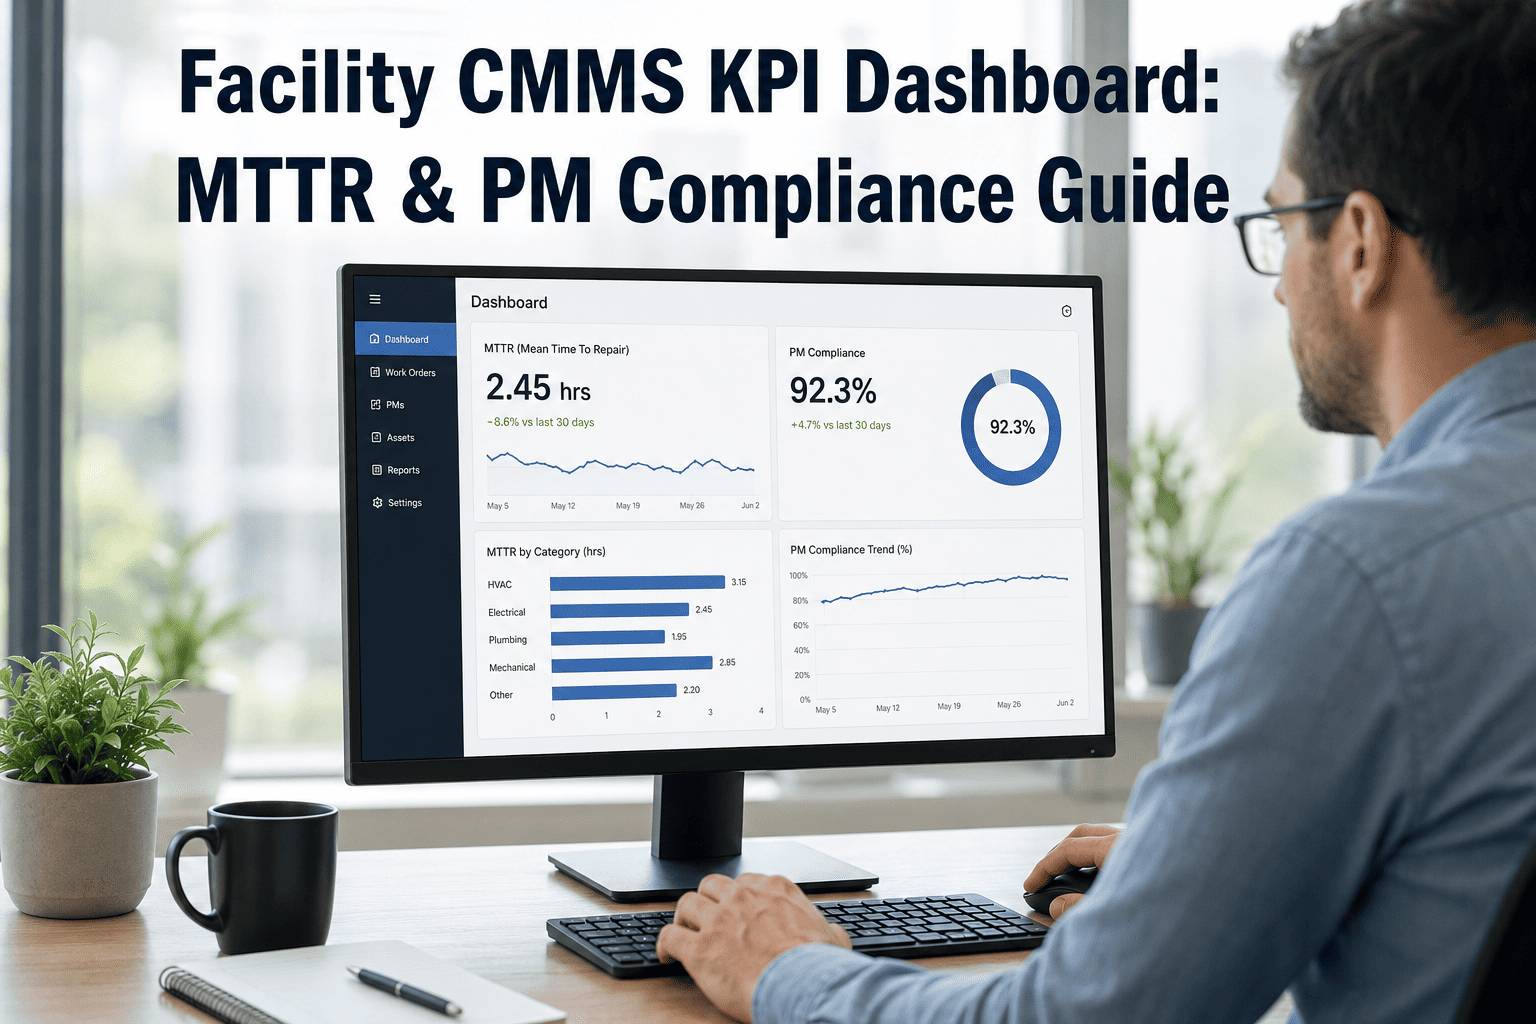
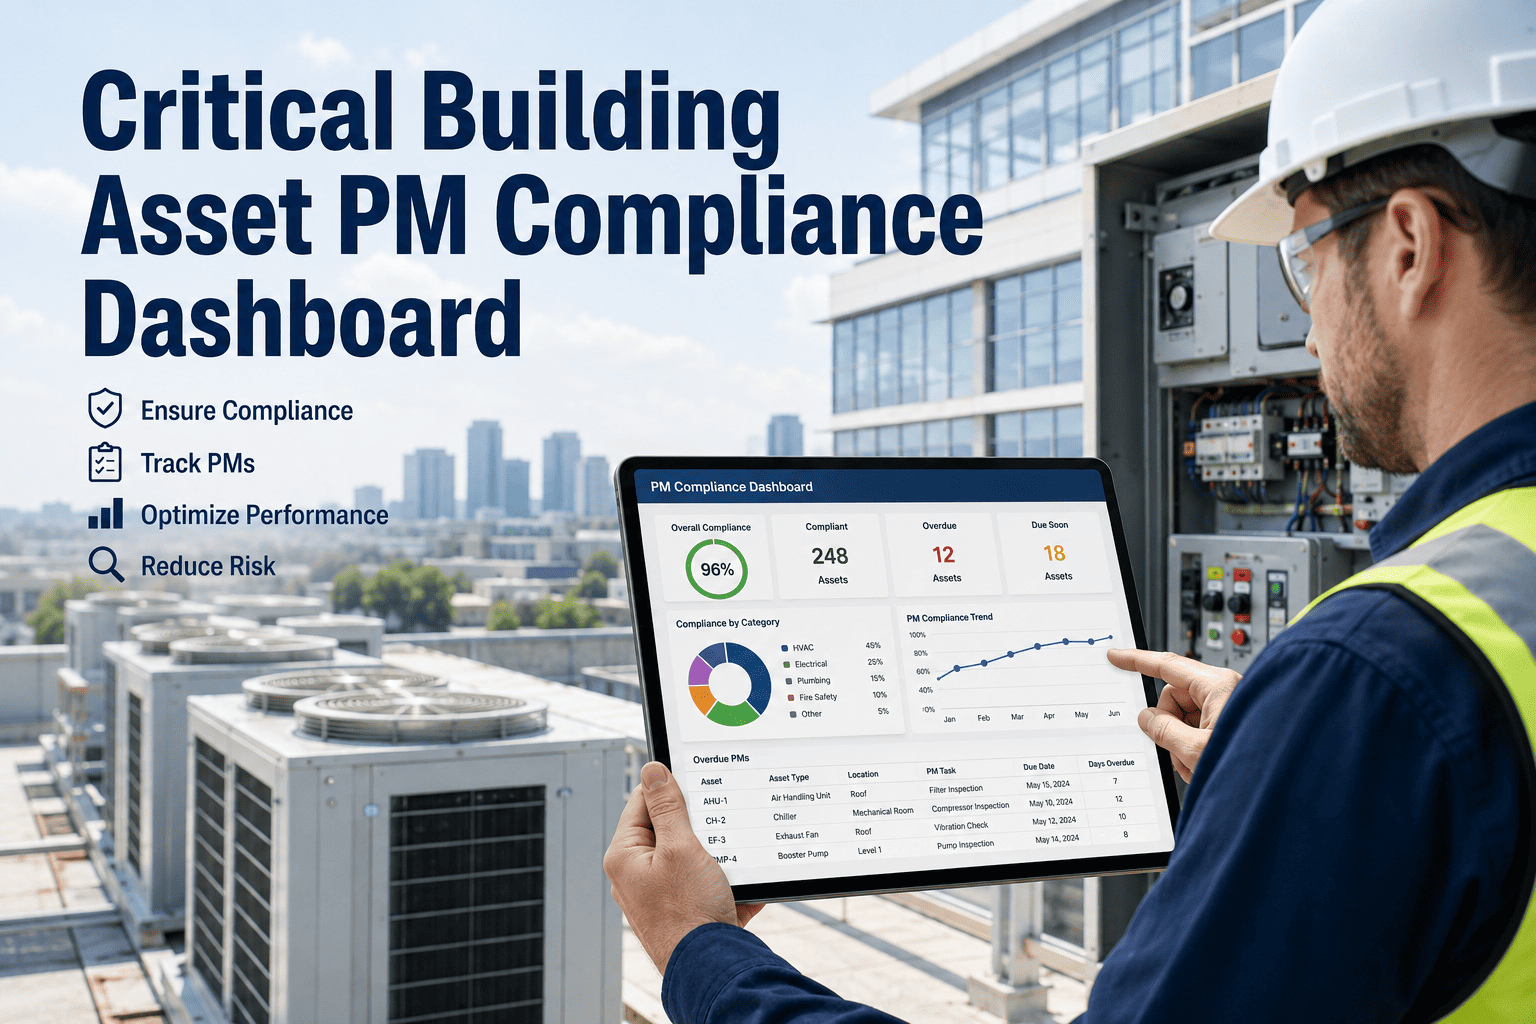
A facility that looks maintained is not the same as a facility that is ready. Readiness is a measurable state — it answers whether preventive maintenance is on schedule, whether critical systems have open risks, whether spare parts are stocked, and whether staffing gaps exist before they become failures. Most facility managers discover readiness problems only after a system goes down, an audit fails, or a tenant complaint escalates to a building owner. Oxmaint's facility maintenance readiness dashboard gives operations directors a live view of PM compliance, open risk items, inspection status, and resource availability — in one screen, updated in real time. For executive teams that make operational decisions without visibility into what is actually ready on the floor, book a demo to see readiness reporting configured for your building portfolio today.
Analytics and Reporting
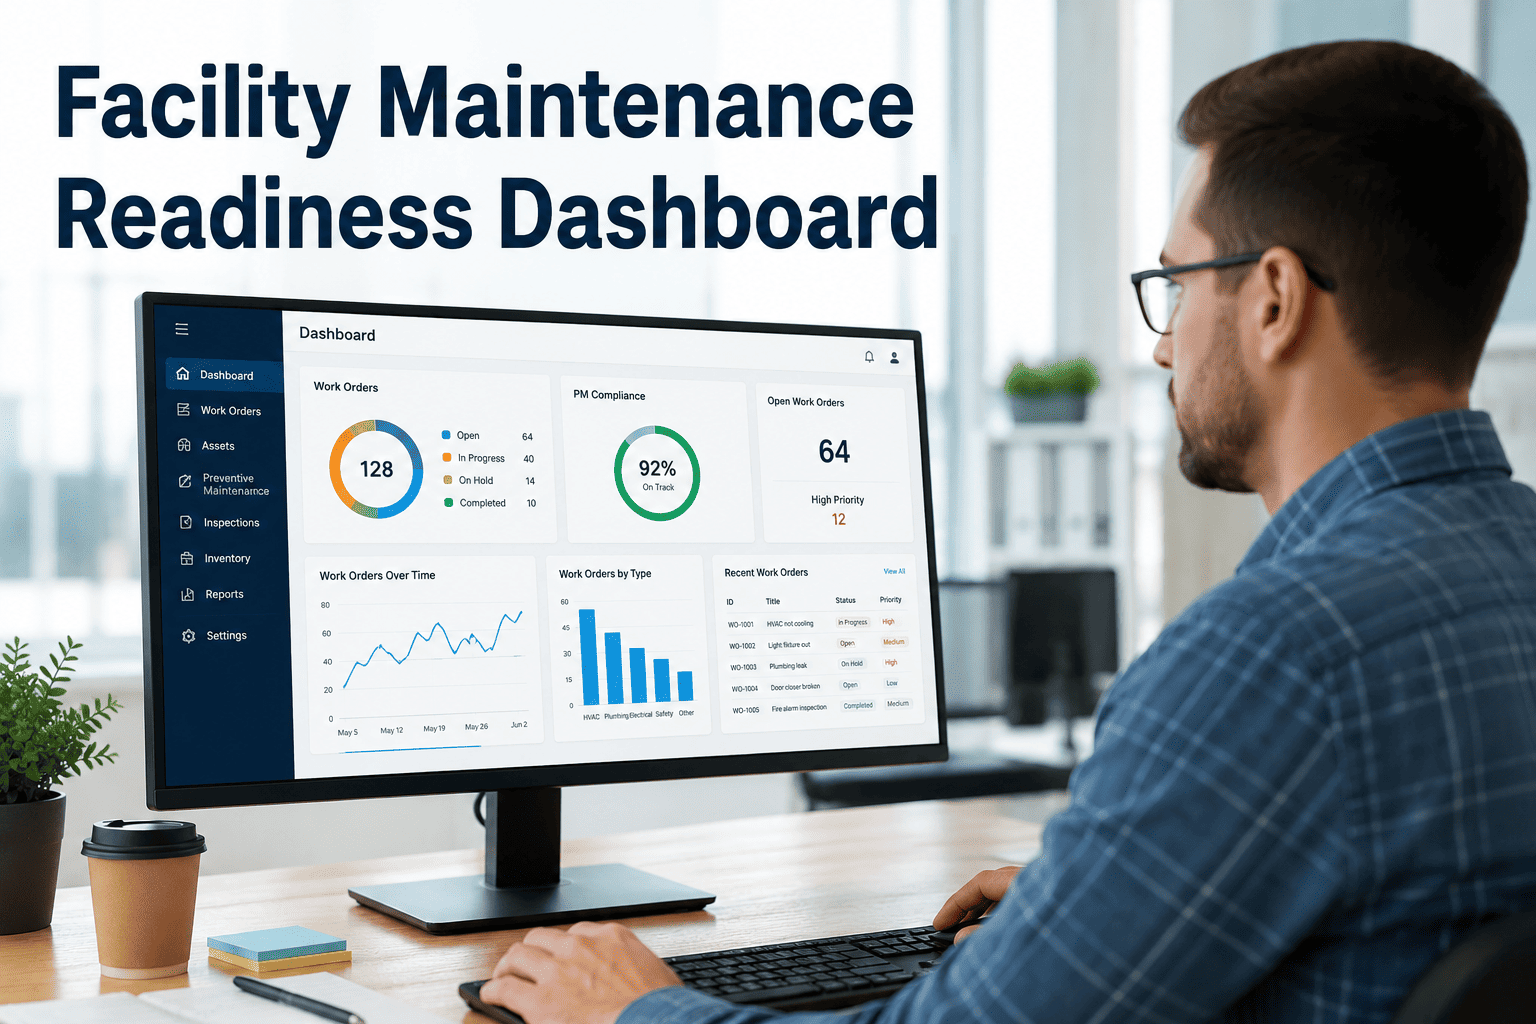
Facility Maintenance Readiness Dashboard
One live view of PM compliance, open risks, inspection status, and staffing — so facility directors know what is ready before systems fail, not after.
Open Risk Items
4 Critical
Parts Availability
74% Stocked
The Readiness Gap
What Facility Directors Cannot See Without a Readiness Dashboard
PM
Which PMs are overdue right now
Monthly maintenance reports show completion rates after the fact. A readiness dashboard shows which assets are in an overdue PM window today — before a failure occurs.
RI
Open risk items by system
Deferred work orders carrying safety or compliance risk accumulate invisibly in the backlog. Readiness scoring surfaces these by building system and urgency tier.
SP
Spare parts gaps for critical assets
A HVAC compressor failure with no spare part in storeroom means days of production or tenant disruption. Readiness dashboards flag critical spare part gaps before the failure event.
SF
Technician coverage gaps by shift
Staffing shortages in specific trades or shifts create readiness vulnerabilities that are invisible until an incident reveals them. Readiness monitoring makes coverage gaps visible and actionable.
Dashboard Modules
Five Readiness Dimensions in One Operational View
01
PM Compliance Score
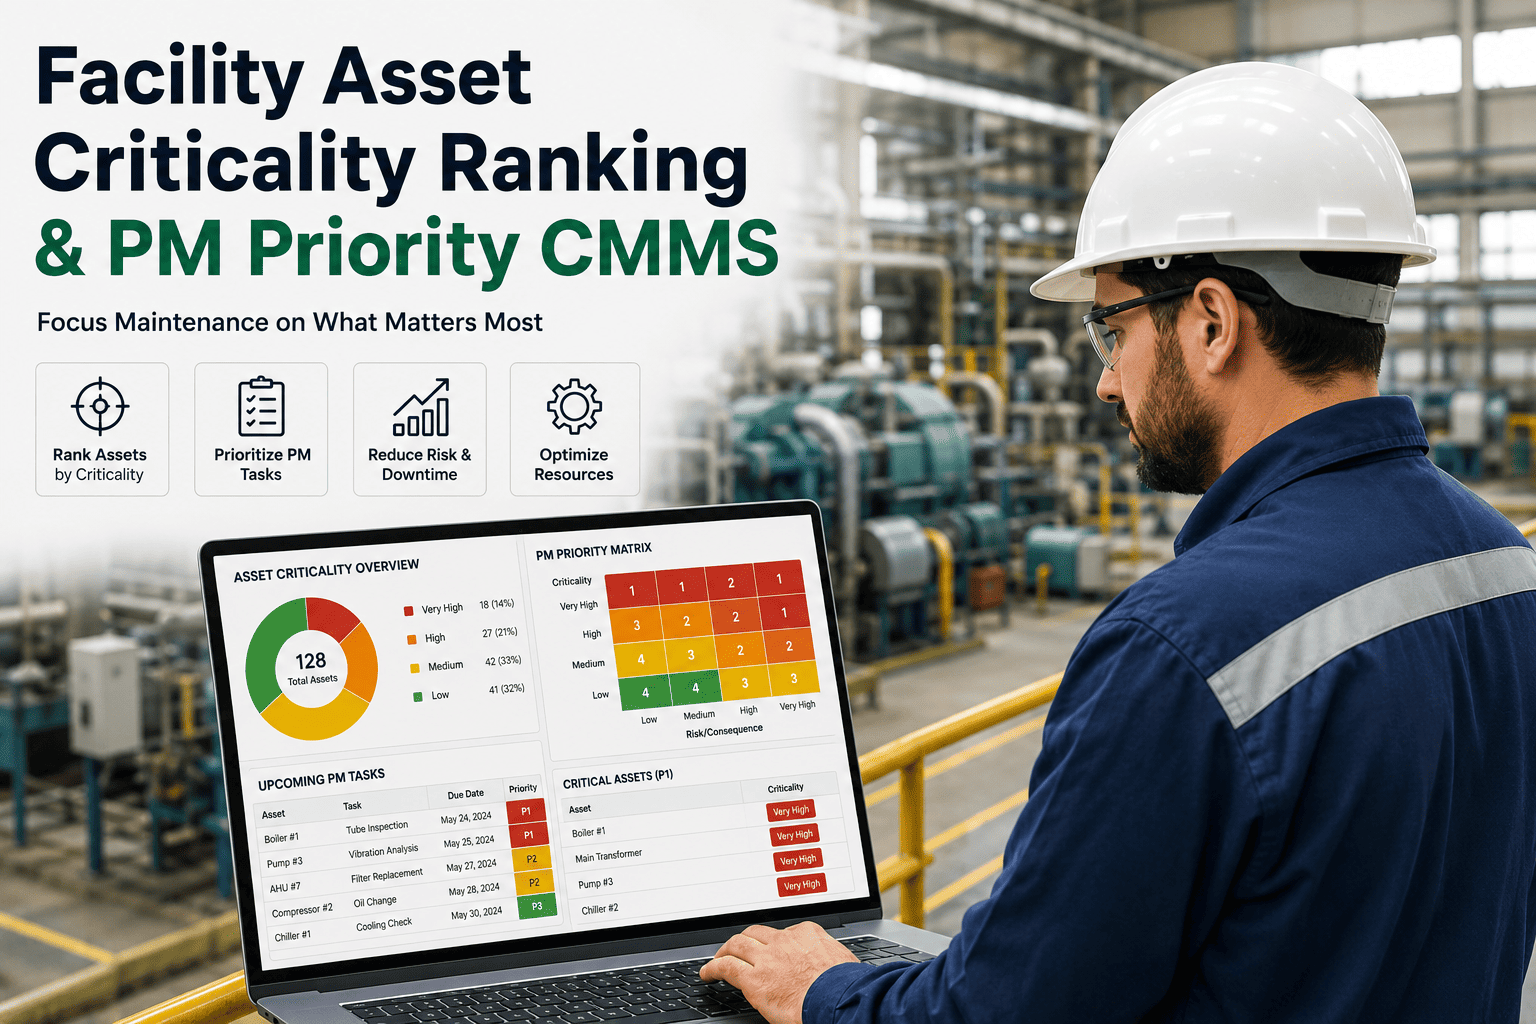
Percentage of scheduled PMs completed on time, by building, system, and technician — with overdue items ranked by asset criticality and failure consequence.
02
Open Risk Register
All deferred corrective work orders carrying a risk flag — categorised by safety, compliance, operational, or financial risk — with aging and escalation status visible in real time.
03
Inspection Readiness
Status of scheduled building inspections — completed, due, overdue — with last inspection score and open action items per building system and zone.
04
Spare Parts Readiness
Critical spare availability status for high-consequence assets — flagging stockout risk against minimum stock levels before the next scheduled PM or predicted failure window.
05
Staffing Coverage Map
Technician availability against scheduled PM workload by trade, shift, and zone — highlighting coverage gaps and enabling reassignment or contractor mobilisation before the gap becomes a missed PM.
Benchmark Data
Readiness Metrics: What High-Performing Facility Teams Achieve
| Readiness Metric |
Industry Average |
Top Quartile |
What Drives the Gap |
| PM compliance rate |
61% |
91% |
Automated scheduling and mobile work order completion |
| Mean time to close risk items |
22 days |
6 days |
Risk-flagged work orders with escalation and priority routing |
| Inspection pass rate |
74% |
96% |
Pre-inspection readiness checks and open action tracking |
| Critical spare availability |
68% |
95% |
Predictive reorder linked to asset health and failure history |
| Unplanned maintenance ratio |
41% |
12% |
Readiness-driven proactive maintenance programmes |
Know your facility's true readiness state — before a system tells you otherwise
Oxmaint's readiness dashboard consolidates PM compliance, risk status, inspection scores, and parts availability into one live operations view.
Expert Review
How Operations Directors Use Readiness Dashboards
"Before Oxmaint, my Monday morning brief was built on last week's data — what failed, what we spent, what we deferred. Now I walk in with a live readiness score for every building. I can see which systems are at risk today and move resources before anything breaks. That shift — from reactive reporting to live readiness — changed how we run the whole portfolio."
OD
Operations Director
Mixed-Use Portfolio, 14 Buildings
"The spare parts readiness module alone recovered its cost in the first quarter. We had a critical pump failure where the spare was theoretically in stock but had been consumed by another job without the system updating. Oxmaint's readiness check flagged that discrepancy two weeks before the pump failed and we were able to reorder in time."
FM
Facilities Manager
Industrial Campus, South India
FAQ
Frequently Asked Questions
How is a readiness dashboard different from a standard maintenance KPI report?
A KPI report tells you what happened — PM completion rate last month, work orders closed last week.
Oxmaint's readiness dashboard tells you what is at risk right now — which PMs are overdue today, which risk items have been open for more than 7 days, and which critical spare parts are below the minimum stock level. The fundamental difference is that readiness data enables action before failure, while KPI reports document performance after the fact. Both have value, but only readiness data prevents incidents.
Can the dashboard be configured for different building types and system criticality levels?
Yes. Oxmaint's readiness dashboard is configurable by asset class, system type, and building function. Criticality weighting for each asset can be set by the facility manager — so a chilled water plant failure in a hospital scores differently to the same failure in a commercial office.
Book a demo to see how the dashboard is configured for your building mix and risk tolerance levels.
Who sees the readiness dashboard — facility managers, directors, or both?
Oxmaint provides role-based dashboard views tailored to each audience. Technicians see their daily work queue and pending PMs. Facility managers see site-level readiness scores, risk items, and inspection status. Operations directors and asset owners see portfolio-level aggregation with building-by-building readiness comparison — enabling cross-site resource allocation decisions based on actual readiness data rather than periodic manual reports.
From reactive management to live facility readiness — in one dashboard
Oxmaint consolidates PM compliance, risk register, inspection status, spare parts, and staffing into a single operations view that keeps facility directors ahead of every failure.