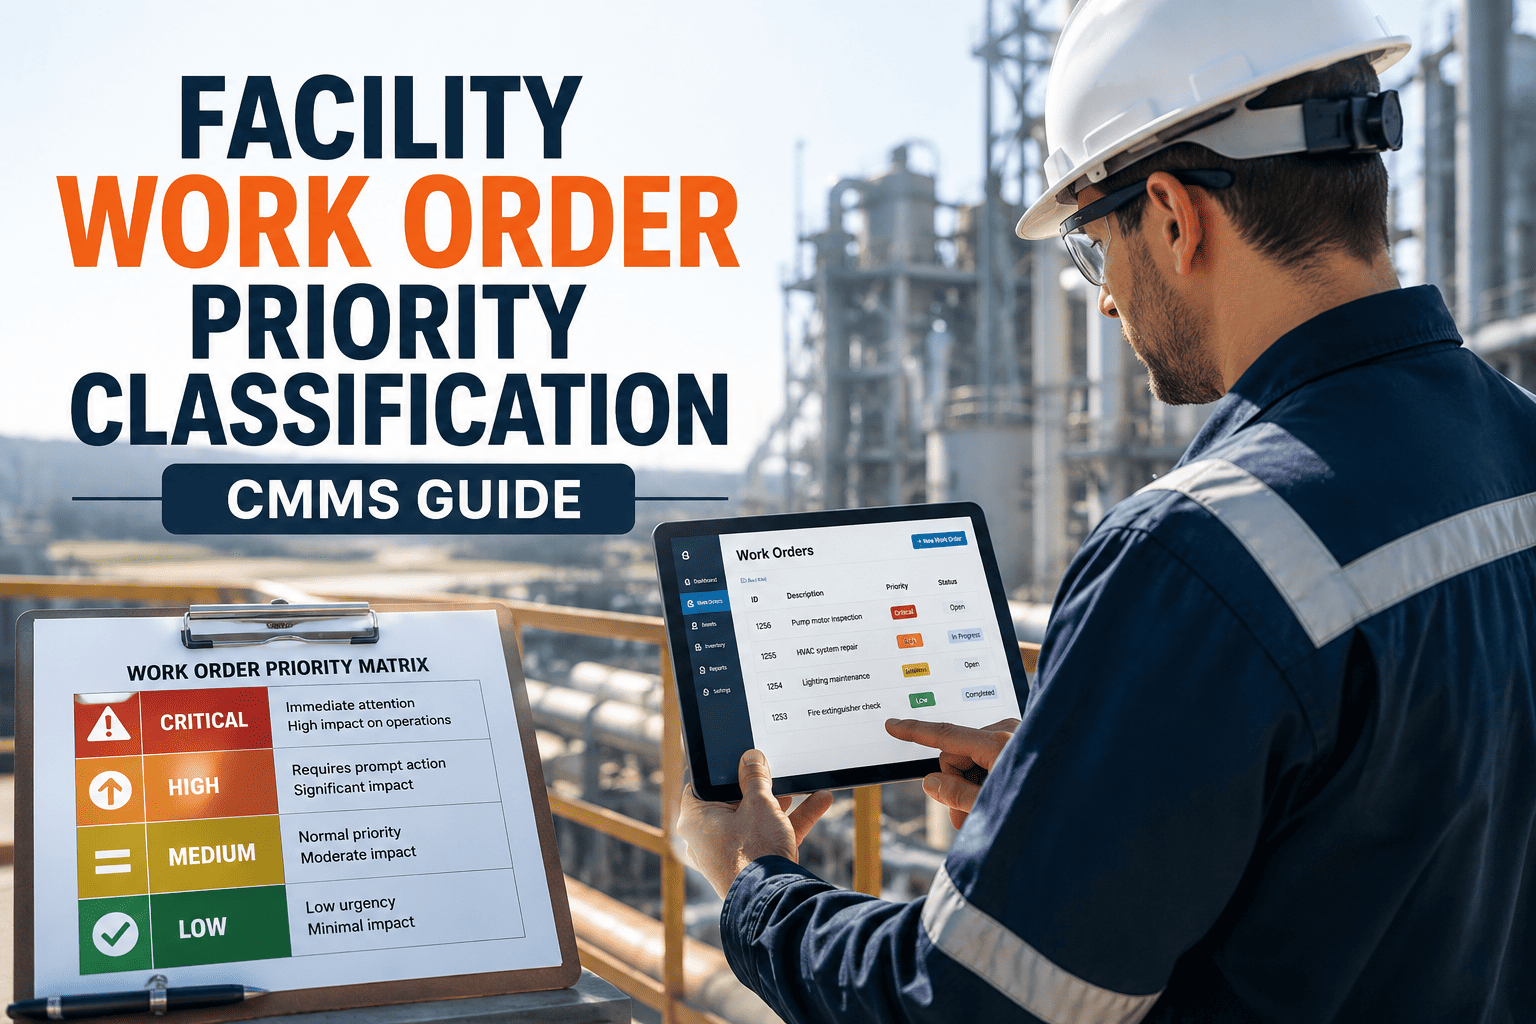
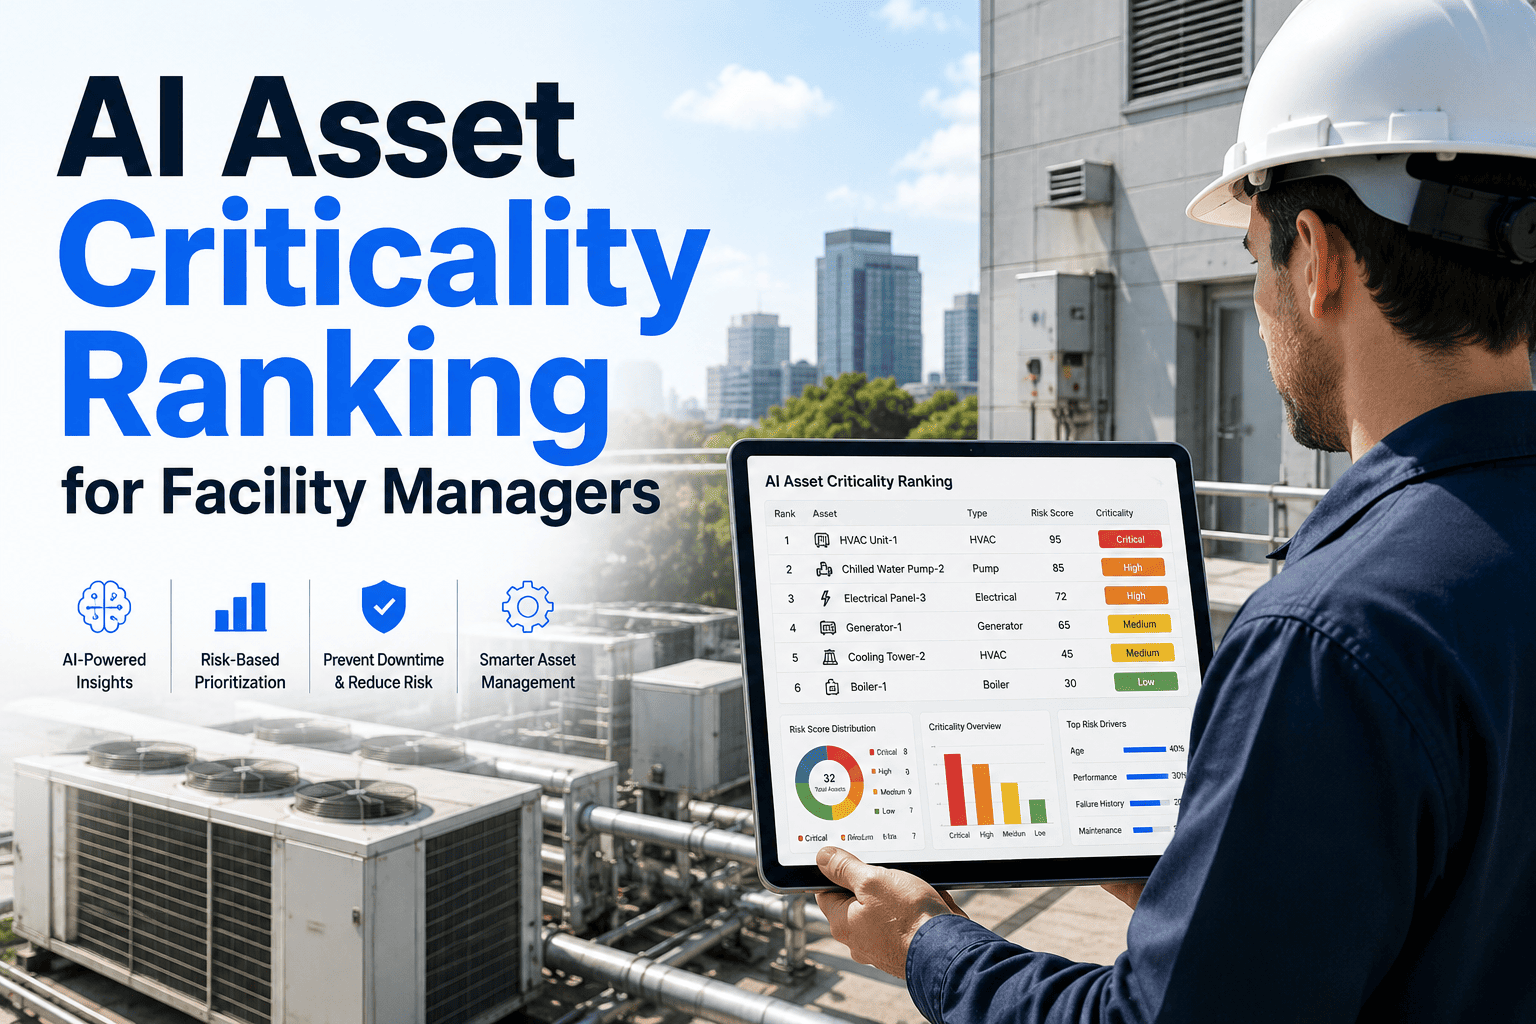
A mid-sized packaging plant in North Carolina spent four days rebuilding a failed air compressor last winter — not because the part was rare, but because nobody had flagged it as a top-priority asset in the CMMS. That compressor fed six production lines, yet it sat in the same PM bucket as a break-room water heater. The gap cost the plant an estimated $34,000 in lost output from a single missed ranking. Facilities that score assets by failure consequence, not gut feeling, catch these gaps before they turn into shutdowns — see how it works with a free trial of Oxmaint.
Preventive Maintenance Scheduling / Asset Criticality
Facility Asset Criticality Ranking: Turn PM Priority Into a Score, Not a Guess
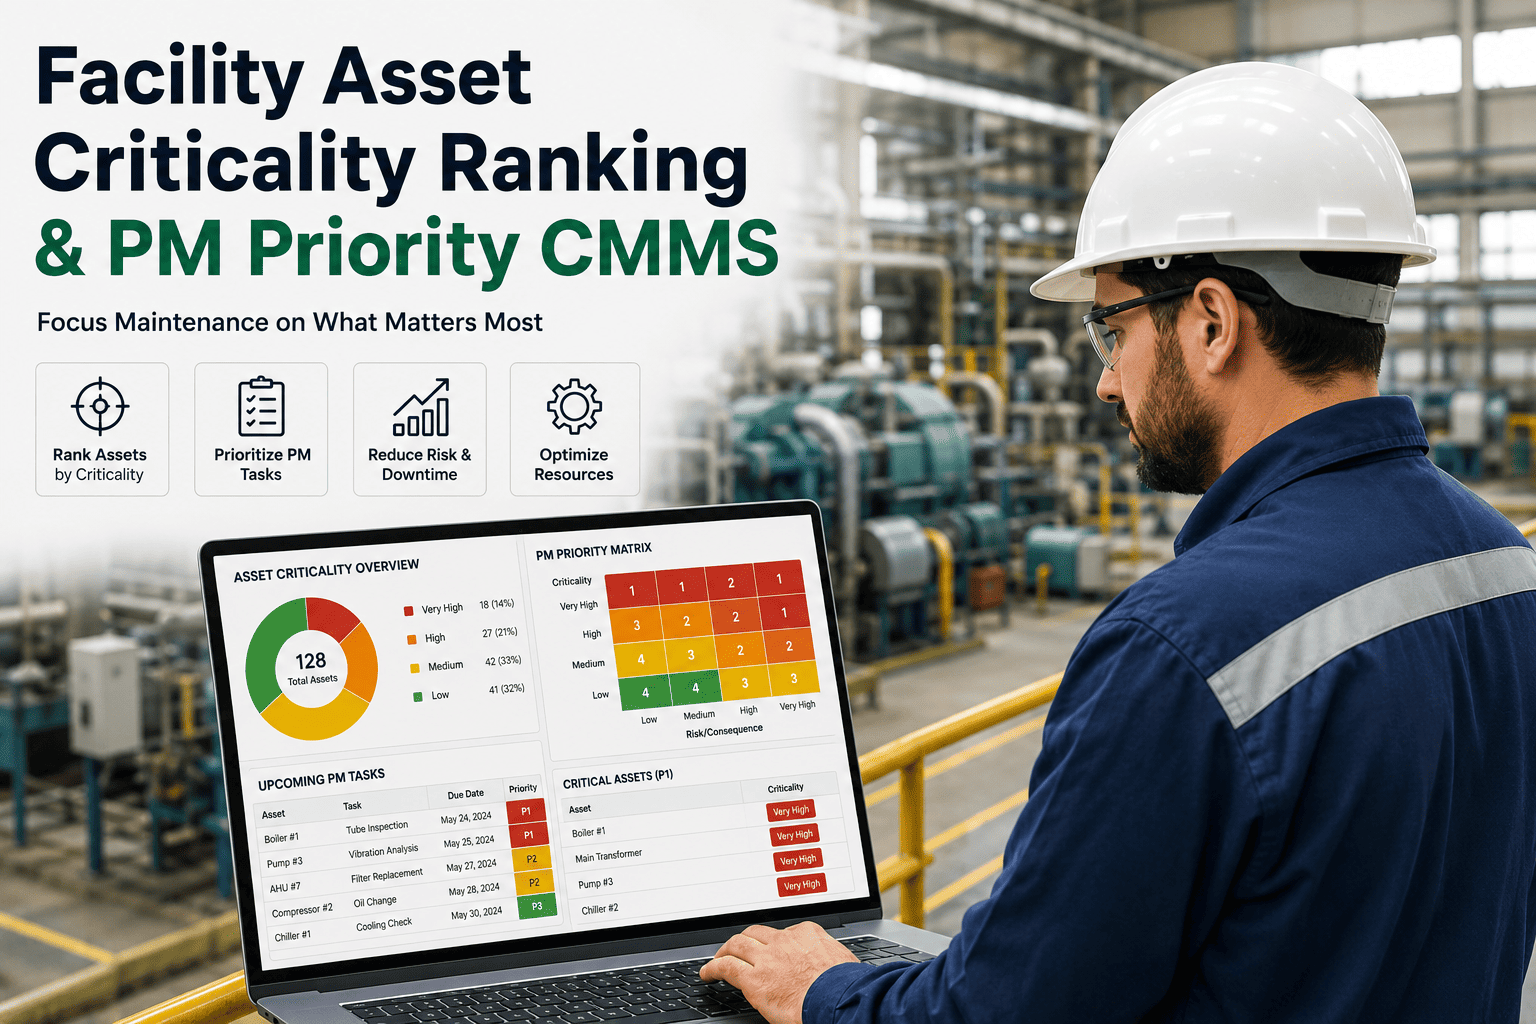
Every facility has a handful of assets that, if they fail, stop production, endanger people, or trigger regulatory action — and dozens more that barely matter. Oxmaint's criticality engine scores every asset across six risk factors and automatically aligns PM frequency, spare-parts stock, and work order priority to the result.
15–20%
of assets typically drive most facility downtime risk
6 factors
used to score production, safety, and cost impact
4 tiers
criticality classification maps directly to PM strategy
Zero
spreadsheets needed once scoring lives in the CMMS
Rank Once, Prioritize Automatically
Stop Scheduling PMs by Habit. Start Scheduling Them by Risk.
Oxmaint imports your existing asset register, walks your team through a guided criticality assessment, and reshapes PM frequency, technician assignment, and spare-parts stocking around the result — automatically.
What Asset Criticality Ranking Actually Measures
Asset criticality ranking is the practice of scoring every piece of equipment in a facility by the consequence of its failure — not by its purchase price or how old it is. A cheap sensor guarding a production line can outrank an expensive machine that has a backup sitting next to it. Oxmaint's scoring model weighs six dimensions of consequence so the ranking reflects real operational risk instead of whoever shouts loudest in the maintenance meeting.
01
Production Impact
How many lines, cells, or processes stop the moment this asset goes down, and whether output can be rerouted elsewhere.
02
Safety Risk
The likelihood a failure exposes technicians, operators, or the public to injury, fire, or exposure risk.
03
Environmental Consequence
Whether failure could release emissions, spills, or waste that trigger cleanup obligations or reporting duties.
04
Repair Cost
Parts, labor, and lead time required to restore the asset, weighted against how often it tends to fail.
05
Regulatory Exposure
Whether the asset falls under inspection mandates, permits, or compliance codes with penalties for lapses.
06
Redundancy Availability
Whether a backup unit, spare line, or workaround exists — redundancy lowers criticality even for costly assets.
The Four-Tier Map From Score to PM Strategy
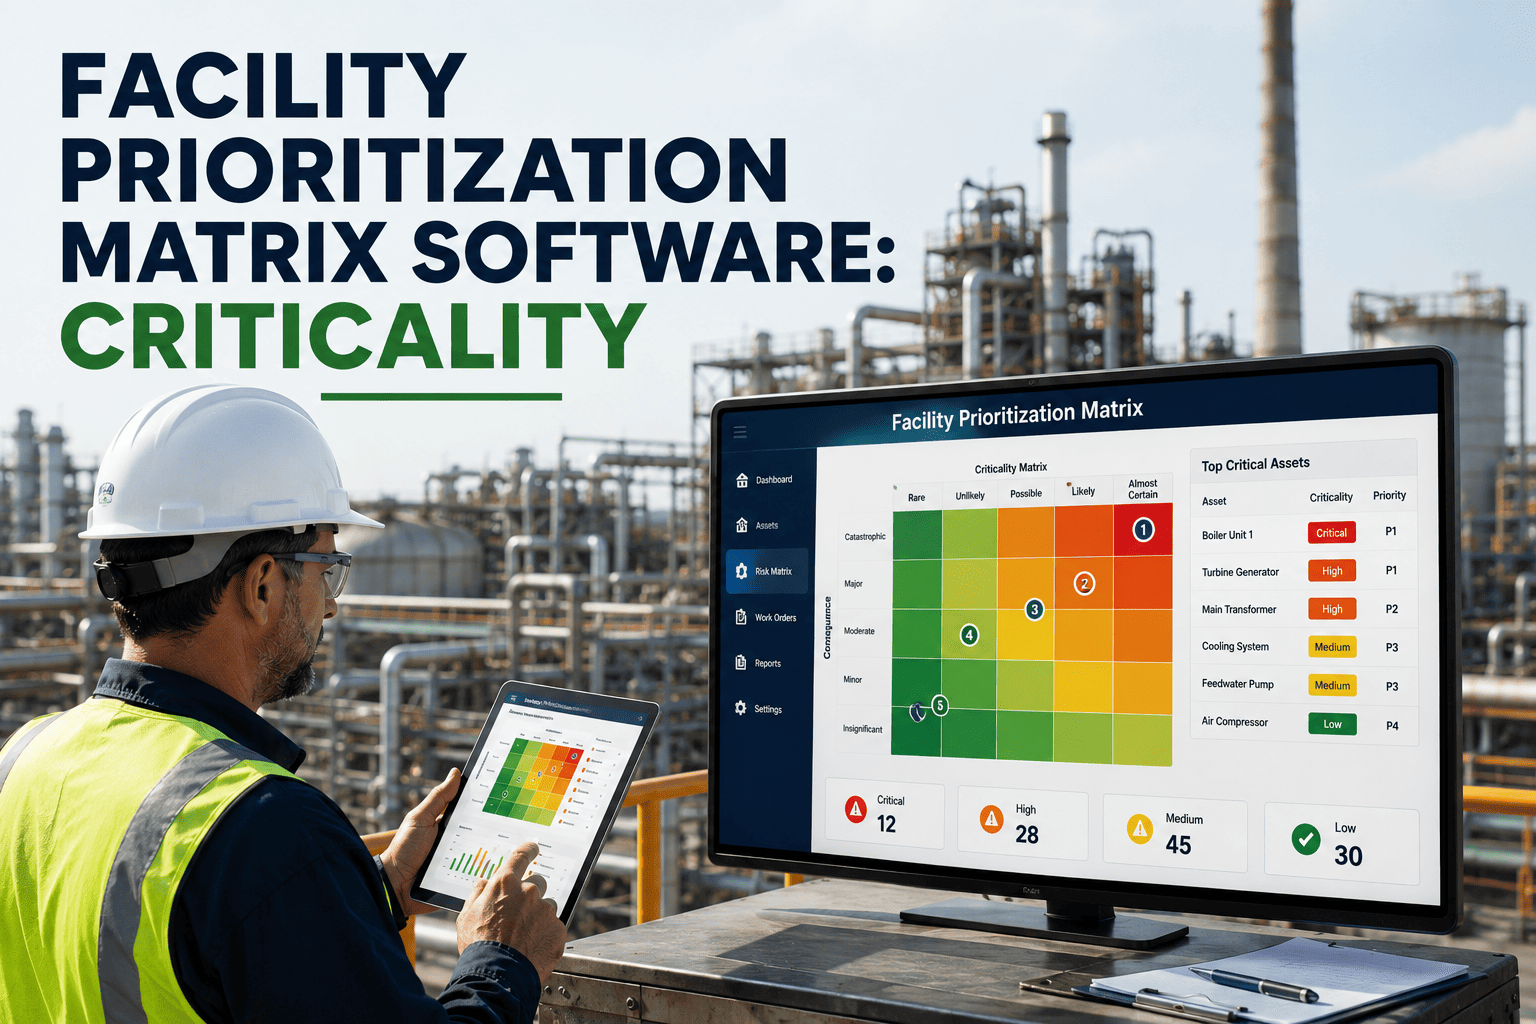
A raw score is only useful once it's translated into action. Oxmaint groups every scored asset into one of four tiers, and each tier carries its own PM frequency, inspection depth, and spare-parts policy — so the ranking work you did once keeps paying off every scheduling cycle.
Tier 1 — Critical
Score 80–100
Weekly PM, on-site spares, single-point-failure review
Tier 2 — High
Score 60–79
Monthly PM, reorder-point stock, condition monitoring
Tier 3 — Moderate
Score 35–59
Quarterly PM, just-in-time parts ordering
Tier 4 — Low
Score below 35
Run-to-failure or annual check, no dedicated stock
Four Patterns That Show a Facility Is Ranking Assets by Instinct
01
The Knowledge Lives in One Technician's Head
Senior staff know which assets are "the important ones," but nothing is written down. When they retire or move on, that judgment leaves with them and the next PM schedule reverts to guesswork.
02
Budget Cuts Hit Every Asset Equally
Without tiers, a 15% PM budget cut gets applied uniformly across the board instead of protecting Tier 1 assets and trimming Tier 4 ones — so the cut lands hardest where failure hurts most.
03
Spare Parts Stock Doesn't Match Risk
Warehouses carry duplicate stock for low-risk equipment while a genuinely critical part is on backorder, because parts inventory was never linked to an asset's actual criticality tier.
04
Work Orders Queue in Arrival Order
Technicians work tickets first-in-first-out instead of by risk, so a jammed conveyor waits behind a flickering hallway light simply because the light ticket was logged first.
How Oxmaint Scores, Ranks, and Acts on Criticality
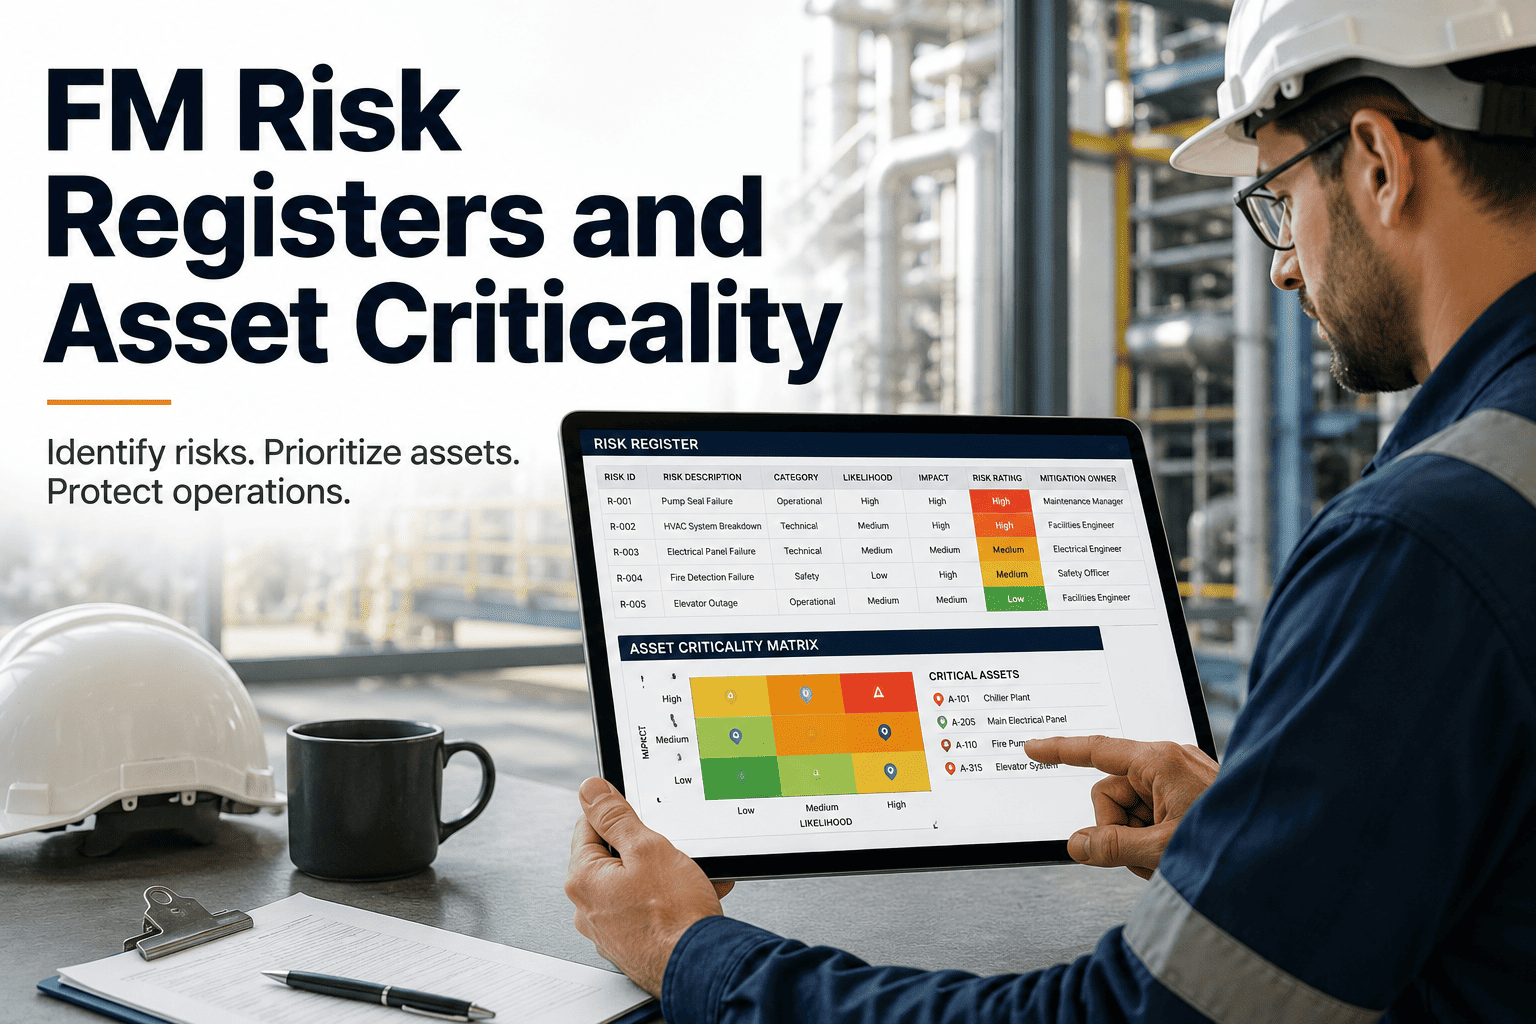
Oxmaint turns criticality assessment from a one-time spreadsheet exercise into a living part of the CMMS. Every score stays connected to the asset record, the PM schedule, and the parts catalog, so a change in one place updates priority everywhere else.
01
Guided Criticality Assessment
A structured questionnaire walks assessors through all six scoring factors per asset, with facility-type templates that pre-fill common equipment categories for review instead of scoring from zero.
Full asset register scored in days, not months
02
Automatic Tier Classification
Every combined score maps instantly to one of four tiers, and PM frequency, inspection depth, and escalation rules update the moment an asset's score changes.
No manual re-sorting when scores shift
03
Risk-Ranked Work Order Queue
Open work orders sort by asset tier and risk priority number automatically, so technicians always see the highest-consequence job first instead of the oldest ticket.
Critical jobs surface ahead of routine ones by default
04
Criticality-Linked Spare Parts
Parts inherit the criticality of the parent asset through the bill of materials, so Tier 1 components carry on-site stock policies while Tier 4 parts move to order-on-demand.
Warehouse spend redirected toward assets that matter
05
CapEx and Budget Forecasting
Repair cost history combined with tier data highlights which critical assets are approaching replacement age, giving finance teams a risk-ranked capital forecast instead of an age-based list.
Replacement budget aligned to failure consequence
06
Continuous Score Review
Criticality isn't scored once and forgotten — failure history, downtime events, and redundancy changes feed back into the score so rankings stay accurate as the facility evolves.
Rankings updated as operating conditions change
See Your Assets Ranked
Find Out Which 15% of Your Assets Actually Drive the Risk
Import your asset list and let Oxmaint's guided assessment produce a ranked, tiered register your whole maintenance team can act on this week.
Spreadsheet Ranking vs. Oxmaint Criticality Engine
| Category | Spreadsheet / Manual | Oxmaint Criticality Engine | Business Impact |
| Scoring consistency |
Varies by assessor and memory |
Guided six-factor model, same standard every time |
Consistent ranking across sites |
| Link to PM schedule |
Manual cross-reference required |
PM frequency updates automatically by tier |
No missed schedule updates |
| Spare parts alignment |
Stocking decided separately from risk |
Parts inherit criticality through asset BOM |
Stock matches actual failure risk |
| Work order priority |
First-in, first-out queue |
Auto-sorted by tier and risk priority number |
Highest-risk jobs handled first |
| Score maintenance |
Re-assessed rarely, if at all |
Continuously refreshed from failure and downtime data |
Rankings stay accurate over time |
| Budget defense |
Hard to justify with anecdote |
Risk-ranked report ready for leadership review |
Data-backed maintenance budget requests |
What a Structured Ranking Program Typically Returns
20–35%
Fewer emergency work orders on top-tier assets
Reported by facilities after moving critical equipment to condition-based PM
18–24%
Lower spare-parts carrying cost
From aligning stock levels to tier instead of stocking every asset equally
2–3 weeks
Typical time to rank a mid-size asset register
Using guided assessment templates instead of building a scoring model from scratch
1 register
Single ranked source of truth for the whole team
Replaces scattered spreadsheets, sticky notes, and tribal knowledge
Frequently Asked Questions
What criteria should go into an asset criticality score?+
Most facilities score production impact, safety risk, environmental consequence, repair cost, regulatory exposure, and redundancy availability.
Start a free trial to see the six-factor model applied to your own asset list.
How many criticality tiers does a facility actually need?+
Smaller sites often work fine with three tiers, while facilities with 200 or more assets benefit from a full four-tier matrix that separates moderate-risk equipment from truly low-priority items.
Do criticality scores ever need to be updated?+
Yes. A score set once and never revisited drifts out of date as redundancy, failure history, and operating conditions change. Oxmaint refreshes rankings continuously from live maintenance data.
Can criticality ranking work with an existing spreadsheet asset list?+
Existing asset registers import directly, and a guided scoring module walks assessors through each asset afterward.
Book a demo to see the import and scoring workflow.
How does criticality tier affect spare parts stocking?+
Parts linked to Tier 1 assets typically carry on-site stock with reorder points, while parts for Tier 4 assets move to order-on-demand, keeping warehouse spend proportional to actual risk.
Facility Asset Criticality — Oxmaint
Stop Guessing Which Assets Matter Most
A ranked, tiered asset register turns PM scheduling, spare-parts stocking, and work order priority into decisions backed by data instead of memory. See your facility's risk map with a guided criticality assessment.
6 factors
scored per asset automatically
4 tiers
mapped directly to PM strategy
1 platform
for scoring, PM, and spare parts