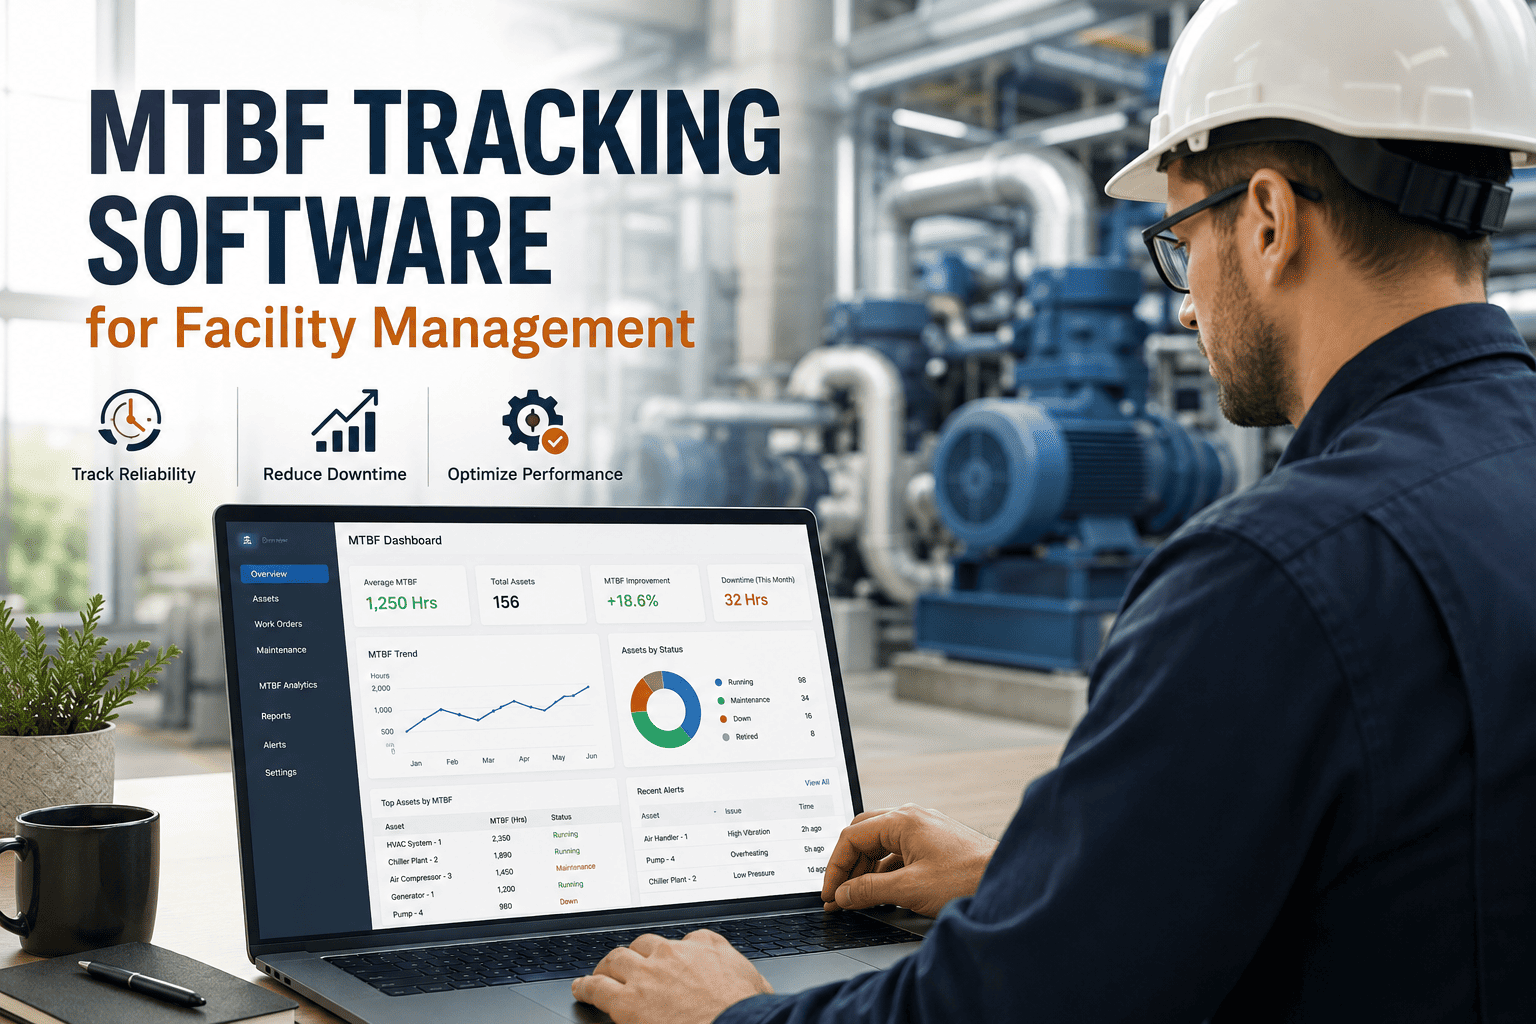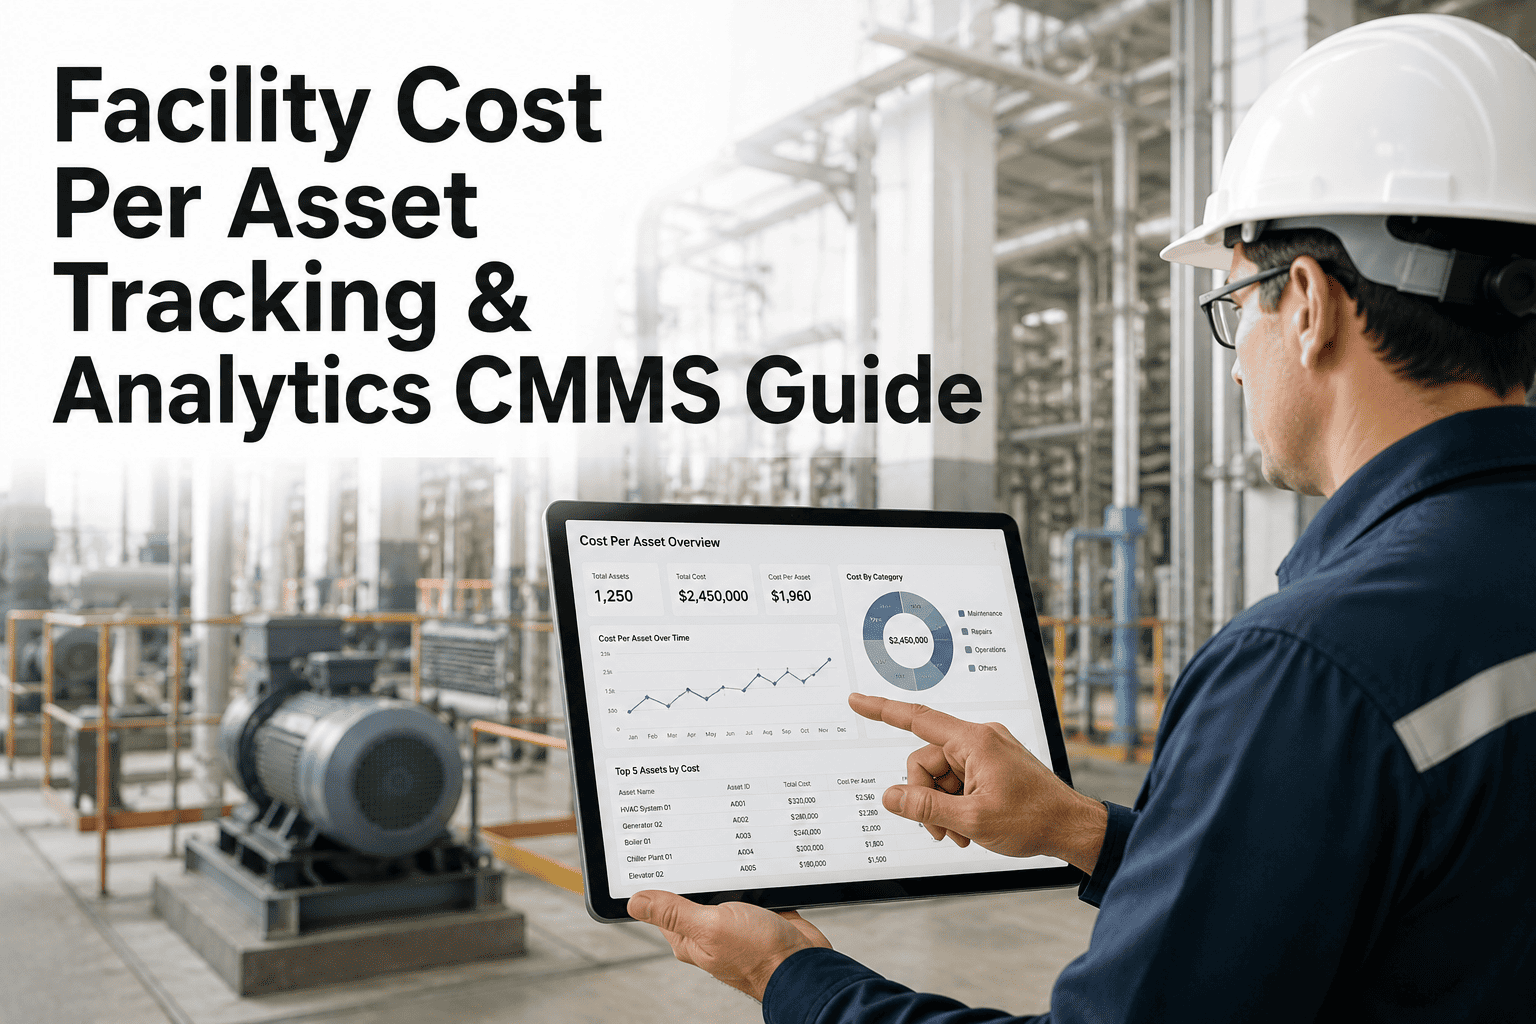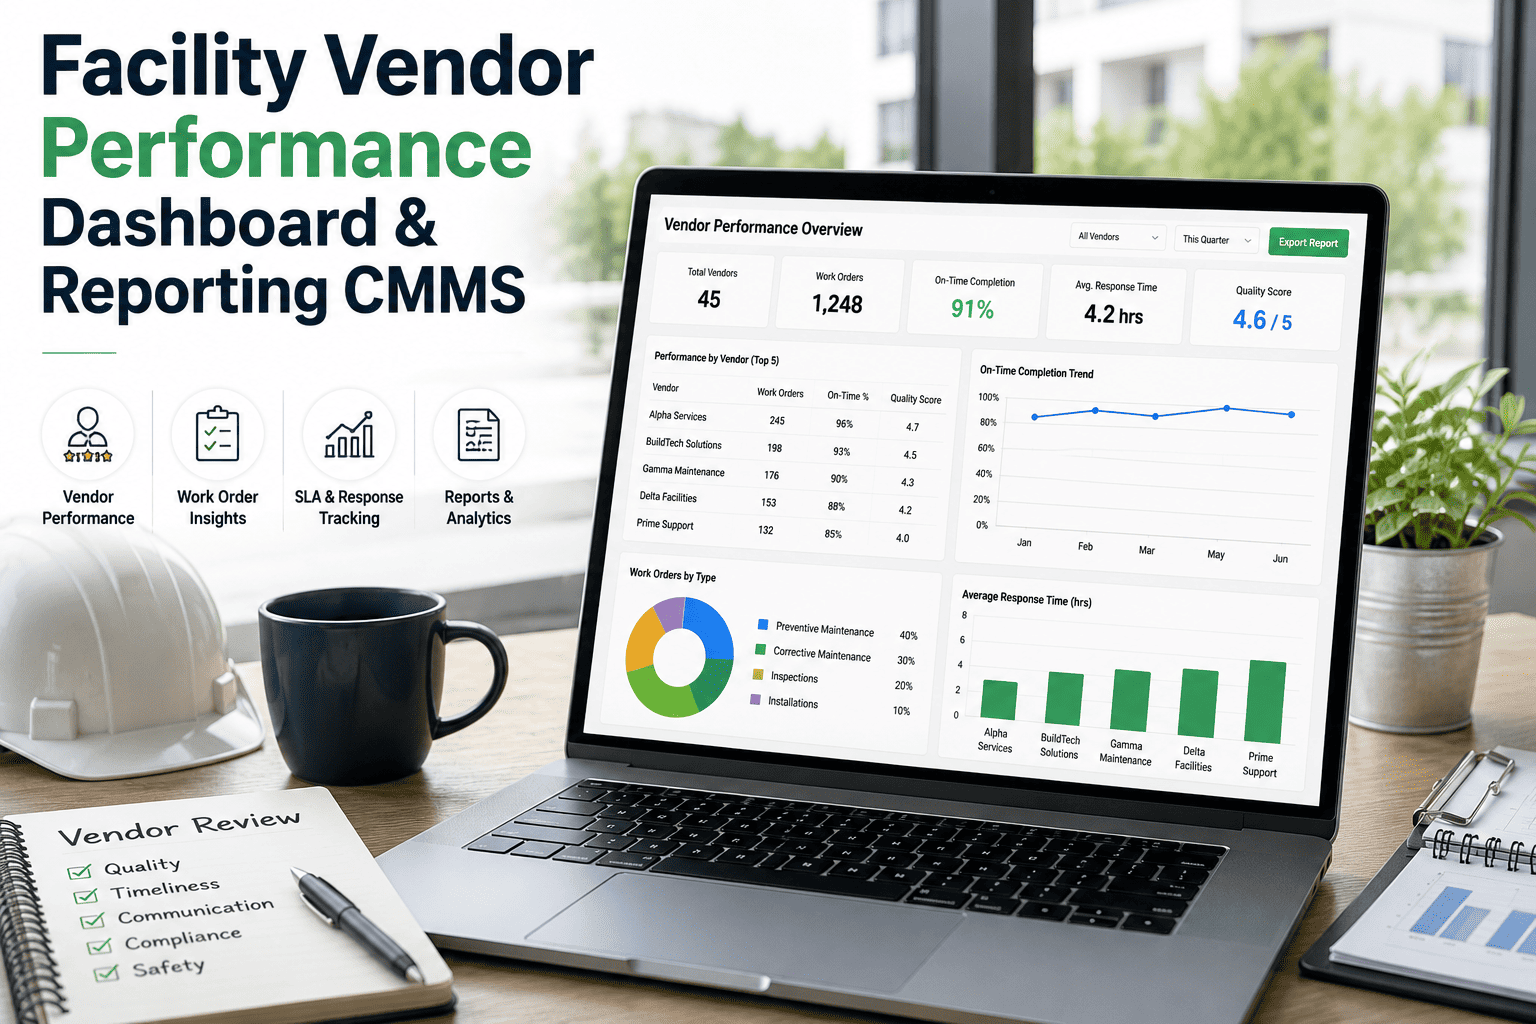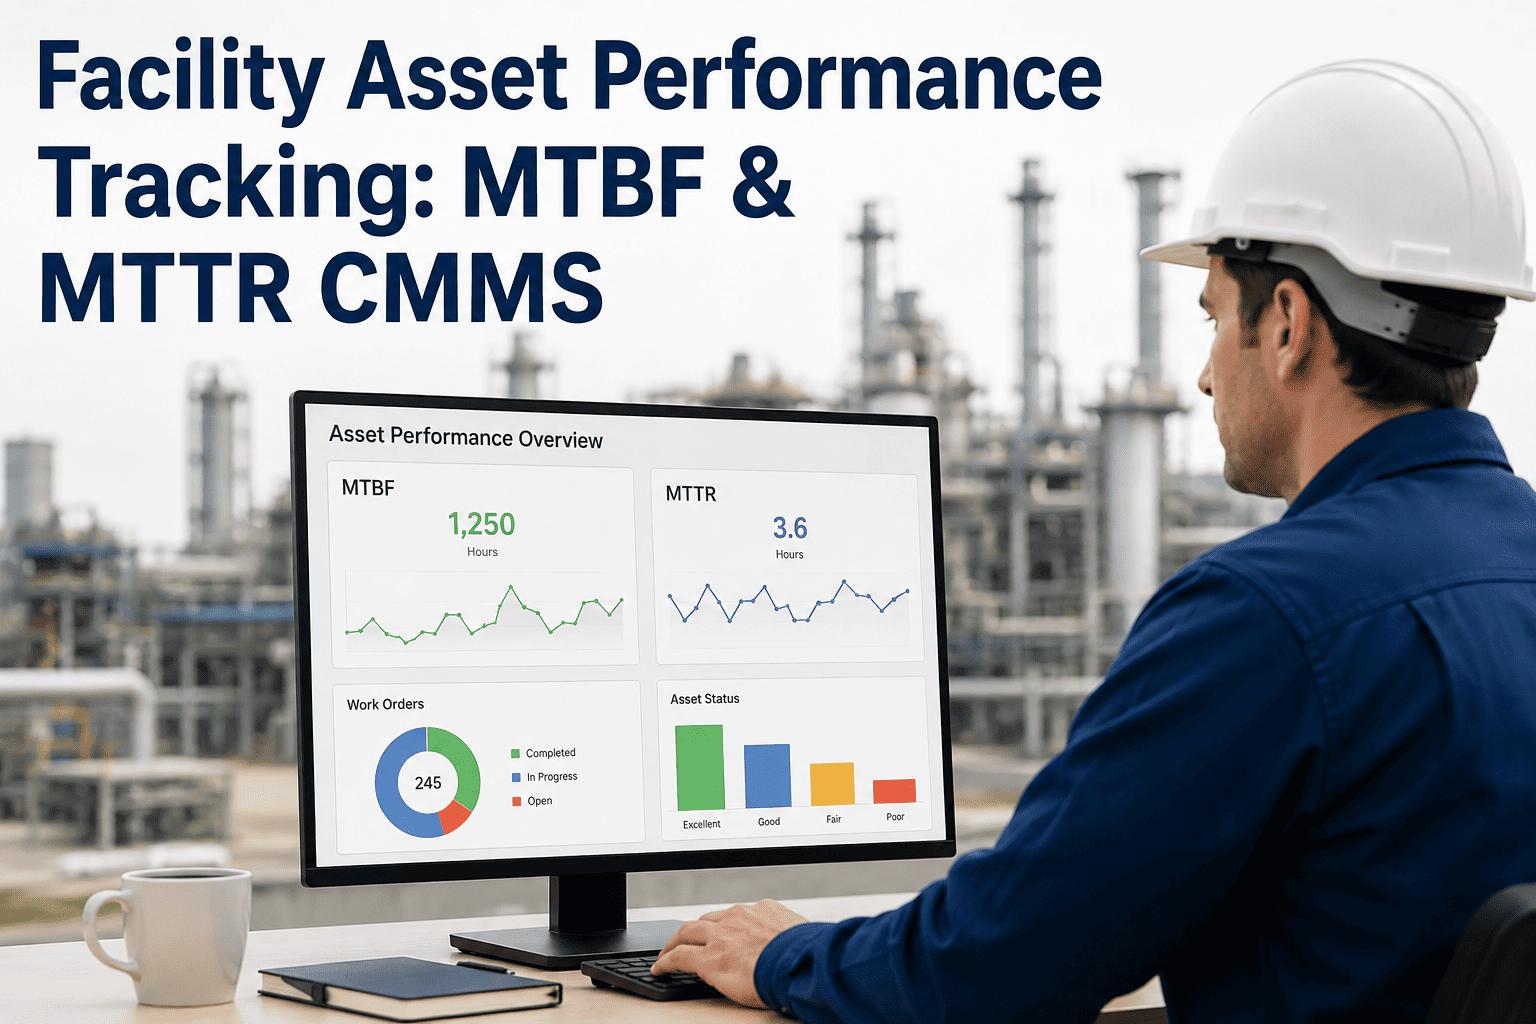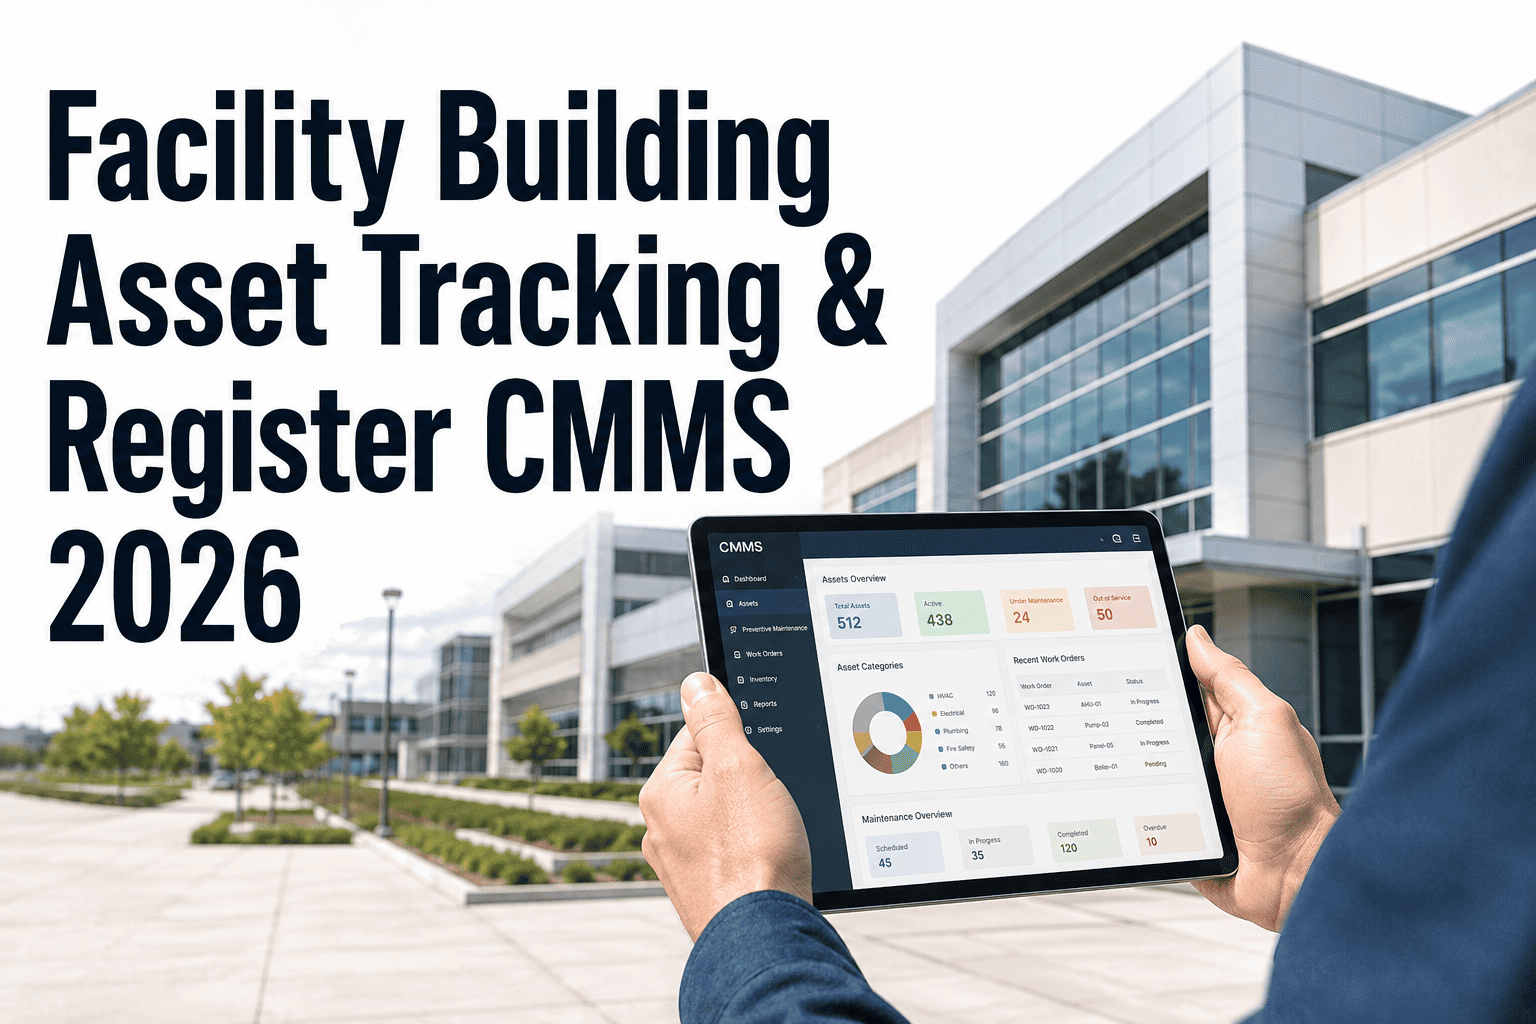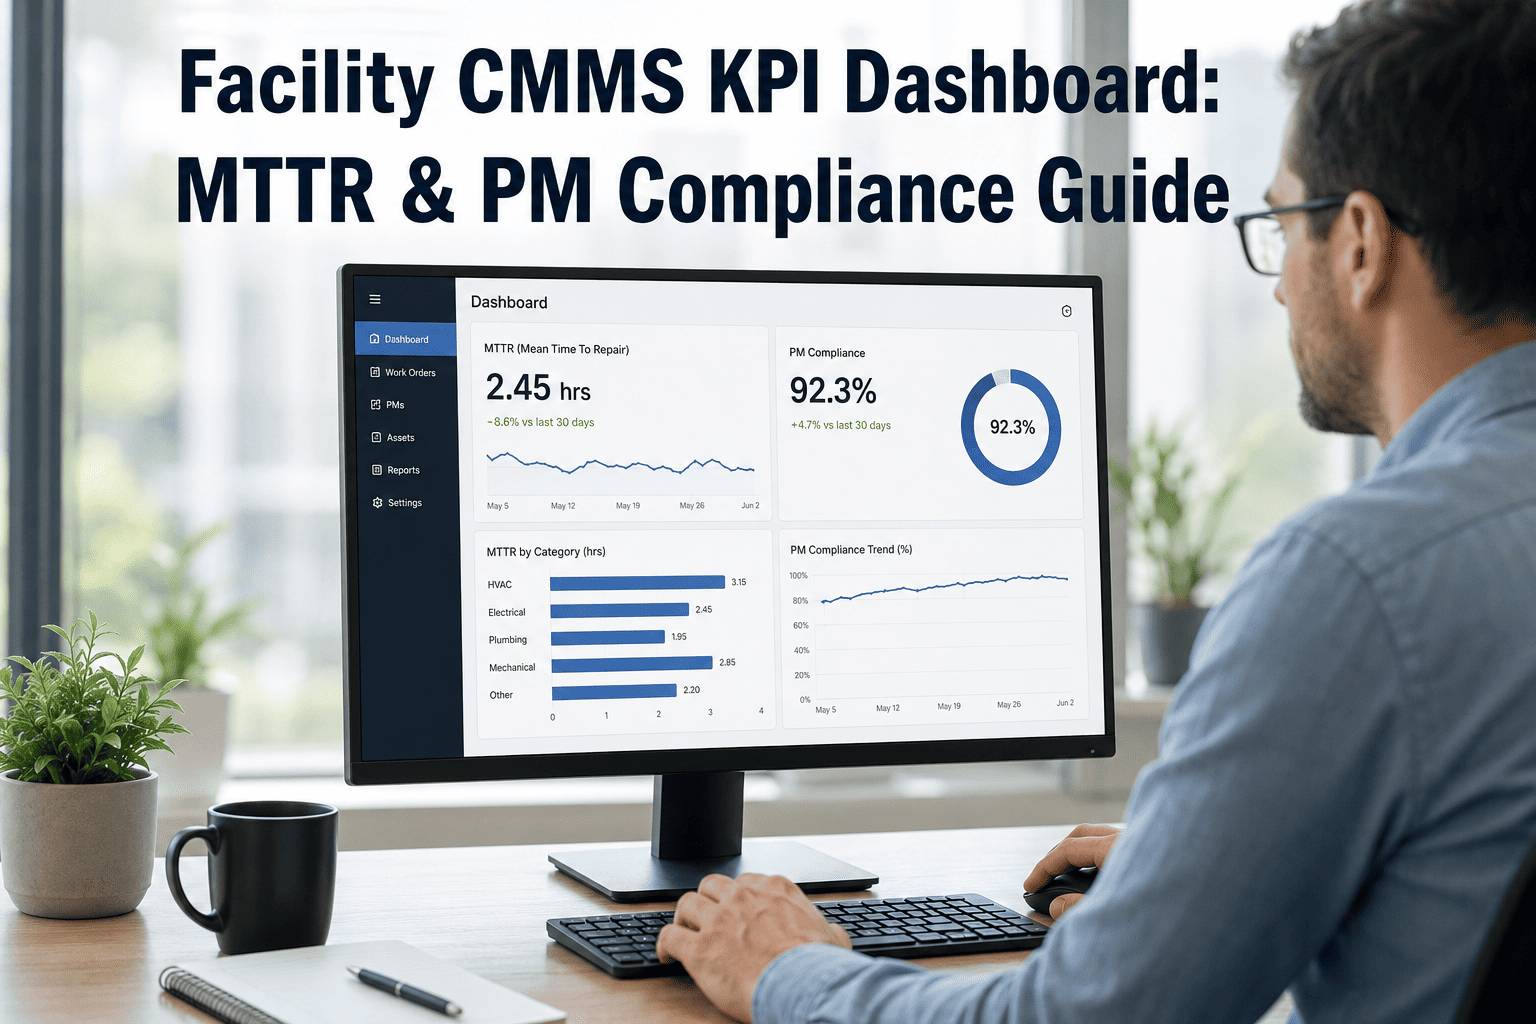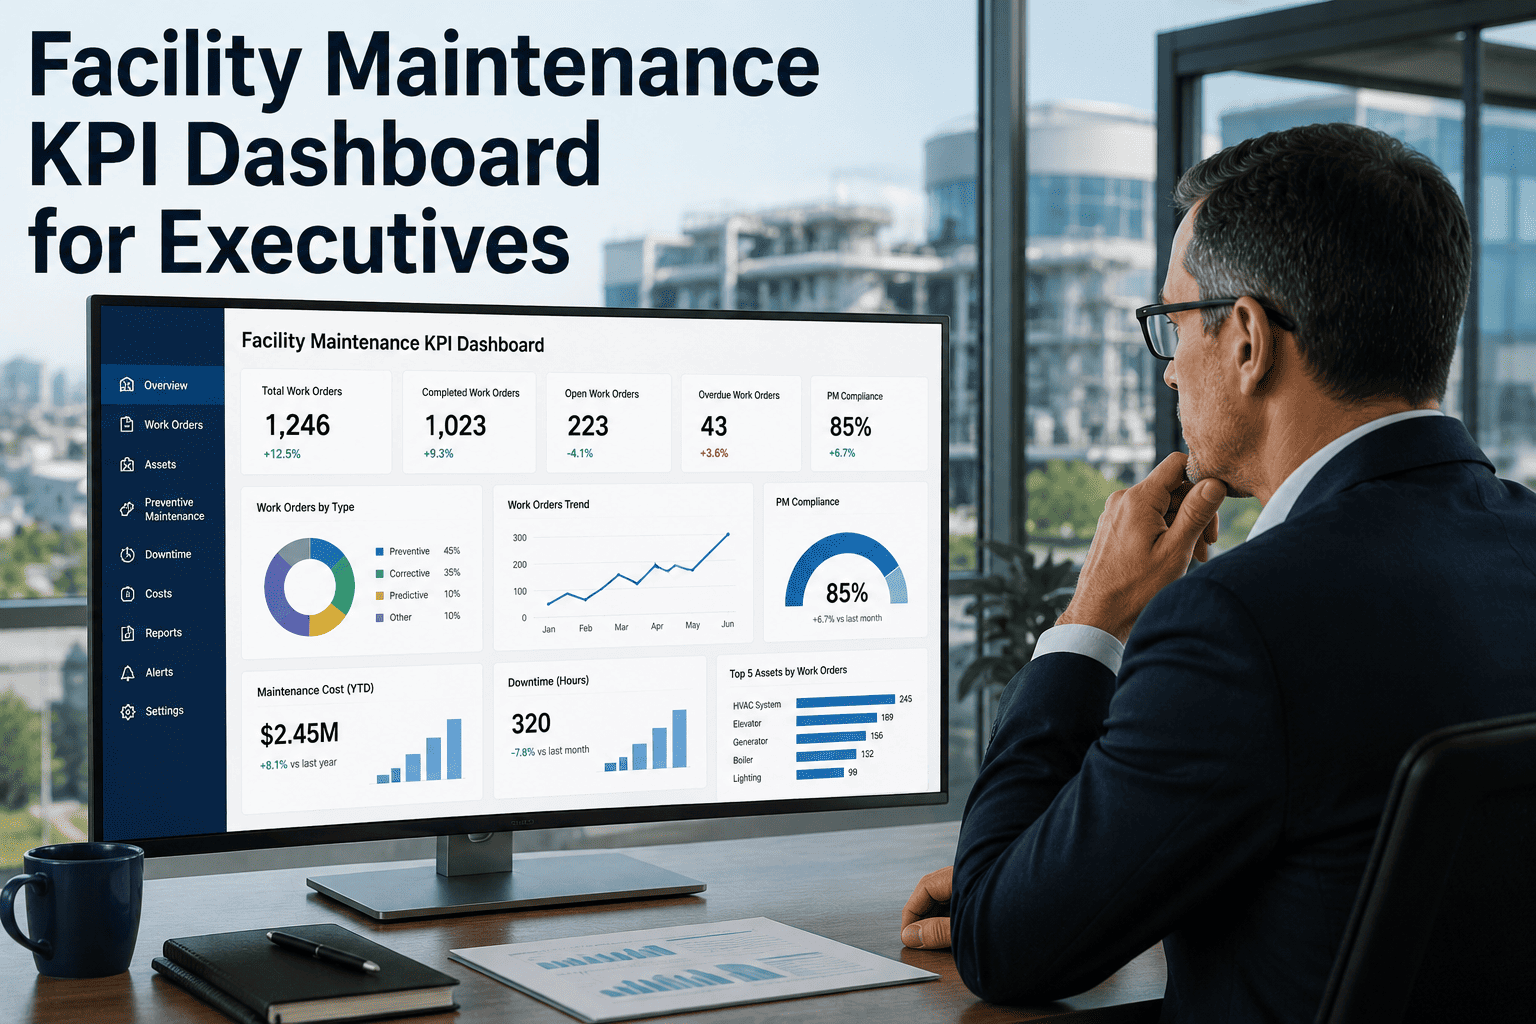
Most facility maintenance teams do excellent work that leadership never sees — because the data lives in spreadsheets, paper logs, and disconnected systems that nobody synthesizes into a coherent executive view. When a board member asks about asset downtime, SLA performance, or labor cost per repair, the answer should take seconds, not a week of manual reporting. OxMaint's facility maintenance KPI dashboard surfaces MTTR, backlog trends, PM compliance, asset downtime, and cost-per-work-order in a single real-time view designed for executive review. Whether you are managing one building or a multi-site portfolio, the dashboard turns operational data into the decision-ready intelligence that building owners, hospital administrators, and operations directors actually need. Book a demo to see your facility metrics in OxMaint's executive view.
Facility Maintenance KPI Dashboard for Executives
MTTR, backlog, PM compliance, asset downtime, labor cost, and SLA performance — one live dashboard, built for decisions that matter.
Six Questions Executives Ask That Facility Teams Cannot Answer Fast Enough
Every Metric on the OxMaint Executive Dashboard
| KPI | What It Measures | Why It Matters | Update Frequency |
|---|---|---|---|
| MTTR | Mean time from work order open to closure | Reflects team responsiveness and repair efficiency | Real-time |
| MTBF | Time between failures per asset | Signals asset health and predicts replacement timing | Per closure event |
| PM Compliance | Scheduled PMs completed on time vs total due | Compliance risk and preventive maintenance effectiveness | Daily |
| Backlog Count | Open work orders by age bucket and priority | Capacity planning and staffing visibility | Real-time |
| SLA Compliance Rate | Work orders closed within defined time targets | Contract performance and tenant satisfaction | Real-time |
| Labor Cost per WO | Total technician hours × rate per closed work order | Operational cost control and benchmarking | Per closure |
| Asset Downtime | Hours per asset where operation was impaired | Business impact of maintenance gaps | Per work order |
| First-Time Fix Rate | Work orders resolved without a repeat visit | Technician effectiveness and parts management | Per closure |
Built for Every Stakeholder, Not Just the Facility Team
What Operations Leaders Say
Before OxMaint, preparing a board-ready facilities report meant pulling data from three systems, running formulas in Excel, and hoping nothing had changed overnight. Now I open one dashboard and the numbers are live. The MTTR and PM compliance views have become part of our monthly leadership review — and they have changed conversations about staffing and capital allocation in ways I did not expect.
The SLA compliance tracker alone has been worth the investment. We manage facilities under multiple service contracts and previously had no unified view of whether we were hitting our targets across all of them. OxMaint shows us SLA performance by property in real time — and the breach alert system means we act before the window closes, not after an angry call from a tenant.
Frequently Asked Questions
Can the dashboard be customized to show only the KPIs our leadership team cares about?
OxMaint's dashboard supports role-based views that surface the metrics most relevant to each stakeholder. Executives see portfolio-level summaries, operations managers see team and site breakdowns, and technicians see their own work queues. Widget visibility and layout can be adjusted per role without changing the underlying data. Book a demo to walk through dashboard configuration for your org structure.
How does OxMaint calculate MTTR and MTBF — can we see the underlying work order data?
MTTR in OxMaint is calculated from work order open and close timestamps, excluding any time the order was paused pending parts or approval. MTBF is derived from failure event history per asset. Every KPI value is drillable — clicking a metric opens the underlying work orders so you can audit the calculation or investigate outliers. See the drill-down feature in a live demo.
Can we export KPI reports for budget reviews or board presentations?
Yes — OxMaint's reporting engine exports filtered KPI summaries in structured formats suitable for board decks, budget reviews, and compliance submissions. Reports can be scheduled for automatic delivery to stakeholders via email on a weekly or monthly cadence. Date range, facility scope, and metric selection are all configurable at export time. Book a demo to review a sample executive export.
Does the dashboard support multi-site facilities with different teams at each location?
OxMaint is designed for multi-site, multi-team operations. The executive dashboard aggregates across all locations while allowing drill-down by site, building, floor, or team. SLA rules, escalation thresholds, and PM schedules can be configured independently per site while remaining visible in the unified portfolio view. Book a demo to walk through a multi-site setup relevant to your portfolio size.
Stop Reporting Backwards. Start Managing in Real Time.
OxMaint gives every stakeholder the facility KPIs they need — live, drillable, and always export-ready.