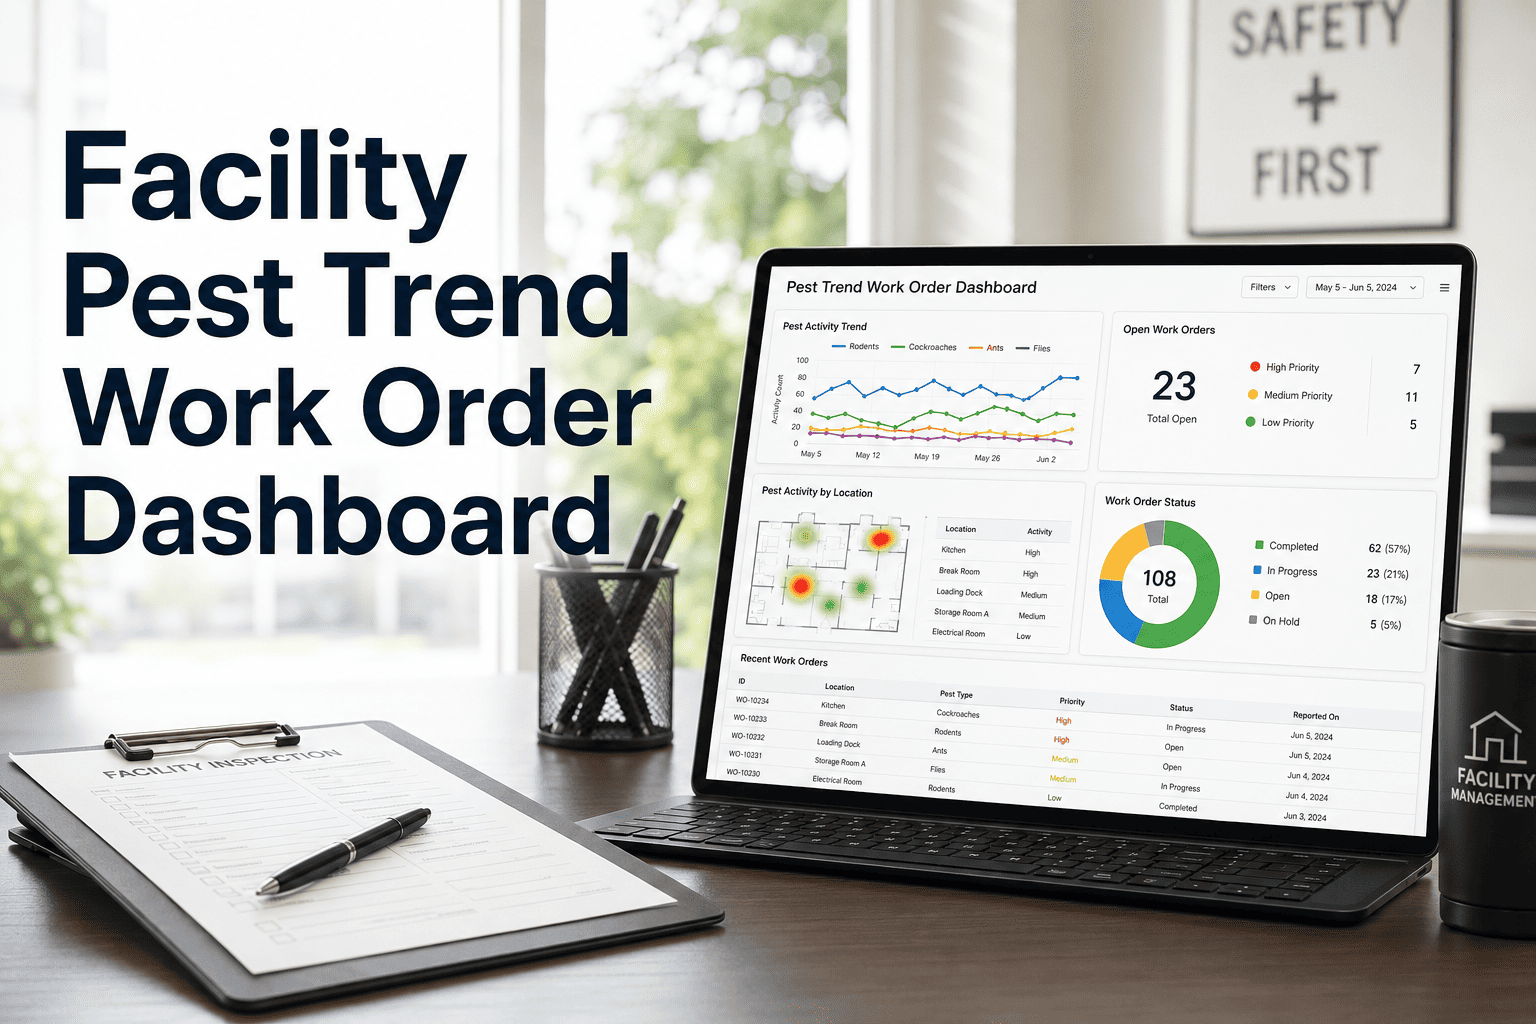
Pest complaints rarely show up as a single bad incident — they show up as a pattern across the same loading dock, the same waste room, or the same ground-floor break area, month after month, while each complaint gets logged and closed as if it were unrelated to the last one. Without a way to see that pattern, facility teams keep dispatching one-off pest control visits instead of fixing the entry point, the cleaning gap, or the sanitation lapse driving the trend. OxMaint's analytics and reporting dashboard maps every pest-related work order to a zone and a time period, so recurring problem areas surface automatically instead of staying buried across dozens of separate tickets. This page shows what that dashboard actually displays, how zones get ranked by complaint volume, and how the trend data turns into a corrective action plan instead of another repeat visit. Book a demo to see your own facility's pest trend data mapped out.
Analytics & Reporting · Product Page
Facility Pest Trend Work Order Dashboard
Map recurring pest complaints, cleaning gaps, and entry points across building zones — and turn the pattern into a corrective action plan.
Pest Complaints by Zone — Last 6 Months
Dashboard Features
Three Views That Turn Complaints Into a Pattern
01
Zone Heatmap
Every pest-related work order is mapped to a building zone, color-coded by complaint frequency over the selected period.
02
Trend Lines Over Time
Track whether a zone is improving or worsening month over month, instead of judging each ticket in isolation.
03
Suggested Root-Cause Actions
Zones with repeat complaints surface a recommended corrective action — entry point sealing, cleaning cycle review, or sanitation audit.
Zone Ranking
Top Zones by Pest Complaint Volume
| Zone | Complaints (6 mo) | Trend | Suggested Action |
|---|
| Loading Dock | 22 | Rising | Seal exterior entry points |
| Waste Room | 13 | Flat | Review cleaning cycle compliance |
| Break Room | 6 | Improving | Continue current schedule |
| Lobby | 3 | Improving | No action needed |
Live Dashboard Demo
See Your Own Pest Trend Map Built Live
Bring six months of pest-related tickets and we'll map them to zones during the demo, the same way OxMaint does automatically.
Reactive vs. Predictive
One-Off Pest Visits vs. Zone Trend Management
Reactive Pest Control
Each complaint treated as an isolated event
No visibility into which zones repeat
Root cause rarely investigated
Pest control cost grows with ticket volume
Zone Trend Dashboard
Complaints mapped to zones automatically
Recurring zones ranked by volume and trend
Root-cause action suggested per zone
Cost drops as root causes get addressed
Expert Review
Why Pest Programs Stay Reactive Without Zone-Level Data
I have reviewed pest control invoices for facilities spending tens of thousands a year on recurring visits to the same three locations, with nobody connecting the dots because the complaints were filed as separate tickets months apart. The moment you put those tickets on a zone map with a time axis, the pattern is obvious and the conversation shifts from "schedule another visit" to "why does this loading dock keep attracting activity." Trend visibility is what turns a pest budget from a recurring cost into a one-time fix.
Facility Sanitation Program Lead
Background in integrated pest management and sanitation auditing for commercial and retail portfolios
Common Questions
Frequently Asked Questions
How does a pest complaint get mapped to a specific zone?
Every work order captures a location field at creation, and pest-related tickets are automatically grouped into the zone they were filed against for the dashboard view.
See zone mapping in a free trial using your own building layout.
Can we import historical pest complaint data from a previous system?
Yes — historical tickets can be imported and tagged to zones during onboarding, so the trend dashboard has meaningful history from day one instead of starting from a blank slate.
Discuss your historical data in a live demo.
What triggers a "rising trend" flag on a zone?
A zone is flagged as rising when complaint volume over the recent period exceeds its own historical baseline, rather than against a fixed company-wide threshold that doesn't account for zone-specific patterns.
Review the trend logic directly inside a free trial.
Does the dashboard suggest specific corrective actions, or just flag the problem?
Recurring zones surface a suggested action category — entry point sealing, cleaning cycle review, or sanitation audit — based on the type of complaints logged, giving teams a starting point rather than just a red flag.
See a sample recommendation in a demo.
Can this dashboard be shared with an external pest control vendor?
Zone trend reports can be exported and shared with vendors or leadership, giving everyone the same data instead of relying on a vendor's own incident log for the conversation.
Start a free trial to generate a sample export.
Analytics & Reporting · OxMaint
Turn Pest Tickets Into a Map, Not a Backlog
See which zones repeat, why, and what to fix — instead of dispatching another one-off visit.