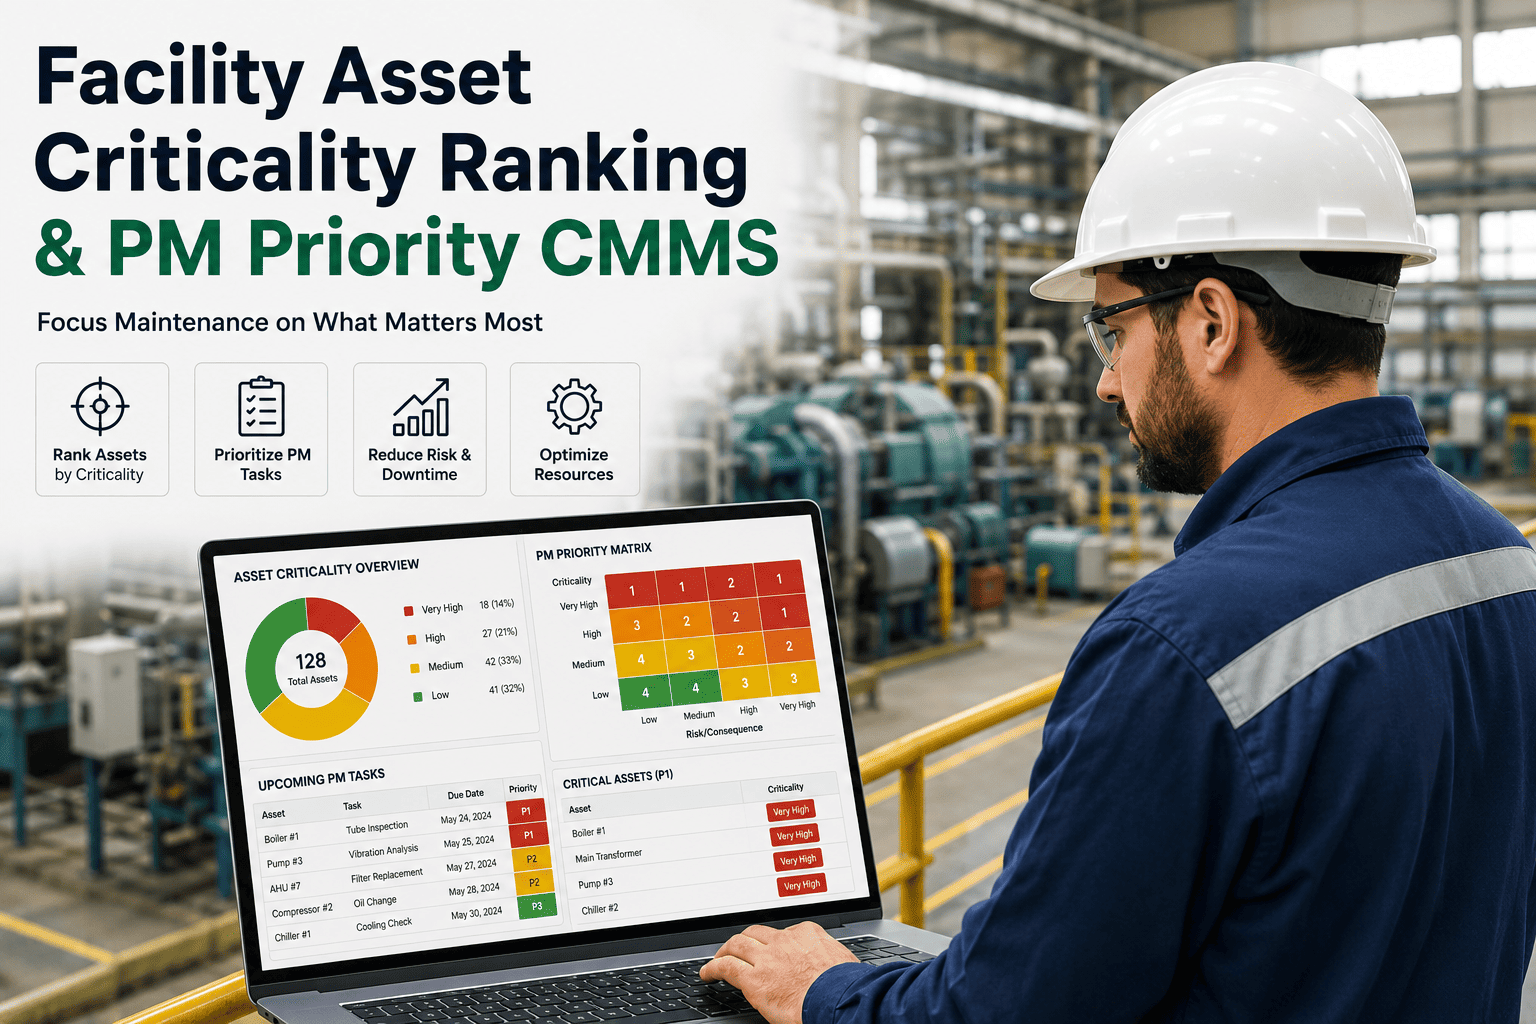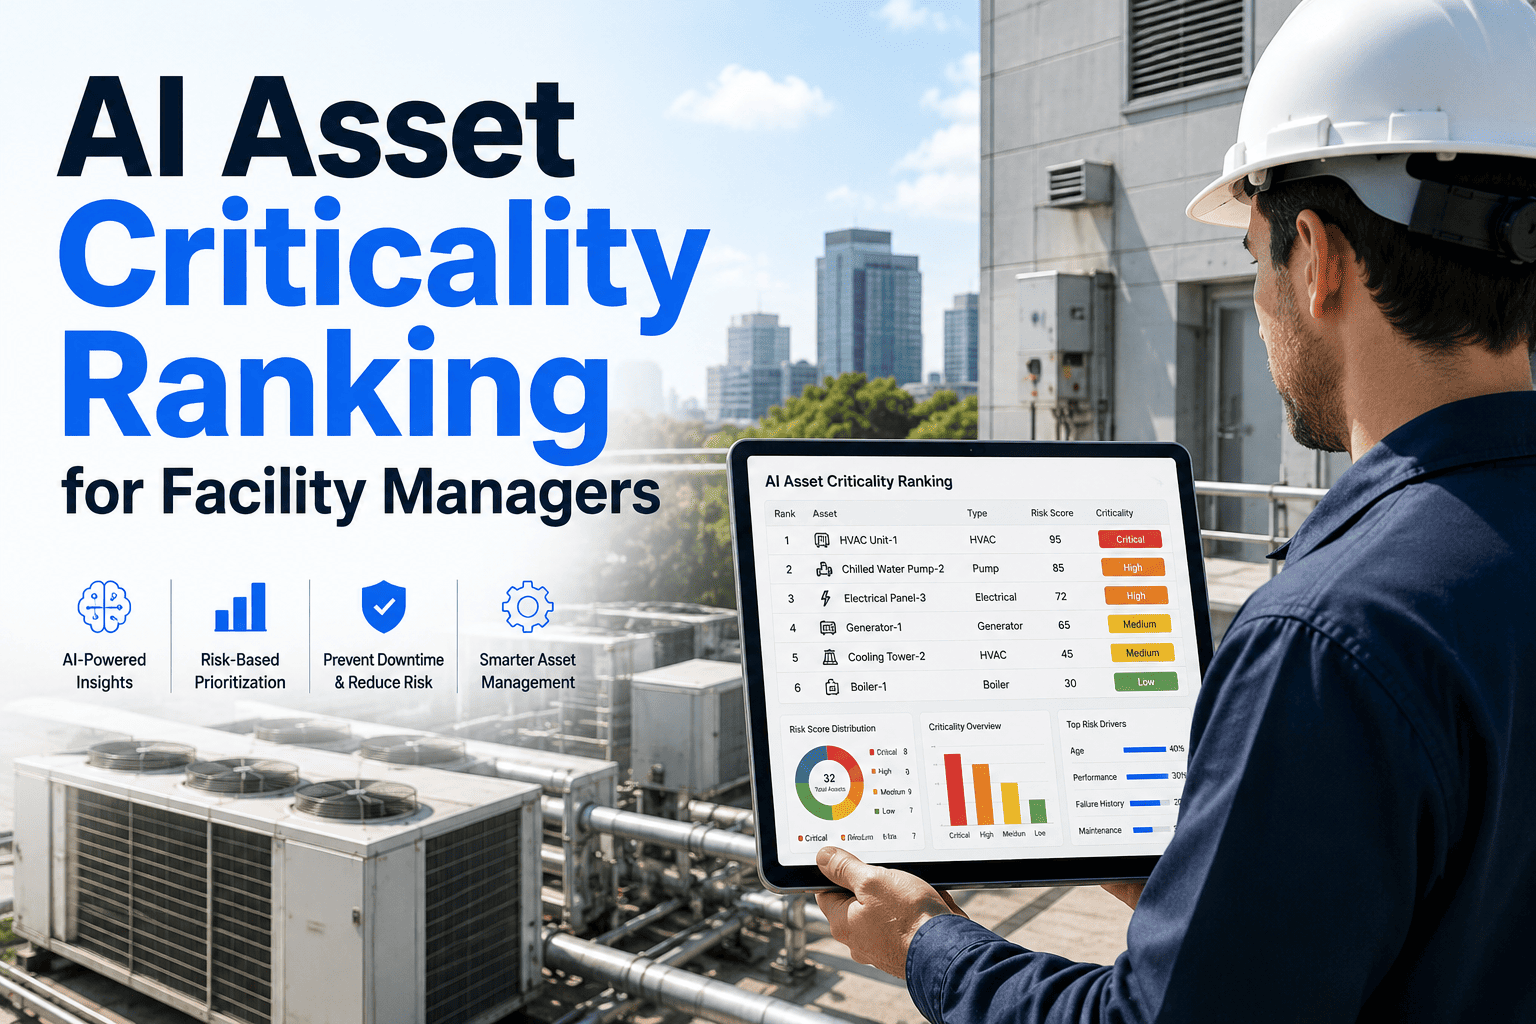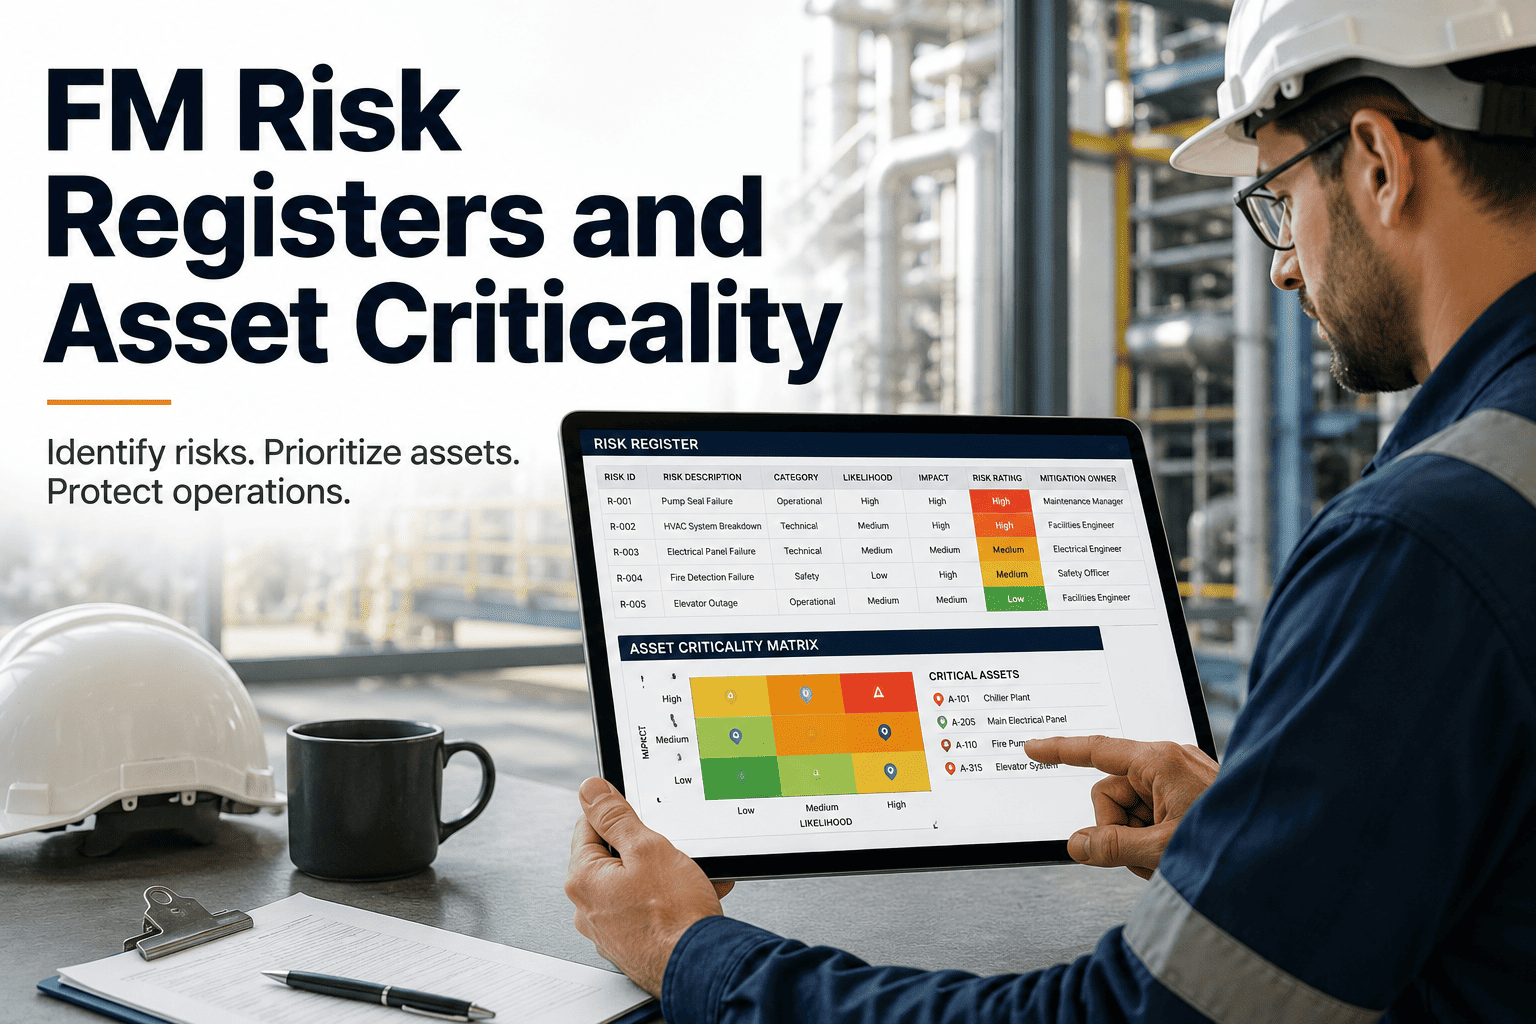
An FM risk register that ranks assets by failure consequence — not replacement cost — is what separates a facility that runs from one that reacts. When every pump, air handler, and switchgear is treated as equally critical, maintenance teams over-service low-impact equipment while the assets that can actually halt production, trigger compliance violations, or endanger occupants go under-protected. By building a facility risk register around asset criticality and failure consequence, you channel limited labor and capital toward the 10–15% of assets that drive 80% of operational risk. OxMaint's AI-powered CMMS operationalizes that ranking automatically, tying criticality scores to work-order priority, preventive maintenance frequency, and spare-parts stocking levels. Start Free Trial to see how it works on your asset list today.
What if 80% of your downtime risk came from 15% of your assets?
Most facility risk registers list every asset and treat them all the same. The result: technicians service non-critical HVAC units quarterly while a single failed transformer takes the whole building offline. A consequence-based FM risk register flips that — ranking assets by the severity of what happens when they fail, not what they cost to replace.
How to build an FM risk register with asset criticality ranking
A facility risk register is only as useful as the scoring framework behind it. The industry-standard approach aligns with ISO 55000 asset management principles: rate each asset's failure consequence across four to six dimensions, combine them into a single criticality score, then map that score to maintenance strategy and spare-parts policy.
Each consequence dimension is scored 1–5. Weights (W) are calibrated to your facility's risk appetite — a hospital weights safety and compliance higher; a data center weights operational impact and financial loss highest.
Safety & Life Safety
Could failure injure occupants, tenants, or staff? Fire pumps, emergency lighting, elevators, and life-safety systems typically score 4–5. A single failure can mean injury, evacuation, or regulatory action.
Operational Impact
How long can the facility function without this asset? A boiler in winter scores 5; a backup generator that already has N+1 redundancy scores 2. Downtime hours per failure event drive this score.
Environmental & Regulatory
Would failure trigger an EPA reportable event, OSHA citation, or FMCSA violation? Fuel storage tanks, chemical dosing systems, and refrigeration plants carry high consequence even if replacement cost is modest.
Financial & Replacement
What is the total cost of a failure — repair, lost revenue, SLA penalties, and business interruption? An HVAC compressor may cost $8K to replace but $40K/day in lost tenant revenue, pushing its real financial consequence far above sticker price.
Why replacement cost misleads your FM risk assessment
The most common mistake in facility asset risk analysis is ranking assets by capital replacement value. A $250K decorative facade panel scores high on cost but near zero on failure consequence. A $4,500 sump pump in a sub-level data center scores low on cost but catastrophic on consequence if it fails during a storm.
| Asset | Replacement Cost | Failure Consequence | Criticality Score | Correct Priority |
|---|---|---|---|---|
| Sub-level sump pump (data center) | $4,500 | Catastrophic — flooding takes 200 racks offline | 5 — Critical | Weekly inspection, redundant unit, auto-alerts |
| Building facade panel | $250,000 | Low — aesthetic, no operational impact | 1 — Low | Annual visual inspection only |
| Main electrical switchgear | $85,000 | Severe — full building power loss, 6–12 hr outage | 5 — Critical | Thermographic scans quarterly, predictive sensors |
| Office area HVAC unit (floor 4) | $18,000 | Moderate — comfort complaint, tenant lease risk | 3 — Moderate | Standard PM quarterly, 4-hr response SLA |
| Lobby decorative fountain pump | $1,200 | Negligible — no operational or safety impact | 1 — Low | Run-to-failure, no scheduled PM |
| Fire suppression booster pump | $22,000 | Catastrophic — life safety, insurance, legal liability | 5 — Critical | Weekly test, NFPA 25 compliance, instant alerts |
A 180-asset manufacturing facility spending $42K/yr on blanket PM
A mid-sized plant was running the same quarterly PM cycle across all 180 assets — regardless of whether the equipment was a critical process chiller or a rarely-used utility exhaust fan. After conducting an asset criticality assessment, facility managers reclassified 27 assets as critical (score 4–5), 64 as moderate (score 3), and 89 as low (score 1–2). They shifted PM labor toward the critical tier, added predictive vibration sensors to 12 high-consequence rotating assets, and moved 89 low-criticality assets to run-to-failure or annual-only inspection. Result: 31% reduction in scheduled PM hours, $13K/year in labor reallocation, and a 47% drop in unplanned downtime events over the following 12 months — because attention finally matched risk.
FM failure consequence: mapping likelihood against impact
A complete FM risk analysis pairs consequence (how bad) with likelihood (how probable). The intersection produces a risk priority number that drives maintenance strategy: predictive maintenance for high-likelihood/high-consequence assets, preventive for moderate combinations, and corrective-only for low/low cells.
| Consequence 1 — Negligible | Consequence 3 — Moderate | Consequence 5 — Catastrophic | |
|---|---|---|---|
| Likelihood 4–5 (Frequent) | Low — Run to failure | Medium — Standard PM | Critical — Predictive + redundancy |
| Likelihood 2–3 (Occasional) | Low — Corrective only | Medium — PM + condition monitoring | High — Predictive maintenance |
| Likelihood 1 (Rare) | Low — No action | Low — Annual inspection | Medium — PM + spare parts buffer |
Strategy: Predictive maintenance with IoT sensors (vibration, temperature, oil analysis), redundant systems where feasible, critical spares always in stock, 1-hour response SLA, and automatic work-order escalation on anomaly detection.
Strategy: Time-based preventive maintenance on a 30–90 day cycle, condition checks during rounds, standard spares stocked, 8-hour response SLA, and quarterly criticality review.
Strategy: Run-to-failure with annual visual inspection, no dedicated spare parts inventory, next-business-day response, and re-evaluation only if business context changes.
See how OxMaint ranks your assets by real failure consequence
Book a 30-minute demo and we'll walk through your asset list — showing exactly how criticality scoring, automated PM scheduling, and predictive alerts work inside the platform.
How OxMaint turns your facility risk register into automated action
A spreadsheet risk register is a static document that decays the day after you build it. OxMaint's AI-powered CMMS embeds criticality directly into the maintenance workflow — so every work order, PM trigger, and spare-parts reorder is automatically prioritized by the asset's consequence score, not by who shouts loudest.
Criticality-driven work-order priority
Every asset carries its criticality score in OxMaint. When a work order is created — manually, via inspection, or by a predictive sensor alert — the system auto-assigns priority based on the asset's failure consequence. Critical-tier work orders escalate to supervisors if not acknowledged within the SLA window, cutting response time on high-impact failures by up to 60%.
Predictive maintenance on critical assets
OxMaint's AI engine analyzes vibration, temperature, and runtime data from IoT sensors on your top-tier assets — detecting bearing degradation, motor imbalance, and thermal anomalies 2–6 weeks before failure. Facilities using predictive alerts on critical assets typically cut unplanned downtime 30–50% and reduce emergency repair spend by 25–40%.
Auto-calibrated PM frequency
OxMaint maps each asset's criticality score to a recommended PM schedule — weekly for critical, quarterly for moderate, annual or run-to-failure for low. As asset condition data accumulates, the AI adjusts frequency up or down, eliminating over-maintenance on low-risk equipment and under-maintenance on high-risk systems. Most teams reclaim 20–30% of PM labor hours.
Critical spares & inventory linkage
The risk register feeds directly into spare-parts policy: OxMaint maintains minimum stock levels for parts tied to critical-tier assets and auto-generates reorder alerts when inventory dips. No more discovering the spare belt is out of stock after the conveyor is already down — parts readiness for critical assets reaches 95%+ within the first quarter.
From spreadsheet to live risk register: a 90-day rollout timeline
Most facility teams can move from a static Excel risk register to a fully operational, criticality-driven CMMS in under 90 days. Here's what a realistic implementation looks like — and why OxMaint's onboarding compresses what used to take 9–12 months into a single quarter.
Asset inventory & data import
Upload your existing asset list, floor plans, and equipment specs into OxMaint via CSV import or API integration with your ERP/IWMS. Typical facility: 200–2,000 assets imported and verified in 1–2 weeks. OxMaint auto-categorizes assets by type, location, and system.
Criticality assessment workshop
Facility managers and OxMaint specialists jointly score each asset across safety, operational impact, environmental, financial, and compliance dimensions. OxMaint provides industry-benchmark templates so scoring takes minutes per asset, not hours. Output: a completed FM risk register with 1–5 criticality scores for every asset.
PM recalibration & sensor deployment
OxMaint auto-generates revised PM schedules based on criticality tiers. IoT sensors are deployed on the top 10–20 critical assets. Work-order priority rules, escalation paths, and spare-parts minimums are configured. The old blanket-PM schedule is retired.
Go live & first KPI review
Full cutover from spreadsheets and legacy systems. Technicians use the OxMaint mobile app for all work orders. First analytics dashboard review at day 90: baseline downtime, PM compliance rate, mean time to repair, and critical-asset availability — establishing the metrics the risk register is now actively improving.
FM risk register and asset criticality: frequently asked questions
What is an FM risk register and why does asset criticality matter?
An FM risk register is a structured document — ideally living inside a CMMS rather than a spreadsheet — that lists every facility asset, its failure modes, the consequences of failure, and the controls in place to mitigate risk. Asset criticality matters because it transforms the register from a compliance artifact into a prioritization tool: it tells your team which 15% of assets deserve 80% of preventive effort, sensor investment, and spare-parts budget. Without criticality scoring, every asset is treated equally, which means the truly dangerous ones are under-protected. You can book a demo to see how OxMaint automates this scoring.
How do you calculate asset criticality for a facility risk assessment?
Asset criticality is calculated by scoring each asset's failure consequence across multiple dimensions — typically safety, operational impact, environmental/regulatory, financial, and compliance — on a 1–5 scale, then applying organization-specific weights to produce a composite score. For example, a hospital might weight safety at 40% and financial at 15%, while a manufacturing plant weights operational impact at 45%. The composite score places each asset into a criticality tier (critical, moderate, or low), which then drives PM frequency, spare-parts policy, and response SLA.
How often should a facility risk register be reviewed and updated?
A facility risk register should be reviewed at least annually, with dynamic updates whenever business context changes — new equipment installed, occupancy shifts, production lines added, or regulatory requirements updated. Best practice is a quarterly review of critical-tier assets (whose context changes most often) and an annual full-register refresh. OxMaint makes this continuous rather than episodic: criticality scores auto-adjust as asset condition data, failure history, and runtime patterns accumulate.
What is the difference between asset criticality and asset risk?
Asset criticality measures the consequence of failure — how bad the outcome is if the asset goes down, regardless of how likely that is. Asset risk combines consequence with likelihood: a high-criticality asset that rarely fails may carry lower risk than a moderate-criticality asset that fails monthly. A complete FM risk analysis uses both: criticality ranking to set maintenance strategy and spare-parts policy, and likelihood assessment (informed by failure history and condition data) to prioritize immediate action and predictive sensor deployment.
Can OxMaint import an existing facility risk register from Excel?
Yes. OxMaint accepts CSV and Excel imports of existing asset lists, risk registers, and PM schedules, and also offers API integration with ERP, IWMS, and BMS systems for automated data sync. During onboarding, OxMaint specialists map your existing criticality scores (or help you create them) into the platform's scoring framework, so your live risk register is operational within weeks, not months. You can start a free trial and import your asset list today.
Stop maintaining everything equally. Start maintaining what matters.
OxMaint's AI-powered CMMS turns your FM risk register into live, automated action — criticality-driven work orders, predictive maintenance on high-consequence assets, and spare-parts policies that actually match risk. Book a 30-minute demo and see it on your assets.
Free 14-day trial · No credit card