Building analytics sits in an awkward spot in budget meetings. The software cost is a line item, while the savings arrive as many small corrections: a damper that stops leaking, a schedule that no longer runs after hours, a bearing replaced before it seizes. Teams that cannot connect those corrections to dollars end up defending the spend every year. This guide breaks the return into five savings buckets, shows published evidence and a simple model you can adapt, and explains the mistakes that stall payback. It also shows how Oxmaint maintenance software turns analytics findings into tracked work and verified results.
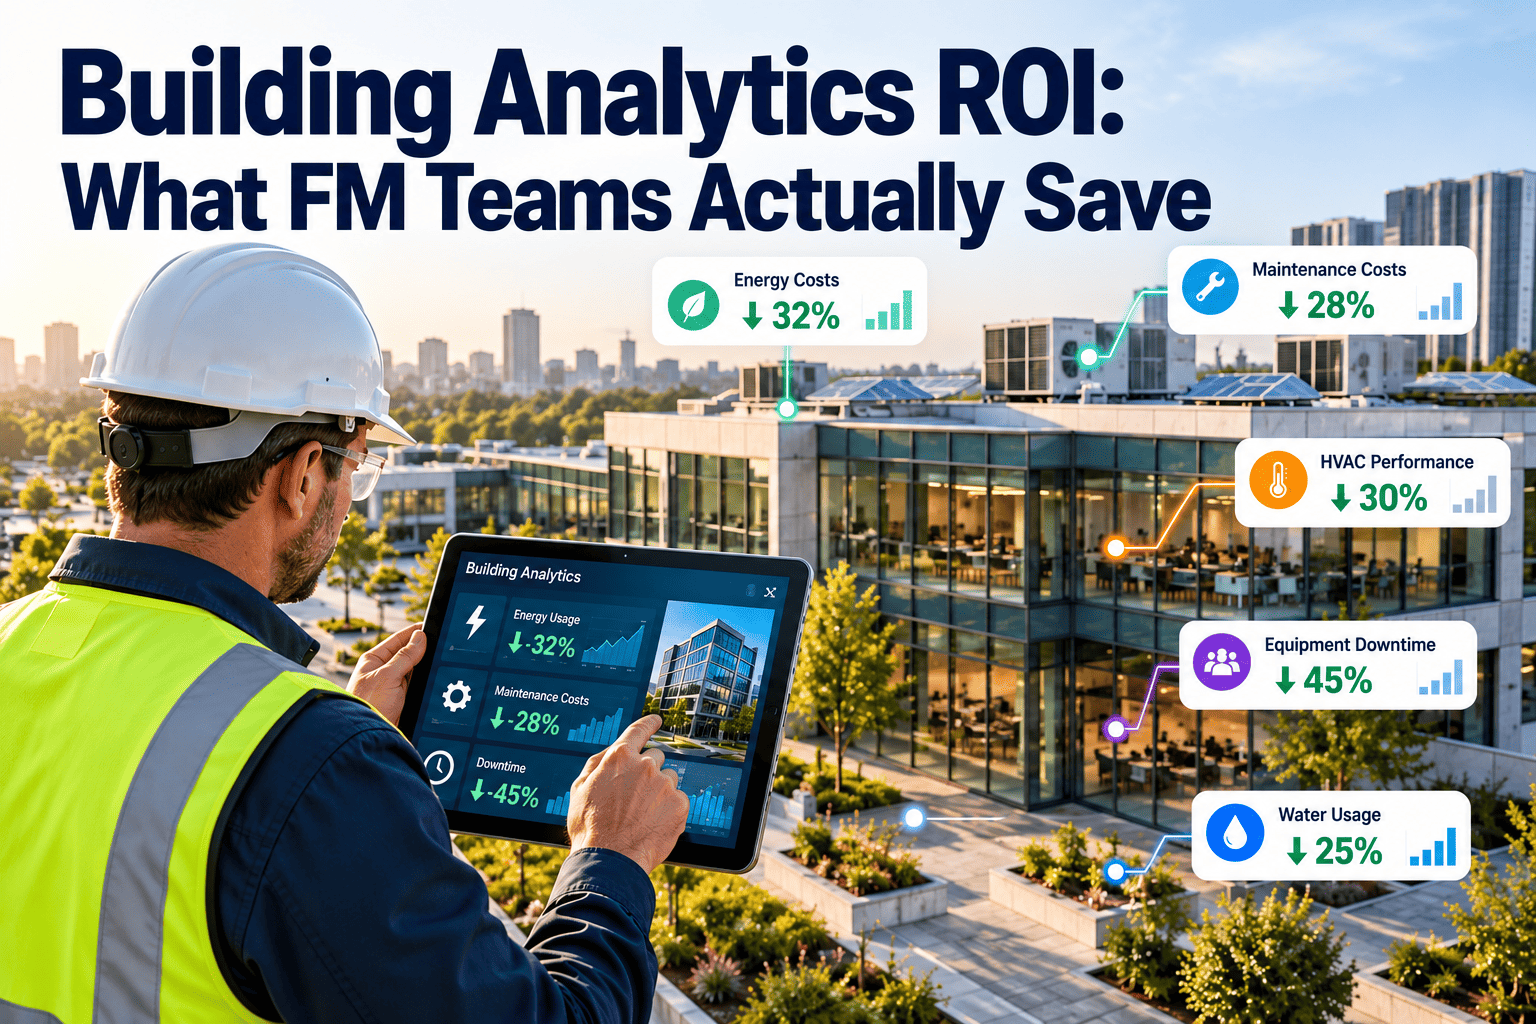
Building Analytics ROI: What FM Teams Actually Save
Building analytics pays back through energy, maintenance, comfort, and avoided failures, but only when findings become completed work. See where the savings come from and how to prove them.
Why building analytics ROI is a range, not one number
Published returns vary because buildings, data quality, and follow-through vary. Treat any single headline figure with caution until you know what sits behind it.
| Factor | Pushes ROI up | Pushes ROI down |
|---|---|---|
| Starting condition | Older controls with known waste, deferred tuning, and unreviewed schedules | Recently commissioned buildings with little waste to find |
| Analytics type | Fault detection and diagnostics that name causes and rank issues | Dashboards only, with no diagnosis or prioritization |
| Data quality | Mapped points, working sensors, and consistent equipment naming | Missing points, drifting sensors, and unclear tags |
| Staffing | Named owners who review findings weekly and close them | No time or authority to act on findings |
| Verification | A baseline and a method for measuring savings | No baseline, so savings stay claims |
| Time | Savings tracked over several years as fixes persist | Fixes that drift back because nobody rechecks them |
The five savings buckets and how to measure each
Separate hard savings, which show on a bill, from cost avoidance, which needs a defensible estimate. Finance teams accept both when each is labelled honestly.
Energy waste removed
Hard savings- Typical findings: simultaneous heating and cooling, leaking dampers and valves, schedules running outside occupancy, drifting setpoints.
- Measure: compare metered use against a weather-adjusted baseline before and after the fix.
- Caution: attribute savings only to fixes you can document.
Faster, planned maintenance
Productivity- Typical findings: diagnostics that point to the failing component, cutting investigation time.
- Measure: technician hours per fault before and after, and the share of work that is planned.
- Caution: hours saved only become dollars if the time is redeployed or overtime falls.
Fewer comfort complaints
Service level- Typical findings: zones that run hot or cold, stuck terminal units, and control loops that hunt.
- Measure: complaint tickets per month by building and cause.
- Caution: tie reductions to specific fixes to avoid crediting seasonal change.
Failures caught early
Cost avoidance- Typical findings: rising motor current, short cycling compressors, and valves that fail to respond.
- Measure: log each early catch with the likely failure cost, using your own repair history.
- Caution: record the logic behind every estimate so finance can audit it.
Reporting and audit time
Productivity- Typical findings: manual reports replaced by automated records of equipment performance.
- Measure: hours spent on monthly and compliance reporting before and after.
- Caution: count only time that is actually released.
What published evidence says
Three sources show the shape of the evidence. None is a promise for your building, and one is a vendor case study that should be read as such.
Berkeley Lab review of analytics users
- Drew on campaign data covering more than 400 million square feet of space.
- Owners reporting savings had a median of about $0.19 per square foot and 7 percent a year.
- Fault detection and diagnostic tools delivered higher savings than energy information systems, but also cost more.
- Savings tended to grow over time.
University of Iowa FDD program
- Facilities used fault detection to find issues across energy, occupant comfort, and maintenance.
- The program reported far more maintenance and comfort issues than energy ones.
- Findings were connected to the work order system so teams did not duplicate effort.
- Daily review meetings gave findings an owner and a workflow.
Johnson Controls real estate portfolio
- The vendor reported energy savings of about 15 percent against a baseline at one site.
- It also projected savings across energy and operations over five years.
- Results depend on the portfolio and are vendor-reported, so treat them as an example of method rather than a benchmark.
A worked ROI model you can adapt
Replace each input with your own figures. The example uses the published median savings only to show the arithmetic; it is not a forecast.
Where analytics ROI leaks away
Most projects that disappoint found plenty of issues. Value was lost between finding and fixing. Follow one finding through the pipeline to see where it stalls.
Mistakes that kill payback
- Buying analytics before cleaning up point naming and sensor health.
- Counting every identified issue as savings instead of only the fixed ones.
- Leaving findings in a separate inbox rather than in the work order system.
- Ignoring low-cost fixes because they look small, even though they repeat across buildings.
- Skipping rechecks, so fixed faults quietly return.
- Reporting savings without a baseline method that finance understands.
Where the findings usually come from
Different systems produce different kinds of savings. Knowing the common faults helps you decide which buildings and systems to connect first.
| System | Common fault found | Main bucket | How a technician confirms it |
|---|---|---|---|
| Air handling units | Dampers leaking or stuck, causing heating and cooling to fight each other | Energy, comfort | Check actuator travel, linkage, and damper position against command |
| Terminal units | Stuck dampers or reheat valves that never close | Comfort, energy | Compare commanded and actual position, and inspect the valve |
| Chilled water plant | Poor staging, low delta-T, and setpoints that drift | Energy | Review loading and temperature data, then check sensors and valves |
| Pumps and fans | Rising current, vibration, or speed that does not follow demand | Failures caught early | Inspect couplings, bearings, belts, and drive settings |
| Controls and schedules | Equipment running outside occupied hours or overrides left on | Energy | Review schedule, overrides, and occupancy data with operations |
| Sensors | Drift or failure that distorts control decisions | Energy, comfort | Verify against a calibrated reference and replace if needed |
Make every finding a tracked work order
Capture assets, work orders, and completed repairs in one place so analytics findings become verified results.
How Oxmaint supports the savings you claim
Analytics tools detect and rank issues. Maintenance software is where the work is assigned, completed, and recorded, which is what makes the savings defensible.
Proving savings: a verification routine finance will accept
Savings that cannot be traced are easy to dismiss. Build the method before the first fix.
- Fix a baselineChoose a pre-fix period and adjust for weather and occupancy where relevant.
- Log each fixRecord the finding, work order, date, and expected effect.
- Measure the changeCompare metered data after the fix against the baseline.
- Label the resultMark each amount as hard savings, productivity, or cost avoidance.
- Recheck laterConfirm the fix persisted and reopen it if behavior drifted.
Run a 90-day pilot before a portfolio rollout
A pilot proves the follow-through process as much as the technology. Choose a building with known complaints and a team willing to act on findings.
Questions to ask any analytics vendor
- How are issues ranked, and can ranking be tuned to our priorities?
- What does the system show about root cause, rather than only symptoms?
- How does it handle missing or unreliable points?
- How are savings estimated, and can we inspect the method?
- What does integration with our work order system involve?
- Who supports tuning and rule changes after go-live?
The one-page business case your finance team will read
Open with the cost of doing nothing, then show the proposal in layers. Keep the technology in an appendix.
- Baseline: current energy spend, maintenance spend, planned versus unplanned work, and complaint volume.
- Scope: buildings and systems covered, with the reasons for choosing them.
- Savings in two layers: hard savings first, then labelled cost avoidance and productivity.
- Costs in full: software, integration, staff time, and any fixes that need capital.
- Risks: data quality, staffing, and what happens if findings are not acted on.
- Verification: the baseline method and the review schedule that will confirm results.
Objections you will hear, and honest answers
A good business case names the doubts before the committee does.
| Objection | Honest answer |
|---|---|
| We already have a building management system | The system controls equipment. Analytics reviews its data continuously to find waste and faults that operators do not have time to spot. |
| Our team is too stretched to act on more alerts | Then start with a small scope, rank findings by impact, and measure the hours released by faster diagnosis before expanding. |
| Savings estimates are always inflated | Report hard savings separately, show the baseline method, and recheck fixes later. Credibility comes from the method. |
| We can wait until equipment fails | Waiting turns small, cheap corrections into emergency repairs and tenant complaints, and the failure history will show what that has cost. |
| Our data is not good enough | That is the first fix, not a reason to stop. Sensor and naming clean-up also benefits maintenance records. |
KPIs for a building analytics program
Measure follow-through as closely as savings. Follow-through is what you control.
Findings closed
Findings with a completed work order divided by findings raisedTime to fix
Days from finding to completed work order, by priorityVerified savings
Savings with a baseline and measured result, as a share of claimed savingsPlanned work share
Planned work orders divided by all work ordersComfort tickets
Complaint tickets per month by building and causeRepeat faults
Faults reopened after closure divided by faults closedBuilding analytics ROI FAQs
What is a realistic payback for building analytics?
It varies with building condition, analytics type, and follow-through. Published studies show a wide spread, so calculate your own using a baseline and verified savings.
Do fault detection tools pay back faster than dashboards?
Research suggests diagnostic tools find more savings but cost more. Net return depends on whether your team acts on what they find.
How should we treat avoided failure costs?
Log each early catch with the reasoning behind its estimated cost, and label it as cost avoidance, separate from hard savings. Book a demo to see how work history supports this.
What data do we need before starting?
Reliable meter data, mapped control points, consistent equipment names, and a named owner for findings. Fix obvious sensor problems first.
How does Oxmaint help prove ROI?
It records every finding-driven work order, labor hour, and part against the asset, giving finance an audit trail. Create an account to build your asset records.
Turn analytics findings into proven savings
Give your facility team one record of assets, work orders, and results, so the return you report is the return you can show.