![university-sustainability-initiatives-carbon-tracking-scope-1-2-3-cmms[1]](./manage-post-2k26/uploads/university-sustainability-initiatives-carbon-tracking-scope-1-2-3-cmms[1].png)
Universities across the United States, Canada, the UK, and Australia have committed to ambitious carbon neutrality targets — over 400 institutions have signed the Second Nature Climate Commitment, and AASHE STARS reporting now covers more than 1,000 campuses globally. Yet the gap between a published climate action plan and the operational data required to prove progress remains enormous. Scope 1 emissions from campus boilers, fleet vehicles, and backup generators require maintenance-linked fuel and refrigerant records. Scope 2 emissions from purchased electricity demand building-level energy tracking tied to equipment efficiency data. Scope 3 emissions — the most complex category — require procurement records, commuter surveys, and supply chain documentation that most sustainability offices assemble manually from dozens of disconnected sources. The single largest source of verifiable Scope 1 and Scope 2 data on any campus is the facilities maintenance system — because every boiler tune-up, chiller overhaul, refrigerant recharge, and fleet vehicle service event generates the consumption and efficiency records that GHG inventories require. Campuses that run maintenance on spreadsheets and paper work orders spend 120+ staff hours per reporting cycle manually reconstructing data that a CMMS captures automatically with every completed work order. Oxmaint gives university facilities teams a unified asset registry with condition scoring, preventive maintenance scheduling tied to energy-consuming equipment, and exportable maintenance records that feed directly into GHG inventory calculations — reducing reporting effort by up to 72% while improving data accuracy for AASHE STARS submissions, Second Nature reports, and board-level sustainability dashboards. If your campus sustainability office is still requesting maintenance data by email three weeks before the reporting deadline, start a free trial or book a demo to see how CMMS-integrated carbon tracking works for multi-building campuses.
University Sustainability Initiatives: Carbon Tracking, Scope 1/2/3, and CMMS Data
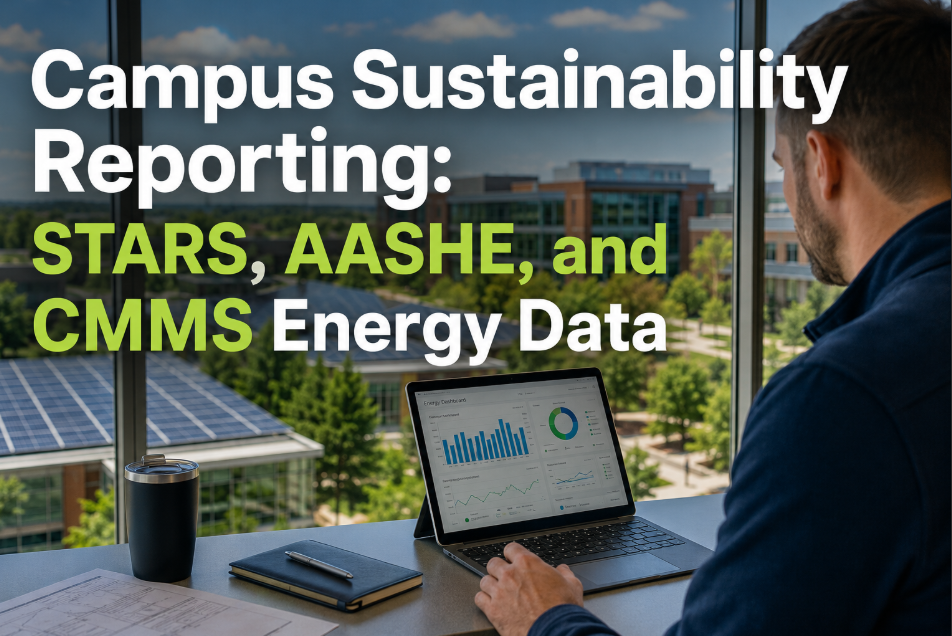
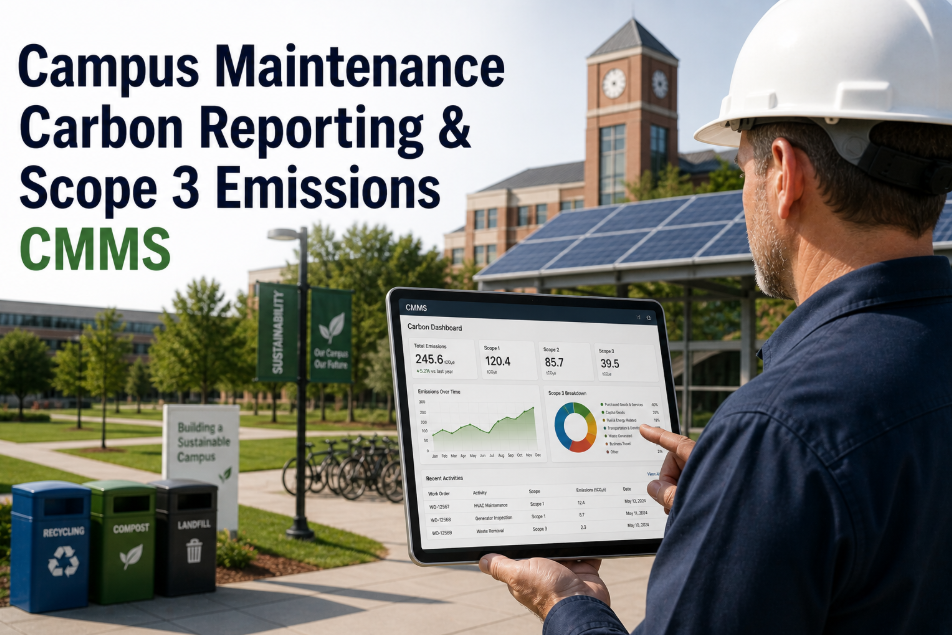
Climate action plans require verifiable emissions data. The richest source of Scope 1 and Scope 2 evidence on any campus is the maintenance system — fuel records, refrigerant logs, equipment efficiency data, and fleet service history. CMMS-integrated tracking turns maintenance records into audit-ready carbon evidence.
Your Maintenance Records Are Your Carbon Evidence
Every boiler service record contains fuel consumption data. Every chiller overhaul documents refrigerant type and quantity. Every fleet PM captures mileage and fuel use. Every HVAC filter change affects energy efficiency. These are not just maintenance events — they are the raw inputs for Scope 1 and Scope 2 GHG calculations. Oxmaint captures them automatically with every completed work order, making carbon reporting a byproduct of good maintenance practice rather than a separate annual data-gathering project. See how your campus maintenance data maps to GHG inventory requirements — start a free trial or book a demo to walk through the integration with your sustainability office.
Understanding Scope 1, 2, and 3 Emissions on a University Campus
The GHG Protocol divides emissions into three scopes based on operational control and source origin. Each scope requires different data sources, different calculation methodologies, and different levels of facility operations involvement. For most universities, Scope 1 and Scope 2 account for 60–80% of reported emissions — and both are dominated by data that originates in the maintenance department.
Six Carbon Data Gaps That Manual Maintenance Records Create
Sustainability offices depend on facilities data that most maintenance teams capture inconsistently, store in disconnected systems, and deliver late. The result is GHG inventories built on estimates rather than evidence — inventories that cannot withstand third-party verification or support the capital investment decisions that net-zero plans require.
EPA Section 608 requires refrigerant tracking, but most campuses record recharges on paper service tickets disconnected from the chiller asset record. Without equipment-linked logs, the sustainability office cannot calculate fugitive emissions by building, by system age, or by refrigerant type — three breakdowns required by AASHE STARS reporting.
Campus fleet fuel consumption is split between fuel card systems, vehicle PM records, and departmental charge-back spreadsheets. Reconciling these sources into a single Scope 1 fleet emissions figure consumes 15–25 staff hours per reporting cycle — and the resulting number carries a margin of error that auditors flag consistently.
A campus boiler operating at 78% efficiency vs. 88% efficiency consumes 13% more fuel for the same heating output — directly inflating Scope 1 emissions. Without CMMS-tracked combustion efficiency records from annual tune-ups, the sustainability office uses nameplate efficiency assumptions that may be 10+ years out of date.
AASHE STARS v3 and Second Nature now expect Scope 3 reporting to include purchased goods and services. MRO procurement — spare parts, filters, lubricants, cleaning chemicals — represents a significant purchased-goods category that most sustainability offices omit entirely because the data lives in maintenance storeroom records, not in the procurement ERP.
Replacing a 30-year-old boiler with a high-efficiency condensing unit reduces Scope 1 emissions by 15–25%. But without historical fuel consumption and efficiency records from the existing equipment, the sustainability office cannot quantify the projected emissions reduction — and cannot build the business case that competes for limited capital budget allocation.
When the AASHE STARS or Second Nature reporting deadline arrives, facilities teams have 2–3 weeks to produce 12 months of emissions-relevant data from maintenance records. The time pressure forces estimates, rounded numbers, and missing-data placeholders — producing a GHG inventory that technically meets the submission deadline but would not survive a third-party verification audit.
How Oxmaint Turns Maintenance Data into Carbon Evidence
Oxmaint does not replace your sustainability reporting platform — it feeds it. Every completed work order, every PM record, every refrigerant recharge, every fleet service event, and every equipment efficiency measurement is captured digitally, linked to the asset, and exportable in the format your sustainability office needs. Carbon tracking becomes a continuous byproduct of standard maintenance operations — not a separate annual data project. Campuses ready to connect maintenance and sustainability workflows can start a free trial or book a demo to see the data integration in action.
Register boilers, chillers, fleet vehicles, generators, and lab equipment in Oxmaint's asset hierarchy: Campus > Building > System > Equipment. Each asset carries fuel type, refrigerant type, rated efficiency, and installation date — the baseline data fields that GHG calculations require.
Every refrigerant recharge is logged against the specific chiller with date, technician, refrigerant type, quantity added, and leak rate calculation. These records feed Scope 1 fugitive emissions calculations directly — and satisfy EPA Section 608 documentation requirements simultaneously.
Fleet PM records capture odometer readings, fuel consumption per service interval, and vehicle type. Oxmaint calculates per-vehicle and fleet-wide fuel consumption automatically — providing the Scope 1 transportation emissions data that sustainability offices currently reconstruct from fuel card reports.
Annual boiler tune-up records include combustion efficiency measurements. Chiller PM records capture COP and kW/ton performance. This data creates equipment-level efficiency trend lines that quantify degradation, justify capital replacement, and project emissions reductions from equipment upgrades.
Oxmaint's spare parts inventory and procurement records capture vendor, quantity, cost, and material type for every MRO purchase. This data feeds the purchased goods and services category of Scope 3 reporting — a category most campuses currently estimate or omit entirely.
Generate exportable reports by emission source, by building, by date range, or by scope category. When the AASHE STARS deadline arrives, the maintenance-side data is already organized, verified, and formatted — reducing the reporting cycle from weeks of manual assembly to a single export operation.
Manual Carbon Reporting vs. CMMS-Integrated Carbon Tracking
What Campuses Measure After Connecting Maintenance to Sustainability
Sustainability offices reduce GHG data assembly time from 120+ hours to under 35 hours per cycle when maintenance records are CMMS-captured and exportable
CMMS efficiency trend data provides the capital justification for boiler and chiller replacements that produce measurable emissions reductions
Every recharge event is logged with technician, equipment, quantity, and leak rate — satisfying both EPA 608 and AASHE STARS fugitive emission requirements
Complete, verifiable emissions data across all three scopes positions campuses for higher STARS ratings and stronger climate commitment documentation
Frequently Asked Questions
Does Oxmaint calculate GHG emissions directly, or does it provide the data inputs?+
How does Oxmaint handle campuses with 50+ buildings and multiple emission source types?+
Can Oxmaint support Scope 3 reporting for MRO procurement?+
What reporting frameworks does the exported data support?+
Your Climate Action Plan Deserves Better Data Than Estimates and Assumptions
Every work order your maintenance team completes contains carbon data — fuel consumed, refrigerant recharged, equipment efficiency measured, parts procured. Oxmaint captures it all automatically, links it to the right asset and building, and makes it exportable for sustainability reporting. No implementation project. No separate carbon tracking software. First data flowing from maintenance to sustainability in week one.