![university-property-insurance-underwriting-cmms-documentation[1]](./manage-post-2k26/uploads/university-property-insurance-underwriting-cmms-documentation[1].png)
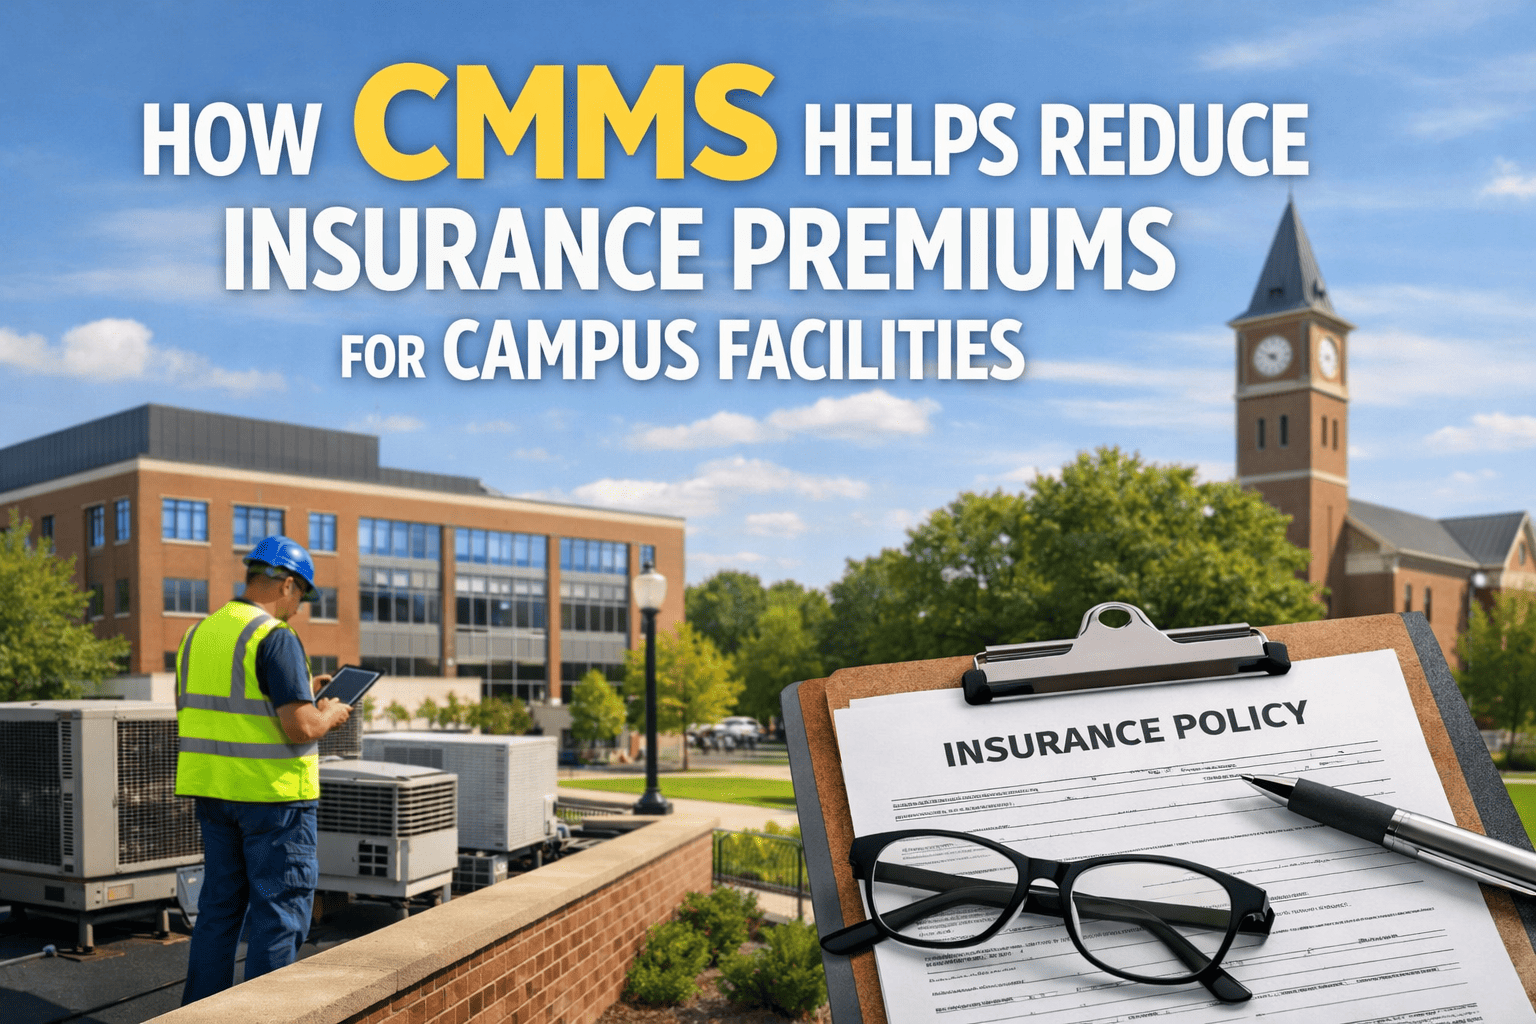
University property insurance premiums have increased by an average of 18–25% annually since 2020, driven by rising construction costs, climate-related property losses, and a hardening commercial insurance market that shows no signs of softening. For a mid-size university with $2–4 billion in insured property values across 80–150 buildings, the annual property insurance premium typically ranges from $3 million to $12 million — and every percentage point of premium increase represents tens of thousands of dollars in additional operating cost that comes directly from the institutional budget. What most university risk managers and CFOs do not fully appreciate is that property insurance underwriters make pricing decisions based heavily on the quality of maintenance documentation they receive during the submission process. An underwriter evaluating a campus with a Facility Condition Index of 0.12, documented PM compliance above 90%, and a 10-year CapEx forecast backed by asset condition data will price that risk fundamentally differently than a campus that submits building age, square footage, and a list of recent claims with no maintenance context. The maintenance data that drives favorable underwriting outcomes — PM completion rates, inspection records, asset condition scores, capital renewal history, and work order response metrics — is precisely the data that a properly configured CMMS generates automatically. Campuses that rely on spreadsheets, paper inspection logs, and verbal assurances during broker meetings leave premium savings on the table every renewal cycle. Oxmaint provides university facilities teams the asset registry, condition scoring, PM compliance tracking, and exportable documentation that insurance underwriters evaluate when pricing campus property risk — with data quality that stands up to loss control inspections and supports URMIA best practices for risk documentation. If your next renewal is approaching and your maintenance documentation is not underwriter-ready, start a free trial or book a demo to see how CMMS-generated insurance evidence works for campus portfolios.
University Property Insurance Underwriting and CMMS Documentation
Insurance underwriters price campus property risk based on maintenance evidence — PM compliance, FCI scores, inspection logs, and capital renewal history. CMMS-generated documentation reduces premiums and improves underwriting outcomes measurably.
Your Insurance Premium Is Partly a Maintenance Documentation Score
Property insurance underwriters evaluate three categories of evidence when pricing campus risk: claim history (which you cannot change retroactively), building characteristics (which change slowly through capital investment), and maintenance quality (which you can document and improve continuously). The third category is where CMMS data creates measurable premium impact — because it converts verbal assurances about maintenance quality into verifiable, exportable evidence that underwriters can incorporate into their pricing models. Campuses that present underwriter-ready maintenance data during renewal submissions consistently achieve more favorable terms. Build your insurance evidence portfolio now — start a free trial or book a demo to prepare for your next renewal cycle.
Six Maintenance Data Points That Insurance Underwriters Evaluate
Underwriters do not price campus property risk on building age and square footage alone. They evaluate maintenance quality as a proxy for loss probability — because well-maintained buildings produce fewer claims, smaller losses, and more predictable risk profiles. Here are the six data points that directly influence your premium.
FCI is the ratio of deferred maintenance cost to current replacement value. Underwriters view FCI below 0.10 as well-maintained, 0.10–0.20 as fair, and above 0.30 as poor. A campus presenting building-level FCI data demonstrates asset-level awareness that translates directly to lower risk assessment. 85% of commercial property underwriters consider FCI or equivalent condition metrics in their pricing models.
Preventive maintenance compliance above 90% demonstrates systematic care. Underwriters pay particular attention to PM compliance for fire protection systems, electrical distribution, roofing, and plumbing — the four system categories that generate 72% of campus property claims. A campus that cannot document PM compliance for these systems signals uncontrolled risk.
Fire suppression, backflow prevention, elevator, and electrical switchgear inspections are statutory requirements — but underwriters evaluate whether records are complete, current, and traceable. Missing inspection records for fire sprinkler systems alone can result in premium surcharges of 5–10% on the affected buildings.
A documented 5–10 year capital renewal plan backed by asset condition data signals proactive risk management. Underwriters view campuses with funded capital plans as lower risk because aging infrastructure is being replaced before failure — reducing the probability of catastrophic loss events from system failures.
Average time from reported issue to resolution demonstrates operational responsiveness. Campuses with documented work order response times under 4 hours for emergency issues and under 48 hours for standard issues show underwriters that problems are addressed before they escalate to claim-generating events.
After loss control inspections, insurers issue recommendations — repair the deteriorating roof section, replace aging water heaters, upgrade electrical panels. Documented compliance with prior recommendations is the strongest signal an underwriter receives that the campus takes risk mitigation seriously. Non-compliance with prior recommendations can trigger coverage restrictions or premium penalties of 10–20%.
How Oxmaint Builds Underwriter-Ready Maintenance Evidence
Oxmaint generates the maintenance documentation that insurance underwriters evaluate — not as a separate reporting project, but as a continuous byproduct of daily maintenance operations. Every PM completion, every inspection record, every condition score update, and every capital renewal project is captured, timestamped, and exportable for broker submissions, loss control visits, and renewal negotiations. Campuses preparing for their next renewal cycle can start a free trial or book a demo to build their insurance evidence portfolio.
Oxmaint's condition scoring system tracks each asset's current condition, deferred maintenance backlog, and replacement cost — calculating FCI at the building, system, and portfolio level. Export building-level FCI reports formatted for insurance submissions.
Track and export PM compliance rates by system category — the exact breakdown underwriters evaluate. Dashboard shows current compliance percentage, overdue items, and trend direction for each system across every building.
Every fire suppression, elevator, electrical, and statutory inspection is logged with date, inspector, results, and digital signature. When the loss control engineer asks for three years of fire sprinkler inspection records, the export takes minutes.
Oxmaint's rolling CapEx forecasting models project capital renewal needs based on actual asset condition data — not age-based assumptions. Present underwriters with a funded, data-backed capital plan that demonstrates proactive risk management.
Export average response time, resolution time, and completion rate by priority level and building. Demonstrate to underwriters that emergency maintenance issues are addressed within SLA windows — reducing the probability of small issues escalating to insurable events.
Log every insurance loss control recommendation as a tracked work order. Document compliance with completion date, before/after photos, and technician sign-off. Present 100% recommendation compliance at the next renewal — the strongest signal of risk management discipline an underwriter can receive.
Typical Insurance Submission vs. CMMS-Enhanced Submission
Insurance Outcomes Campuses Report with CMMS Documentation
Campuses presenting CMMS-generated maintenance evidence achieve measurably better underwriting outcomes than those relying on verbal assurances and basic building data
Every recommendation tracked as a work order with documented completion — eliminating the premium penalties and coverage restrictions that follow non-compliance
vs. weeks of manual data assembly — continuous CMMS capture means insurance-ready data is always current and immediately exportable for broker or underwriter requests
CMMS-documented maintenance programs align with URMIA risk management standards — strengthening the institutional risk management narrative during insurance negotiations
Frequently Asked Questions
How much premium reduction can CMMS documentation realistically achieve?+
What data format do insurance brokers and underwriters prefer?+
Should the risk management office or facilities department own the insurance data preparation?+
How does FCI calculation work in Oxmaint?+
Your Next Insurance Renewal Should Include Maintenance Evidence, Not Just Building Data
Every percentage point of premium reduction on a multi-million dollar insurance program represents real budget savings that can be redirected to deferred maintenance, capital renewal, or operations. The data that drives favorable underwriting is the same data that good maintenance programs generate daily — PM completion, inspection records, condition scores, and capital planning. Oxmaint captures it continuously and makes it export-ready for any broker, underwriter, or loss control visit. No implementation project. Insurance-ready data flowing from week one.