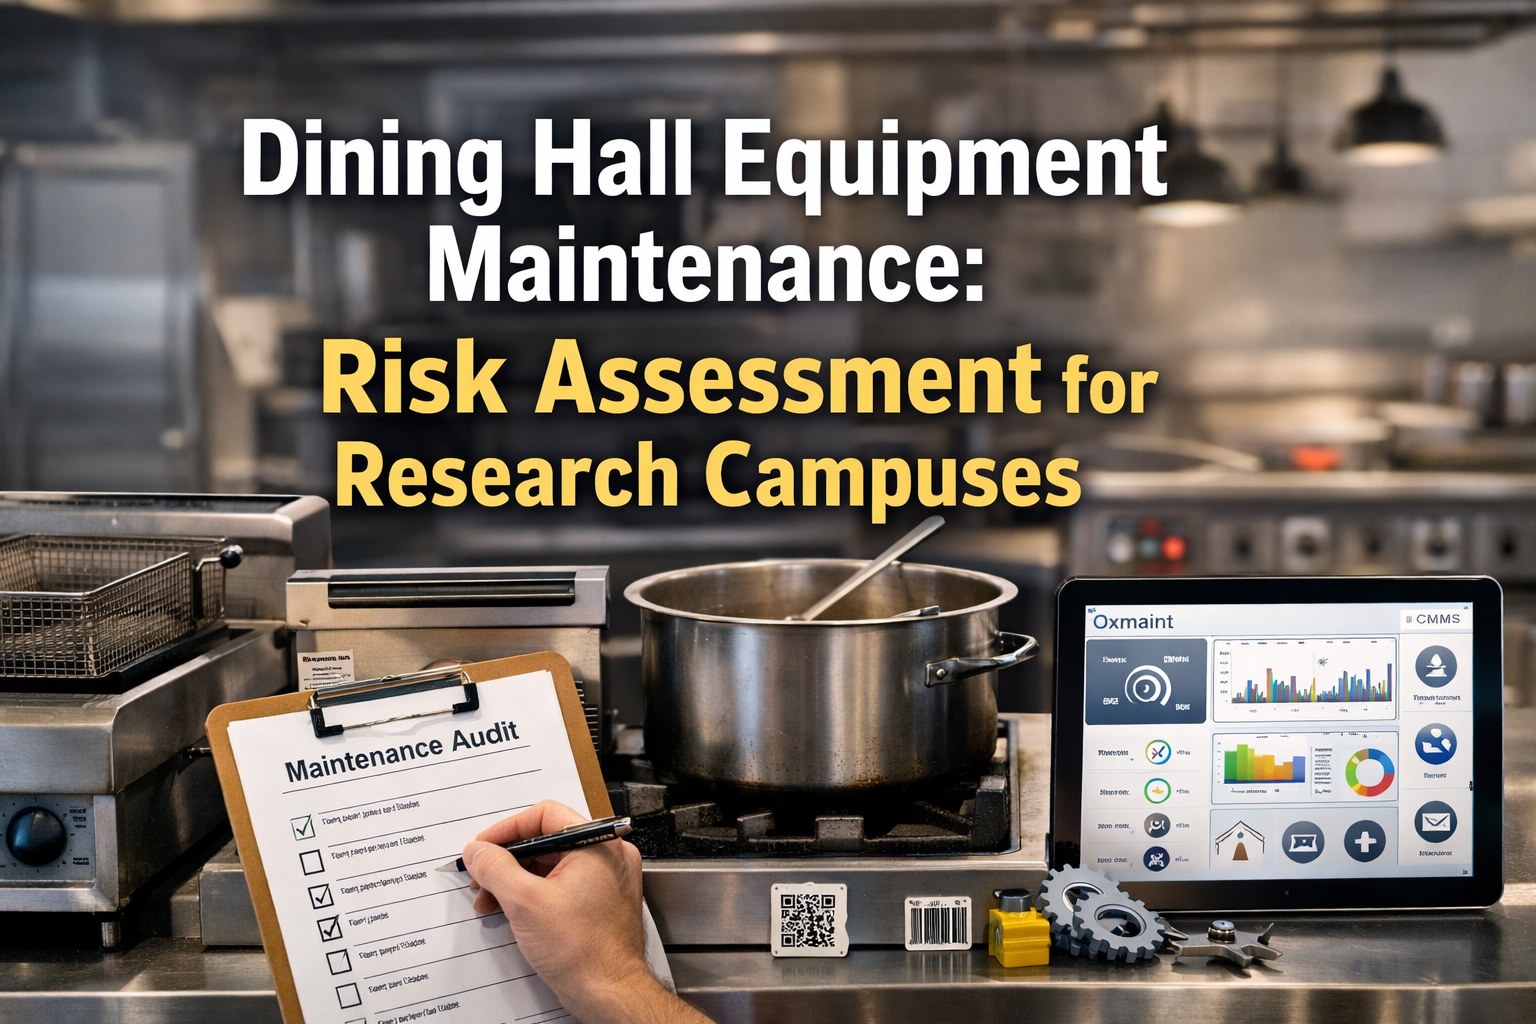
Research campus dining operations function at a scale that transforms routine equipment failures into institutional crises. Ohio State University serves 40,000 meals daily across 35 dining venues with an $80 million annual budget. Harvard's dining services delivers over 5 million meals each year. MIT operates extended-hour facilities supporting researchers who work through nights and weekends. At this operational intensity, a single walk-in cooler contains $15,000-$40,000 in perishable inventory at any given moment—and every piece of equipment runs harder, longer, and under more demanding conditions than typical food service operations.
Risk assessment fundamentally changes how successful dining operations allocate maintenance resources. Rather than applying identical attention to every asset or simply reacting when equipment fails, systematic risk evaluation identifies which equipment poses the greatest threat to operations, food safety, and budgets. The research campuses that consistently pass health inspections, maintain food safety compliance, and avoid budget-destroying emergency repairs share one characteristic: they understand precisely which equipment failures would be catastrophic and manage those assets accordingly.
40,000
Daily meals served
Major research university capacity
16-20
Operating hours daily
Extended service for researchers
$15K-$40K
Inventory per cooler
At risk during any failure
35+
Dining venues
Multiple locations to manage
The Core Challenge
Commercial kitchen equipment typically operates 8-12 hours daily. Research campus dining equipment runs 16-20 hours, accelerating wear patterns and compressing the window between early warning signs and complete failure. Standard maintenance intervals designed for typical restaurants are inadequate for this operational intensity.
The Financial Reality of Equipment Failure
Equipment failures in campus dining create cascading costs that extend far beyond repair bills. When a walk-in cooler fails overnight, the immediate inventory loss is just the beginning. Emergency service calls cost 3-5 times standard rates. Service disruptions force expensive food sourcing alternatives. Health code violations trigger inspections that consume staff time and create compliance documentation burdens. Understanding these true costs reveals why systematic risk assessment delivers substantial return on investment.
Immediate Losses
Spoiled inventory (proteins, dairy, produce)
$10,000 - $40,000
Emergency repair (weekend/after-hours)
$2,500 - $6,000
Operational Impact
Service disruption and menu changes
$3,000 - $8,000
Emergency food sourcing premium
$1,500 - $5,000
Compliance Consequences
Health code violation fines
$500 - $25,000
Follow-up inspection preparation
$2,000 - $5,000
Total Single-Incident Cost Range
$19,500 - $89,000
Severe cases involving foodborne illness liability can exceed $500,000
Campus dining directors who discuss equipment risk assessment with specialists often discover their annual emergency repair spending exceeds what a comprehensive preventive maintenance program would cost. The economics favor prevention, but only when maintenance resources target the right equipment.
Equipment Risk Assessment Framework
Effective risk assessment evaluates equipment across two dimensions: the probability of failure and the operational impact when failure occurs. Equipment with high scores on both dimensions requires the most intensive monitoring and maintenance. This systematic approach ensures limited maintenance resources deliver maximum protection against the failures that would cause the greatest operational and financial damage.
Walk-in Coolers & Freezers
$10,000-$40,000 inventory exposure • Food safety critical • Overnight failure risk
Hot Holding Equipment
Immediate food safety violation • No buffer time • Direct health risk
Primary Dishwashing Systems
Sanitation compliance critical • Service cannot continue without function
Combi Ovens & Steamers
High production dependency • Complex systems • Extended repair times
Reach-in Refrigeration
$2,000-$8,000 inventory • Multiple units provide some redundancy
Ventilation Hood Systems
Fire safety compliance • Air quality requirements • Kitchen closure if failed
Ranges, Grills & Fryers
Menu flexibility allows workarounds • Multiple units typical
Prep Equipment & Work Surfaces
Efficiency impact only • Easy temporary solutions available
Ice Machines & Beverage Systems
Service quality impact • Alternatives readily available
Temperature Monitoring: The Detection Gap
The FDA defines the temperature danger zone as 40°F to 140°F—the range where bacteria multiply rapidly. For research campus dining operations running extended hours, maintaining continuous temperature compliance across dozens of refrigeration units presents a significant challenge. The difference between manual temperature checks and continuous digital monitoring represents a critical detection gap that directly impacts food safety risk.
Manual Temperature Logs
Staff records temperatures every 2-4 hours during operating shifts
Continuous Digital Monitoring
IoT sensors measure and transmit readings every 2-5 minutes, 24/7
Detection Gap
51%
of temperature excursions missed by manual checks
Response Time
Minutes vs Hours
Digital alerts enable intervention before inventory loss
Documentation
Automatic
Timestamped records satisfy health inspector requirements
When a compressor begins failing at 2 AM, continuous monitoring systems alert staff within minutes—enabling response before temperatures reach the danger zone. Manual checks discover the same failure hours later, after inventory destruction. Campus dining operations evaluating their detection capabilities can schedule a demonstration of IoT monitoring integration to see how real-time alerts and automated documentation work in practice.
How Protected Is Your Operation?
Get a complimentary risk assessment identifying which equipment in your dining operation poses the greatest threat—and which monitoring gaps could be exposing you to preventable failures.
Building an Effective Preventive Maintenance Program
Research from the International Institute of Refrigeration demonstrates that systematic preventive maintenance reduces emergency refrigeration repairs by 70% and extends equipment lifespan by up to 40%. These outcomes require more than good intentions—they require structured programs with defined frequencies, clear accountability, and documentation systems that ensure tasks actually happen during demanding service periods when maintenance often gets deprioritized.
Daily
- Temperature verification and logging
- Visual inspection for leaks, sounds, warning lights
- Door seal integrity check
- Drain line flow verification
All refrigeration, hot holding, dishwashers
Weekly
- Condenser coil inspection and light cleaning
- Evaporator inspection
- Filter status check
- Fan blade and motor assessment
Walk-ins, reach-ins, ventilation hoods
Monthly
- Deep coil cleaning (evaporator and condenser)
- Thermostat and gauge calibration verification
- Gasket and seal replacement assessment
- Electrical connection inspection
All refrigeration, cooking equipment, dishwashers
Quarterly
- Refrigerant system professional inspection
- Comprehensive electrical systems audit
- Full asset inventory and condition assessment
- Replacement planning review
All major equipment (certified technician required)
Paper-based maintenance tracking consistently fails during busy periods when tasks compete with immediate service demands. Digital CMMS platforms generate work orders automatically, assign to available technicians, and document completion with timestamps that satisfy health inspectors. Teams ready to automate their maintenance scheduling can connect with implementation specialists to design workflows matching their operational requirements.
Calculating Return on Investment
Maintenance investments compete with other budget priorities. Decision-makers need clear financial justification demonstrating that preventive maintenance programs deliver measurable returns. The data consistently shows that systematic approaches pay for themselves quickly—often through a single prevented equipment failure that would have cost more than an entire year of program investment.
Prevented Inventory Spoilage
$24,000
Avoided Emergency Repairs
$18,500
Extended Equipment Lifespan
$15,000
Reduced Administrative Overhead
$12,000
Estimated Annual Benefit
$69,500
Typical System Investment
$4,800 - $9,600
Net Annual Return
$59,900 - $64,700
Expert Perspective: What Separates Successful Operations
"The campuses that consistently pass health inspections and maintain budget control share one characteristic: they can demonstrate compliance status at any moment, not just during scheduled inspections. Digital maintenance systems create automatic, timestamped documentation that health inspectors consider significantly more reliable than handwritten logs. When you can produce 90 days of temperature records in seconds, it signals operational competence that influences the entire inspection process."
Industry Analysis: Campus Dining Compliance Patterns
Documentation Speed Matters
Producing records instantly during inspections demonstrates systematic management. Searching through binders or spreadsheets raises questions about what else might be incomplete or missing.
Digital Timestamps Prove Authenticity
Electronic records with automatic timestamps cannot be backdated or fabricated. Health inspectors recognize this distinction and weight digital documentation as more credible evidence of actual compliance.
Data Enables Continuous Improvement
Aggregated maintenance data reveals patterns that inform equipment replacement timing, budget planning, and operational improvements—insights that paper-based systems cannot provide.
Campus dining operations evaluating their current compliance documentation can request a compliance readiness assessment to identify gaps before health inspectors do. The evaluation examines current processes against regulatory expectations and recommends specific improvements.
Implementation Timeline: From Assessment to Protection
Transitioning from reactive maintenance to systematic risk management does not require lengthy IT projects or extensive infrastructure changes. Cloud-based CMMS platforms deploy rapidly, with most campus dining operations achieving full operational status within 2-4 weeks. The implementation process follows a structured approach that minimizes disruption while building comprehensive protection.
Week 1
Foundation
Complete equipment inventory with QR code tagging, user account configuration, critical asset identification and prioritization
Week 2
Configuration
PM schedules built and automated, IoT sensors installed on critical refrigeration, alert routing and escalation paths configured
Week 3
Training
Staff training on mobile applications, work order workflow testing with real scenarios, historical maintenance data migration
Week 4
Full Operation
24/7 monitoring active, automated PM scheduling operational, compliance dashboards and reporting functional
Campus dining directors ready to evaluate how systematic risk management would apply to their specific operation can connect with higher education specialists for a consultation addressing their unique requirements, existing infrastructure, and operational constraints.
Protect Your Campus Dining Operation
Join research universities using Oxmaint to transform equipment maintenance from reactive firefighting to systematic risk management. See how predictive monitoring, automated scheduling, and compliance documentation work for multi-venue campus dining operations.
Trusted by 500+ facilities
24-hour setup available
No credit card required
Frequently Asked Questions
How should we prioritize which equipment to monitor first?
Begin with equipment where failure creates immediate food safety violations or significant financial exposure—typically walk-in coolers, freezers, and hot holding units. These critical assets should receive continuous IoT monitoring and daily inspection protocols. Next, address high-production cooking equipment and dishwashing systems that affect service capacity or sanitation compliance. Finally, inventory remaining equipment for standard preventive maintenance cycles. The goal is matching monitoring intensity to actual operational risk rather than treating all assets identically.
What is the actual difference between manual temperature logs and continuous monitoring?
Manual temperature checks capture point-in-time readings, typically every 2-4 hours during staffed shifts. Research demonstrates this approach detects only 46% of temperature excursions—meaning more than half of dangerous temperature events go unnoticed. Continuous digital monitoring uses IoT sensors measuring temperatures every 2-5 minutes around the clock, detecting 97% of excursions and alerting staff within minutes of problems developing. Digital systems also create automatic, timestamped audit trails that health inspectors consider substantially more reliable than handwritten documentation.
How quickly can a research campus implement a maintenance management system?
Most campus dining operations achieve full implementation within 2-4 weeks using cloud-based platforms that require no on-premise infrastructure installation. Week one covers equipment inventory and system configuration. Week two focuses on IoT sensor deployment and automated scheduling setup. Week three involves staff training and workflow validation. By week four, 24/7 monitoring, automated work orders, and compliance reporting are fully operational. Critical refrigeration monitoring can be active within days of project initiation for operations requiring accelerated deployment.
What return on investment can universities realistically expect?
Industry data indicates preventive maintenance programs reduce emergency repairs by 70% and extend equipment lifespan by up to 40%. For typical research campus dining operations, this translates to $50,000-$80,000 in annual savings through prevented spoilage, avoided emergency service premiums, deferred equipment replacement, and reduced administrative overhead. Most operations achieve positive ROI within 60-90 days—frequently from a single prevented equipment failure that would have cost substantially more than an entire year of system investment.
Will monitoring systems work with older existing equipment?
Yes. Wireless IoT temperature sensors function with any refrigeration equipment regardless of age, manufacturer, or model. The sensors are non-invasive and require no modification to existing equipment—they simply attach to units and begin transmitting data. For maintenance management, CMMS platforms track any asset added to the system, from decades-old walk-in coolers to recently purchased equipment. Older equipment often benefits most from monitoring because it is more failure-prone, making early warning detection more valuable for preventing costly breakdowns.