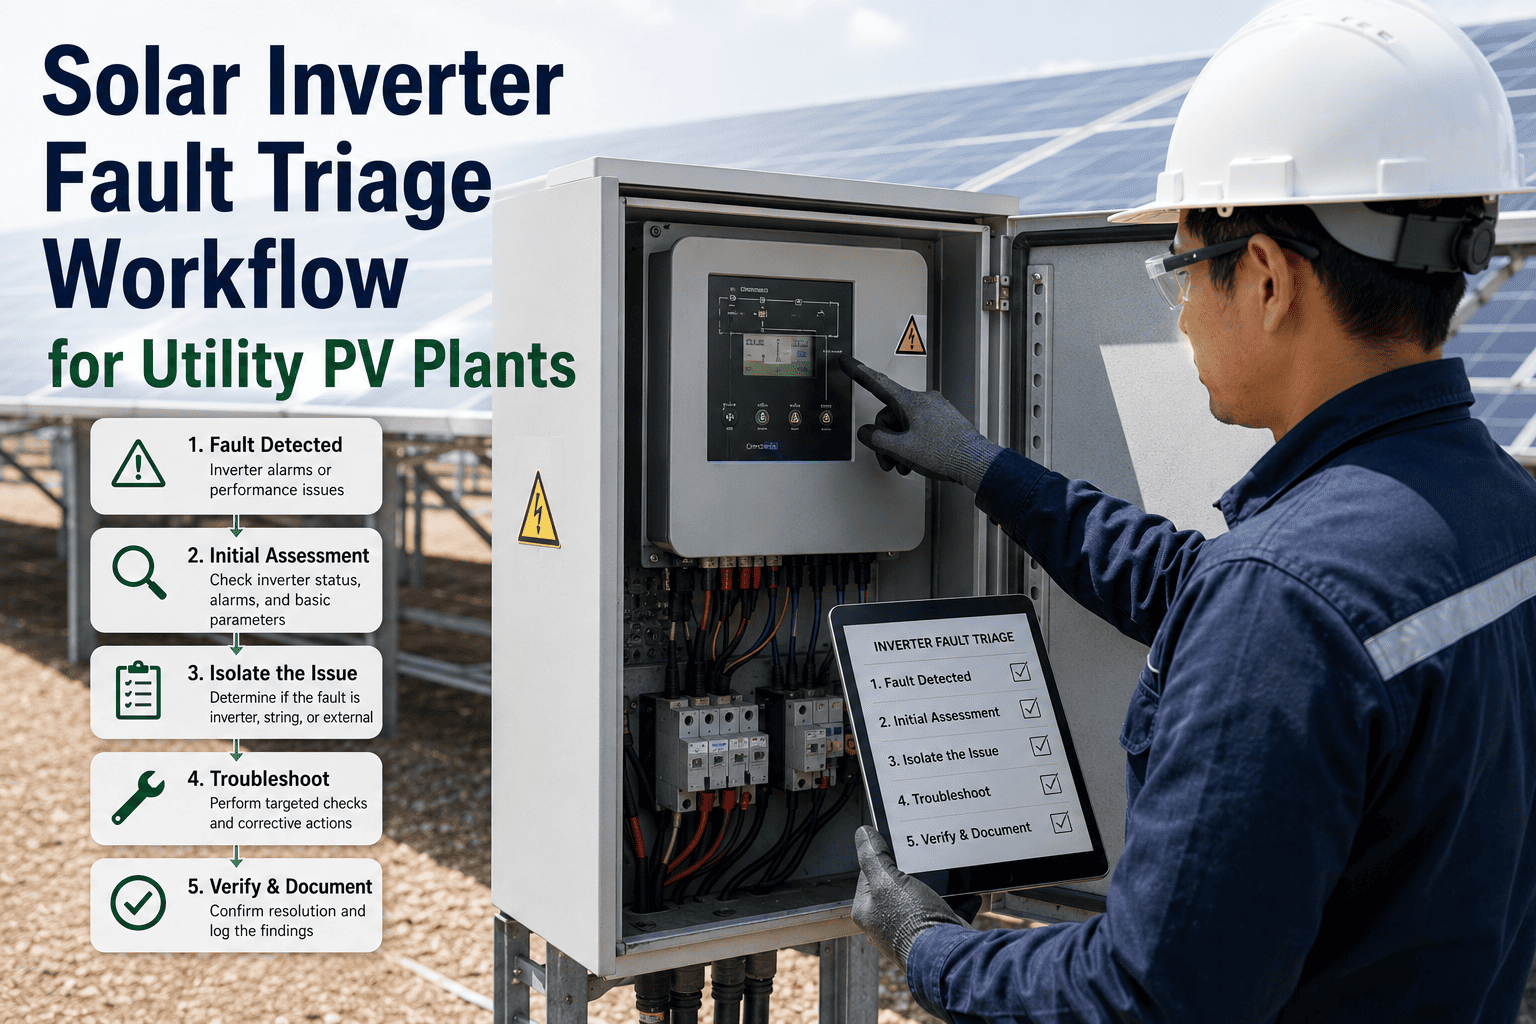
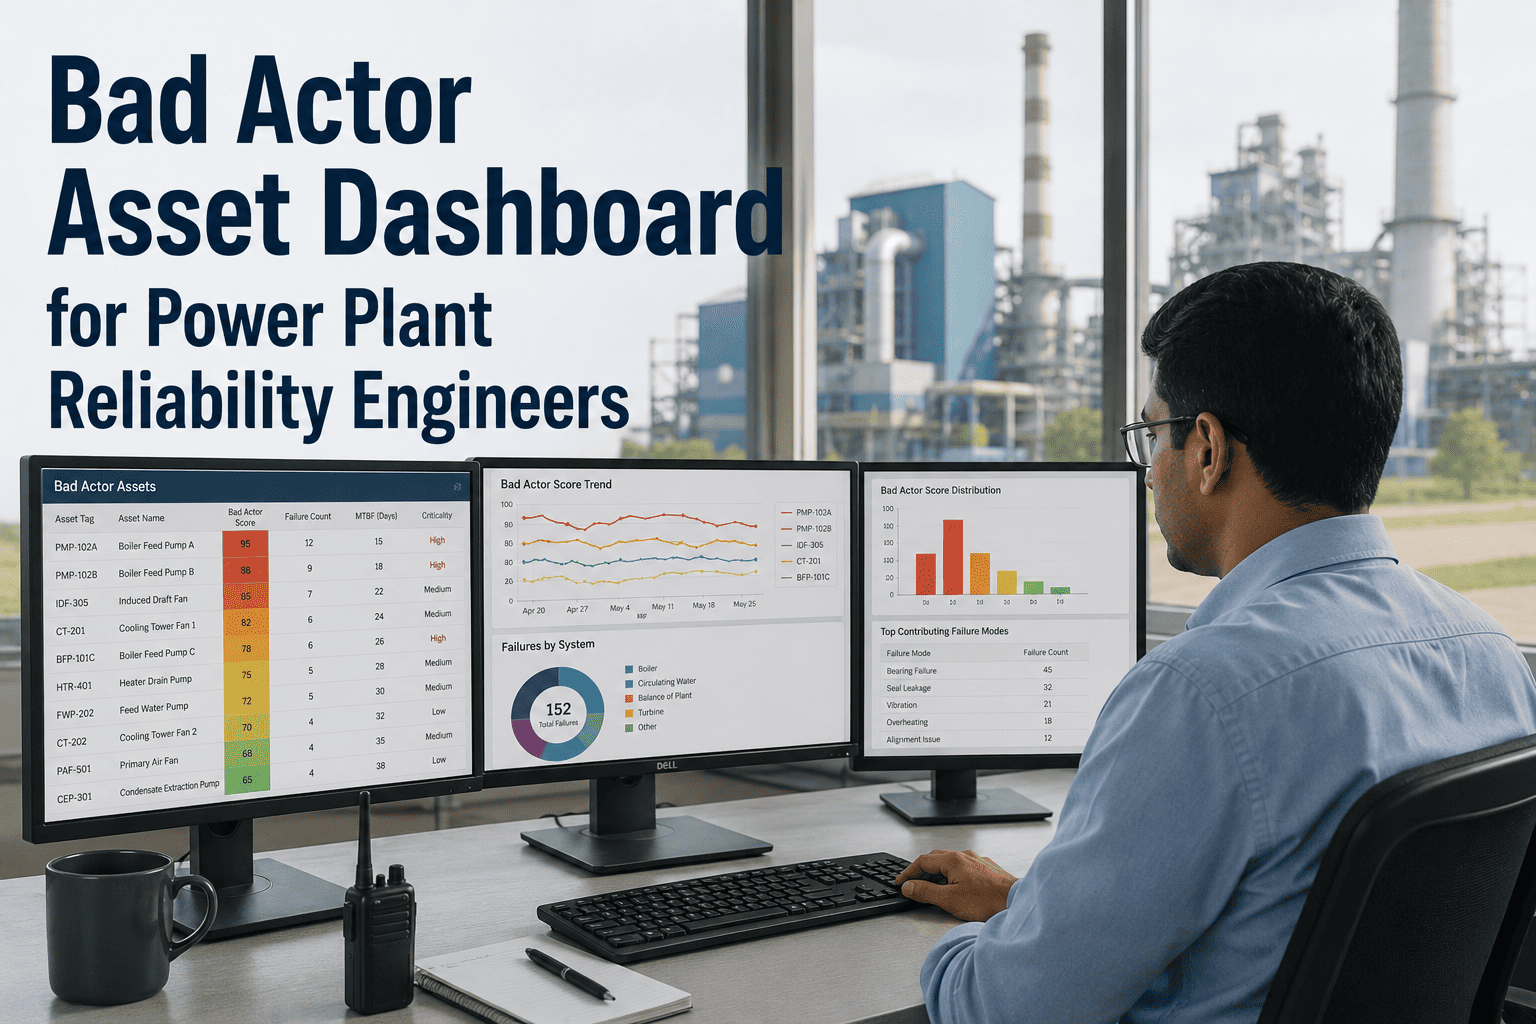
Inverters represent roughly 5% of a utility PV plant's capital cost — yet Sandia National Laboratories research shows they are responsible for up to 91% of faults in major utility projects. A single 4 MW central inverter failure can cost $1,250 per day in lost PPA revenue, and Clir's operational data shows the average downtime for a major inverter claim runs 80 days. That math demands a very different approach to monitoring: not waiting for a fault code, but tracking the thermal and electrical signals that precede failure by days or weeks. Sign up free on OxMaint to configure predictive alerts on your inverter assets, or book a demo to see how O&M teams manage inverter health at scale.
PREDICTIVE MAINTENANCE · RENEWABLE O&M
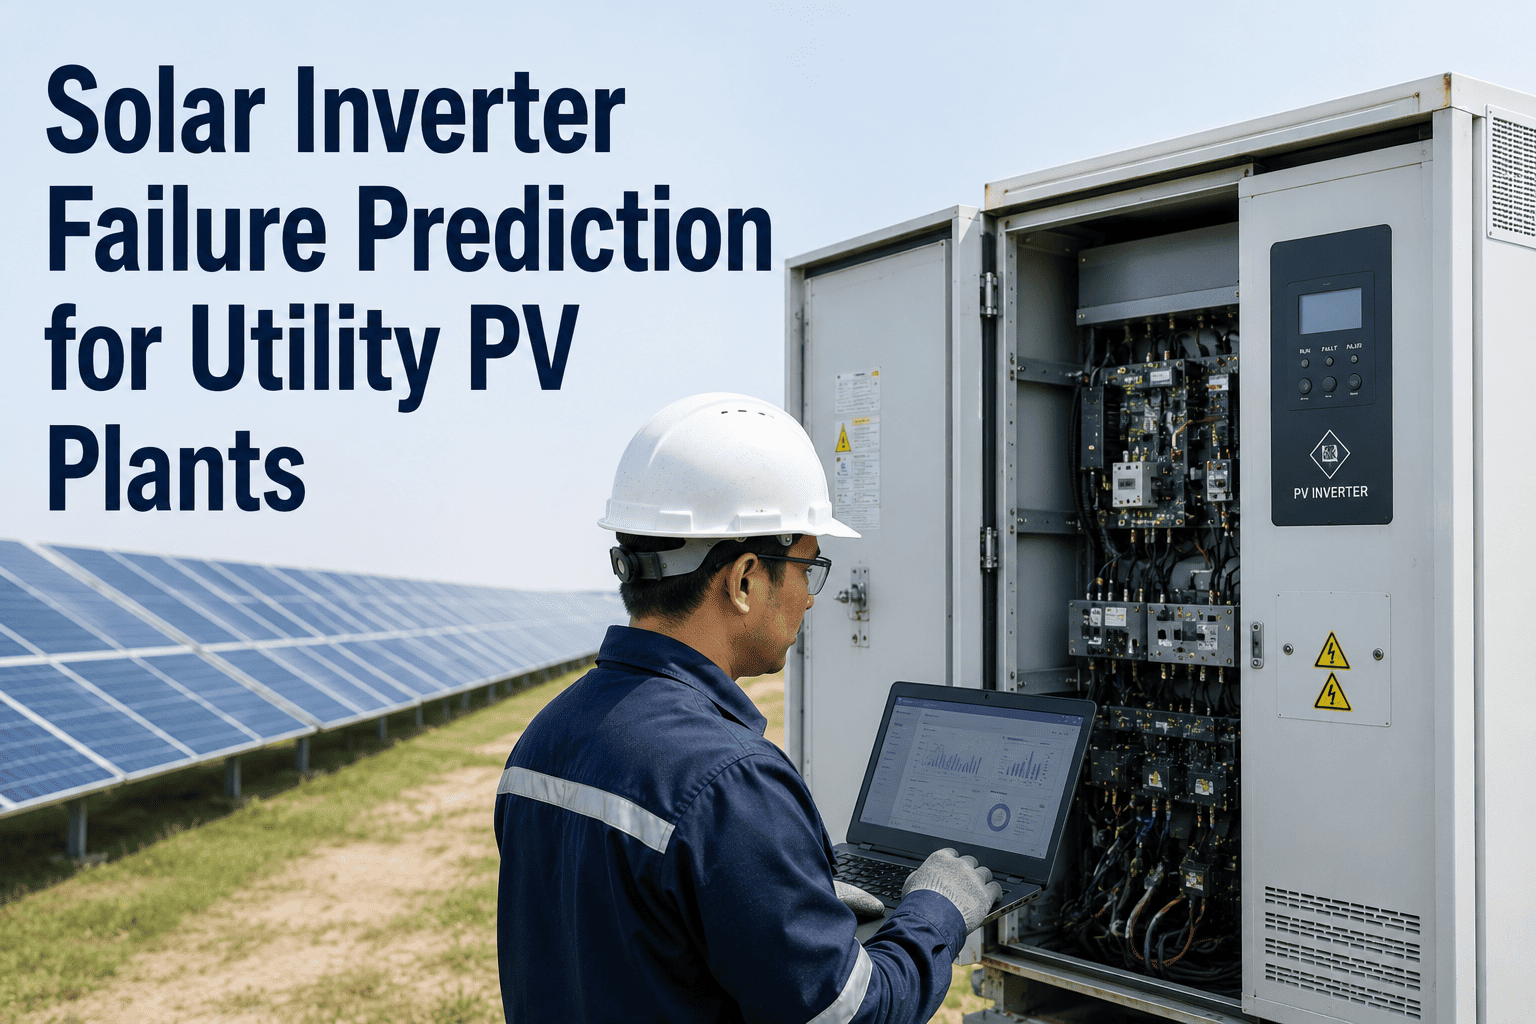
Solar Inverter Failure Prediction for Utility PV Plants
5% of your CapEx. 91% of your faults. Here is how predictive monitoring changes that equation.
91%
Share of utility PV faults caused by inverters (Sandia NL)
80 Days
Average downtime per major inverter claim (Clir data)
43%
Share of all solar system failures attributable to inverters
40–80%
Failure reduction achievable through proactive reliability practices
WHY INVERTERS FAIL
The Failure Modes That Predictive Monitoring Catches First
Most inverter failures are not sudden events. They are the end point of a detectable degradation path driven by heat, electrical stress, or component aging. Understanding the failure mode determines which signal to monitor.
Thermal
IGBT & Capacitor Overheating
Heat is the leading inverter killer. Power electronics operating above rated junction temperatures degrade exponentially faster. Monitoring ambient, heatsink, and transformer temperatures against production load identifies thermal stress before component failure.
Electrical
DC Input Imbalance
String-level current imbalance above 5–10% signals soiling, shading, module degradation, or a failing bypass diode feeding the inverter. Left unresolved, the imbalance increases inverter thermal load and shortens capacitor life.
Aging
Electrolytic Capacitor Wear
Electrolytic capacitors have a finite cycle life. As they age, DC ripple increases, output quality degrades, and thermal efficiency drops. Tracking conversion efficiency curves over time surfaces this degradation before it produces a fault trip.
Grid
Grid Synchronisation Loss
Voltage and frequency anomalies force inverter safety disconnections. Repeated nuisance trips that appear in fault logs but are dismissed as grid events may actually indicate an inverter's anti-islanding circuitry drifting from calibration — a precursor to full failure.
Turn Inverter Fault Logs Into Predictive Work Orders
OxMaint automatically converts inverter signal anomalies into condition-based work orders — so your O&M team acts on trends, not failure codes.
MONITORING FRAMEWORK
Key Signals and What They Reveal
| Signal Monitored |
Failure Mode Detected |
Lead Time Before Failure |
Priority |
| Heatsink / Ambient Temperature Delta |
IGBT thermal degradation, cooling fan failure |
Days to weeks |
Critical |
| DC Input Current Imbalance per String |
Module mismatch, diode failure, soiling |
Weeks to months |
High |
| Conversion Efficiency Trend (DC→AC) |
Capacitor aging, IGBT degradation |
Months |
Medium |
| Reactive Power / Power Factor Drift |
Grid synchronization calibration drift |
Weeks |
Medium |
| Nuisance Trip Frequency |
Anti-islanding circuit degradation, grid sensitivity |
Days to weeks |
High |
| Isolation Resistance (Riso) |
Insulation breakdown, moisture ingress |
Weeks to months |
Critical |
THE FINANCIAL CASE
What a Single Inverter Failure Actually Costs
Physical Damage
$42,483
Average inverter physical damage claim per incident on utility PV farms (Clir database)
Revenue Loss
$1,250/day
Lost PPA revenue per day from a single failed 4 MW central inverter at $50/MWh
Avg Downtime
80 Days
Average duration for a major inverter claim from failure to full restoration
Hidden Costs
Not Covered
Warranty rarely covers system downtime, freight, or reinstallation — those come out of O&M budget
EXPERT REVIEW
Rahul Mehta
Head of Solar O&M — Utility PV Portfolio, 12 Years
The assumption that warranty covers an inverter failure is the most expensive misconception in utility solar O&M. The unit may be replaced at no cost, but the 80-day average downtime clock is running the whole time — and lost generation at PPA rates does not appear on anyone's warranty claim. The teams that have meaningfully reduced their inverter-related revenue loss are the ones monitoring thermal and efficiency signals continuously, not the ones with better warranty terms. An inverter does not fail silently. It gives you plenty of warning if you are looking at the right data.
FREQUENTLY ASKED
Solar Inverter Predictive Maintenance — Common Questions
How does OxMaint connect inverter monitoring data to a maintenance work order?
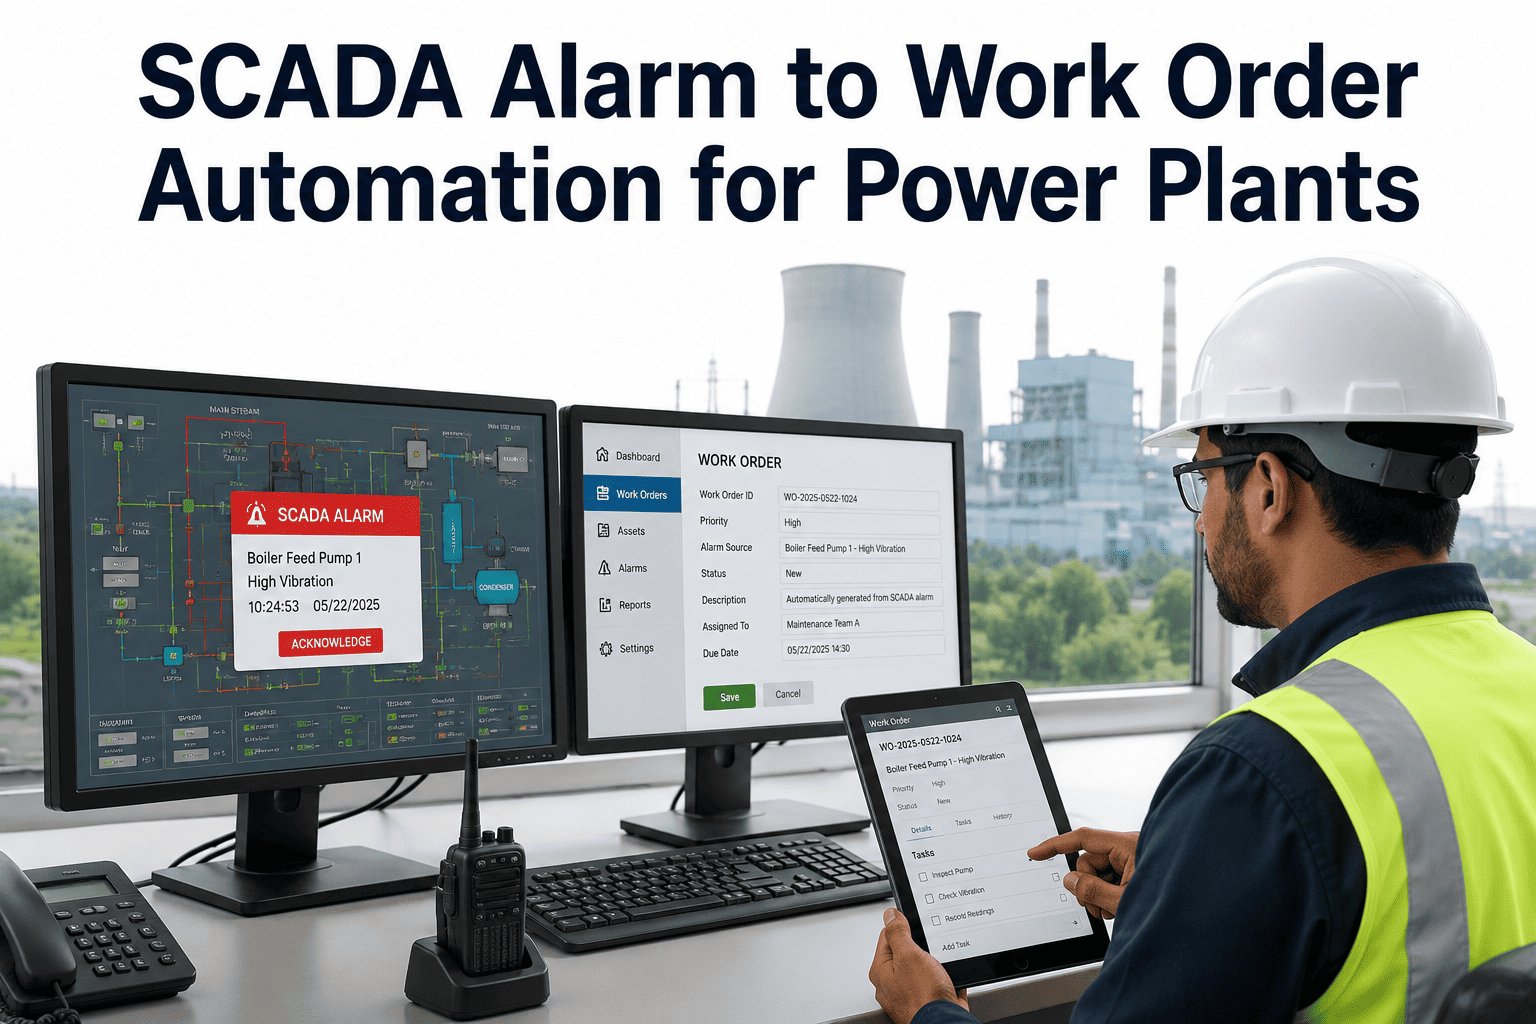
When a tracked parameter — heatsink temperature delta, string imbalance, conversion efficiency — crosses a configured threshold, OxMaint generates a work order automatically with the signal trend attached. The O&M technician receives a prioritized task with the asset record, breach detail, and recommended inspection scope, without needing to review raw monitoring dashboards first.
Start free to configure your first inverter threshold.
Can predictive monitoring reduce inverter replacement frequency over a plant's life?
Industry data shows that proactive reliability practices can reduce inverter-related failures by 40–80%, and consistent thermal management can double effective inverter lifespan. OxMaint supports this by creating a continuous condition history per inverter, surfacing degradation trends that allow intervention — cleaning, recalibration, capacitor replacement — before the unit fails entirely.
Book a demo to see how this is structured for large fleets.
Does OxMaint support multi-site utility PV portfolios with hundreds of inverters?
Yes. OxMaint's multi-site architecture rolls asset health data across all sites into a single portfolio view. Maintenance managers can see which inverters across the fleet are trending toward a threshold breach, prioritize intervention by revenue risk, and pool spare parts orders for common inverter models — reducing both logistics cost and response time across a large installed base.
What is the difference between monitoring a central inverter and a string inverter in OxMaint?
Central inverters carry far higher generation risk per unit — a single failure can disconnect an entire block. OxMaint supports higher-priority alert thresholds and more frequent health checks for central units. String inverters are monitored at the individual unit level, with imbalance alerts flagging underperforming strings before they impose excess load on adjacent units.
Start free to set up monitoring templates by inverter type.
How quickly can an O&M team be onboarded to track inverter health in OxMaint?
Most utility PV O&M teams complete initial inverter asset setup within the first week, working from existing SCADA exports and OEM performance specs. Thresholds are configured per inverter model and adjusted as baseline data accumulates.
Book a demo to scope your plant size and configuration requirements.
OXMAINT · RENEWABLE O&M
Your Inverters Are Telling You Something. Are You Listening?
OxMaint converts inverter thermal, electrical, and efficiency signals into predictive work orders — so your team responds to trends, not failures.