Predictive Maintenance for Power Plant Cooling Towers | Sensors, AI & CMMS Insights

By Johnson on April 7, 2026

predictive-maintenance-cooling-tower-power-plant

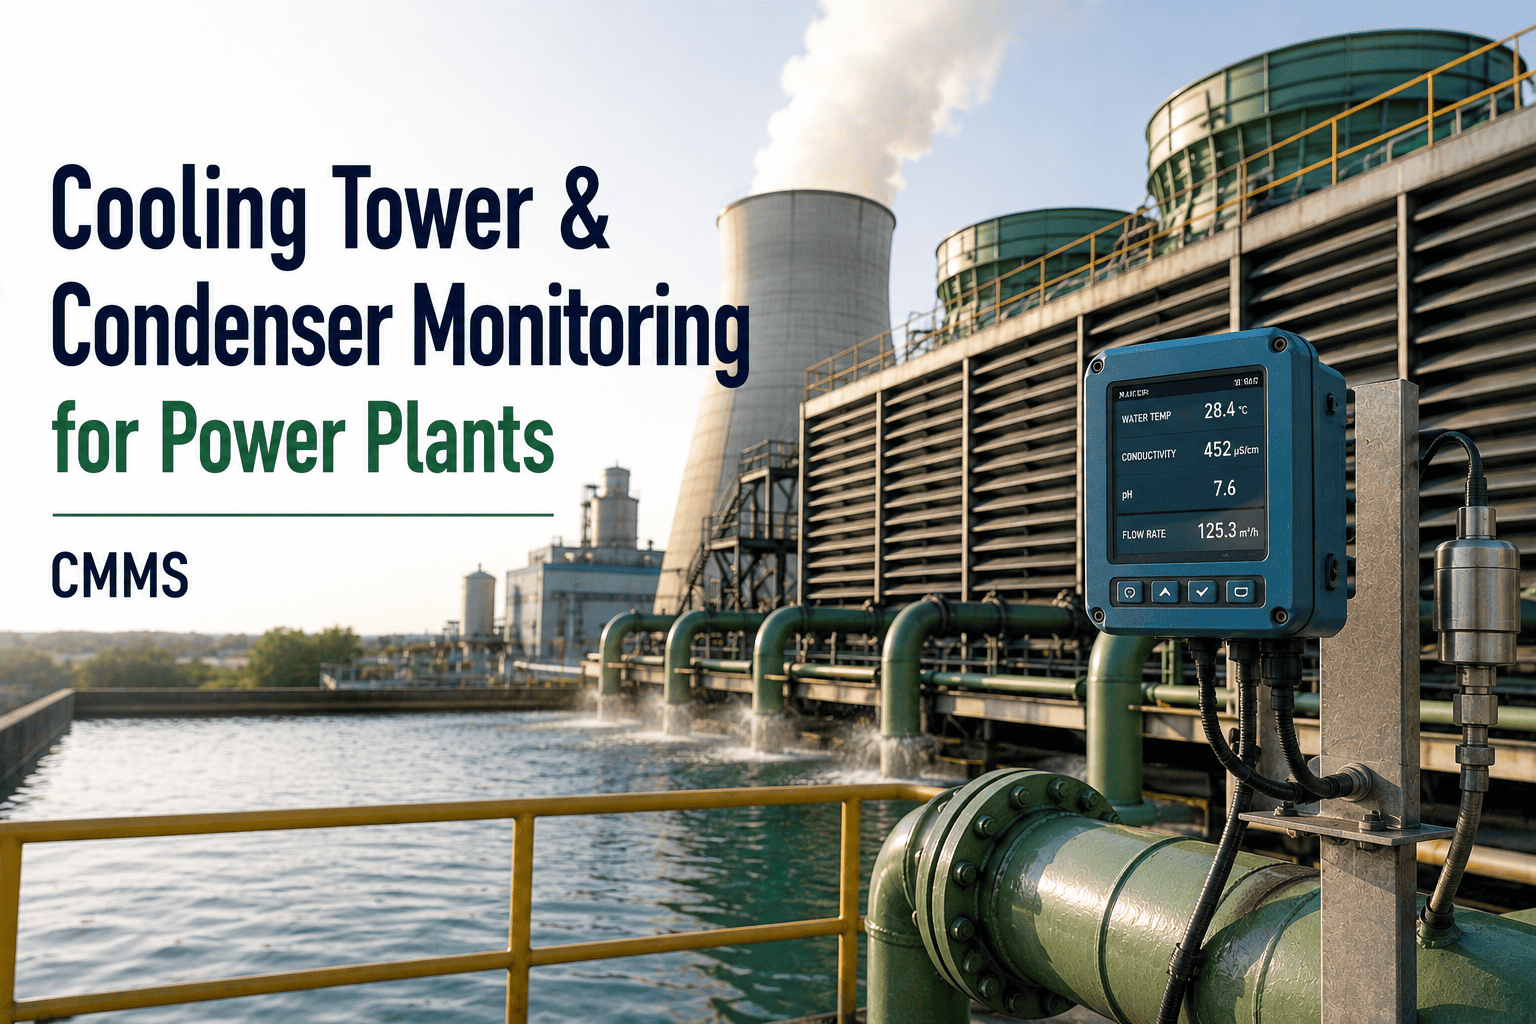
A cooling tower that worked perfectly at commissioning will quietly lose 10-15% of its heat transfer efficiency from just 0.5 mm of scale buildup on condenser tubes — and by the time your operators notice the rising backpressure, the turbine is already burning more fuel for fewer megawatts. Scaling, biofouling, pump cavitation, and fan bearing wear do not announce themselves with alarms — they announce themselves with shrinking margins. Predictive maintenance catches these degradation patterns weeks before they reach your P&L. Start monitoring your cooling system's health with Oxmaint — free trial, no credit card, live in under 60 minutes.

Cooling System Analytics  ·  Sensor Monitoring  ·  AI Diagnostics

Predictive Maintenance for Power Plant Cooling Towers

Your turbine's efficiency ceiling is set by your cooling tower's floor. When scaling, fouling, and pump degradation erode thermal performance, the cost shows up as higher fuel consumption, reduced output, and — eventually — forced outages during peak demand. Oxmaint turns sensor data into condition-triggered work orders before the damage reaches your heat rate.

10-15%
Heat transfer loss from just 0.5 mm of scale on condenser tubes
15%
Of forced outages originate from auxiliary systems like pumps and cooling
25-40%
Maintenance cost reduction with predictive over reactive strategies
$50K-$200K
Daily cost of a forced outage during summer peak demand
The Thermal Cascade

How Cooling Tower Degradation Silently Drains Your Plant's Output

Cooling tower problems do not cause sudden explosions — they cause a slow, invisible bleed of efficiency that compounds daily. Here is the cascade that turns a minor fouling issue into a measurable revenue loss.

Stage 1
Fouling or Scaling Begins
Scale deposits, biofilm, or debris accumulate on fill media and condenser tubes. Heat transfer surface area decreases. Approach temperature starts climbing.

Stage 2
Cold Water Temperature Rises
The cooling tower can no longer reject heat at design rates. Basin water temperature climbs. Condenser inlet temperature follows.

Stage 3
Condenser Backpressure Increases
Higher condenser water temperature means the steam condenses less efficiently. Turbine exhaust pressure rises. The turbine works harder to push steam through.

Stage 4
Output Drops, Fuel Cost Rises
More fuel burned per megawatt-hour. Net plant output declines. Heat rate degrades. During summer peaks, backpressure can force a turbine trip — costing $50K-$200K per day.
The hidden cost:
Most plants tolerate this cascade for weeks or months because the degradation is gradual. Predictive monitoring detects the drift at Stage 1 — before it reaches your heat rate or your bottom line.
Catch Cooling Tower Degradation at Stage 1 — Not Stage 4
Oxmaint connects your temperature, flow, vibration, and water chemistry data to condition-triggered work orders. When approach temperature drifts, when pump vibration trends upward, when basin conductivity spikes — Oxmaint creates the work order before the backpressure hits.
Failure Mode Map

The Five Cooling System Failure Modes Predictive Maintenance Detects Early

Scaling and Mineral Deposits
High Impact
What happens:
Dissolved minerals concentrate as water evaporates and precipitate onto condenser tubes, fill media, and heat exchanger surfaces
Sensor signals:
Rising approach temperature, increasing conductivity, declining cleanliness factor
Detection lead time:
3-6 weeks before measurable efficiency loss
Biological Fouling
High Impact
What happens:
Biofilm forms on fill and tube surfaces, anchoring scale and creating crevices for corrosion — a compounding cycle
Sensor signals:
Fill weight increase, differential pressure across tower, basin temperature creep
Detection lead time:
2-4 weeks before treatment intervention needed
Pump Cavitation and Wear
Medium Impact
What happens:
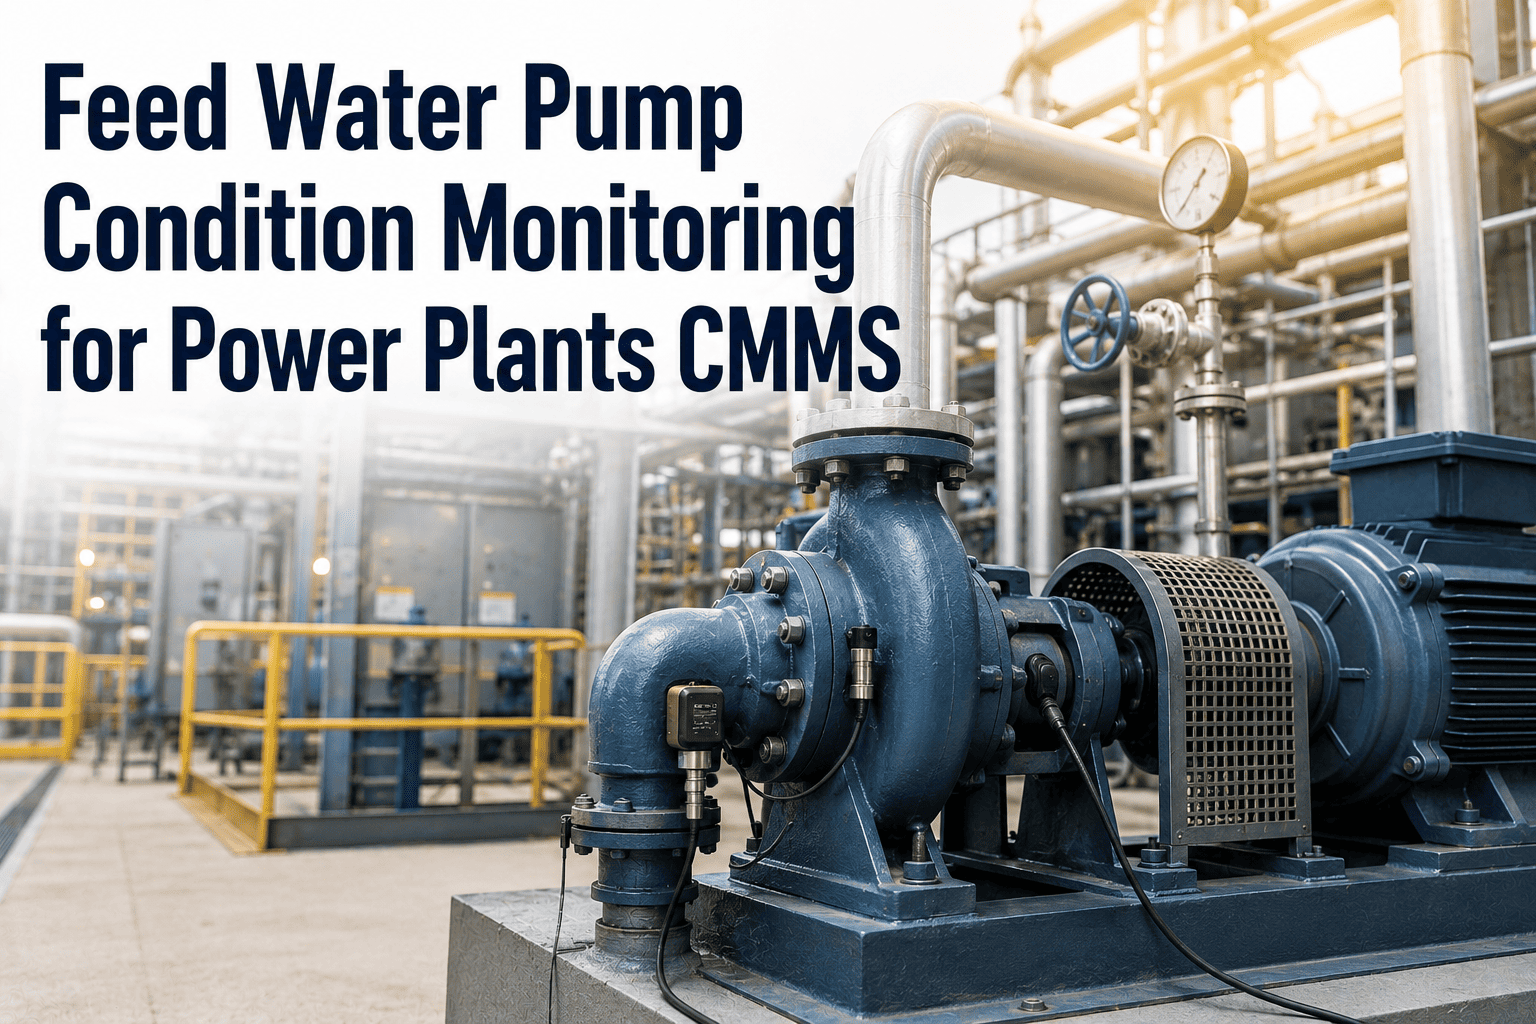
Low suction pressure causes vapor bubbles that implode on the impeller — destroying seals, bearings, and shafts over time
Sensor signals:
Vibration amplitude spikes, suction pressure drop, flow rate inconsistency, motor current draw anomalies
Detection lead time:
4-8 weeks before bearing or seal failure
Fan and Gearbox Degradation
Medium Impact
What happens:
Fan blade imbalance, gearbox oil degradation, and bearing wear reduce airflow and increase energy consumption
Sensor signals:
Vibration pattern shift, oil analysis particulate count, gearbox temperature rise, motor current trending
Detection lead time:
6-12 weeks before catastrophic gearbox failure
Corrosion and Structural Degradation
Gradual Impact
What happens:
Internal corrosion thins pipe walls, weakens structural supports, and creates condenser shell cracks that admit air into the vacuum
Sensor signals:
Water chemistry ORP shifts, corrosion coupon data, condenser air in-leakage rates, ultrasonic thickness readings
Detection lead time:
Months ahead with periodic ultrasonic trending
Sensor-to-Work-Order Map

Which Sensors Monitor What — and What Oxmaint Does With the Data

Monitoring Point Sensor Type What It Detects Oxmaint Action
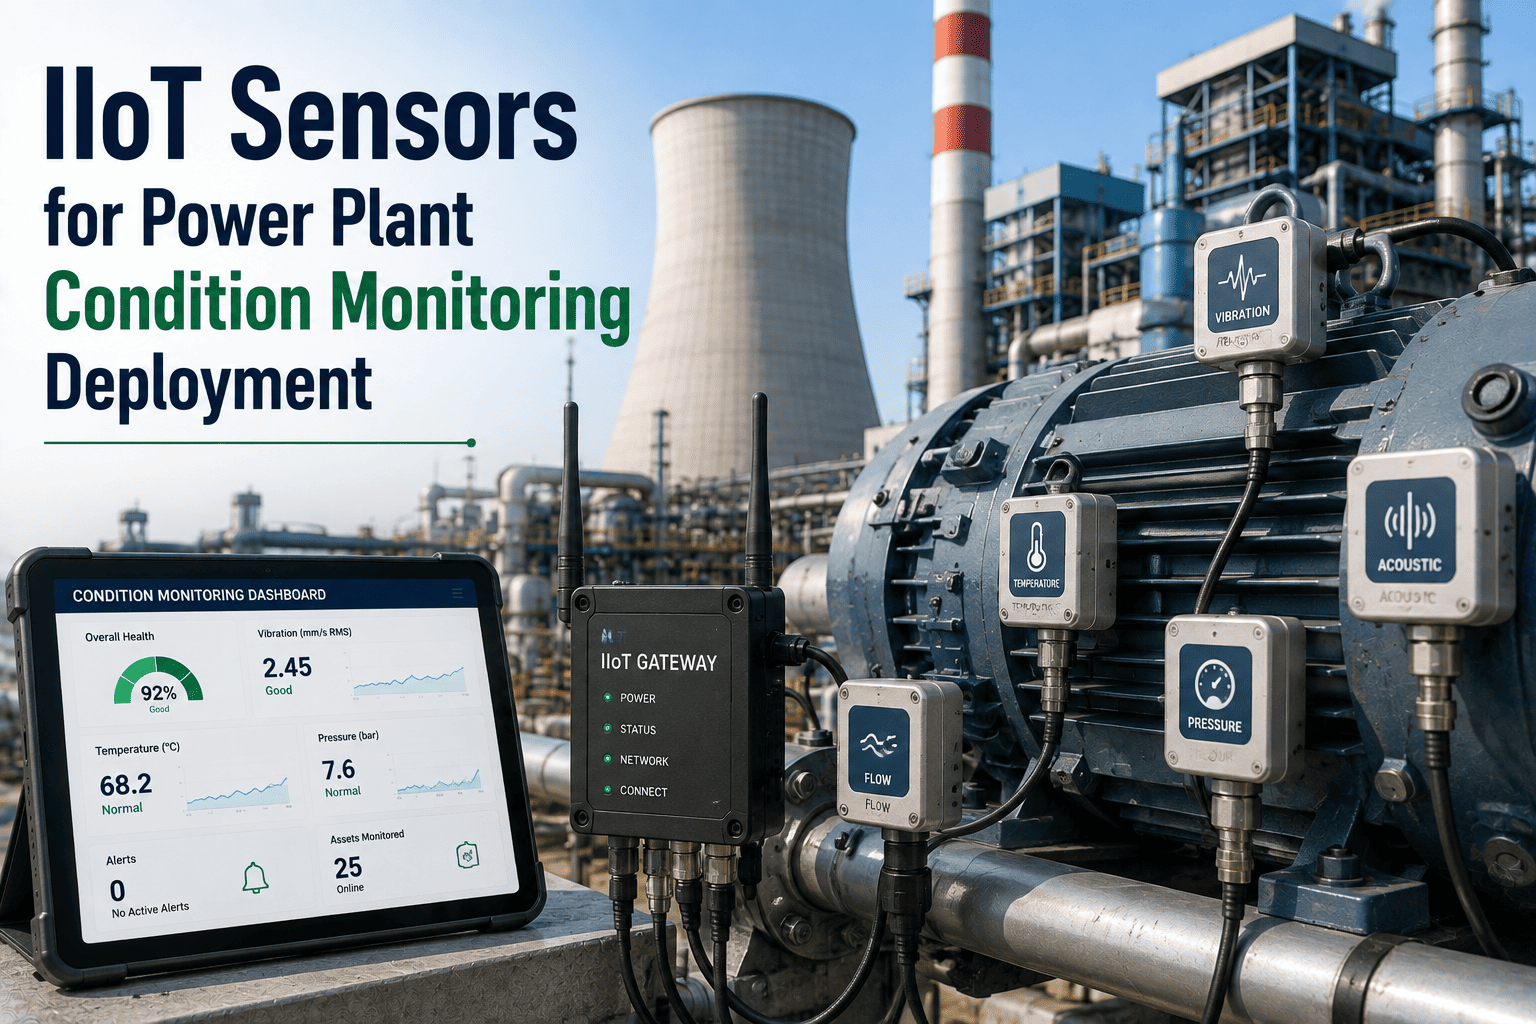
Basin water temperature RTD / thermocouple Approach temperature drift indicating fouling or airflow loss Auto-triggers inspection WO when deviation exceeds threshold
CW pump vibration Accelerometer Bearing wear, impeller imbalance, cavitation onset Condition-based PM replaces calendar-based overhaul
Condenser backpressure Pressure transducer Tube fouling, air in-leakage, vacuum system degradation Trending alerts maintenance before turbine derating
Water conductivity Conductivity probe Mineral concentration approaching saturation / scale risk Triggers blowdown adjustment or chemical treatment WO
Fan motor current CT / power meter Blade pitch issues, gearbox load increase, belt slippage Creates predictive WO for gearbox or fan inspection
Gearbox oil temperature Thermocouple Lubrication degradation, internal friction increase Oil analysis WO auto-scheduled when temp trend crosses baseline
Differential pressure (fill) DP transmitter Fill fouling severity, airflow restriction Cleaning WO prioritized by efficiency impact score
Oxmaint Capabilities

How Oxmaint Turns Cooling Tower Data Into Maintenance Action

Condition Triggers
Multi-Parameter Threshold Monitoring
Set custom thresholds per asset — approach temperature, vibration amplitude, conductivity, differential pressure. When any parameter trends past its baseline, Oxmaint generates a prioritized work order before the operator notices the drift.
Trend Analysis
Degradation Curve Tracking
Oxmaint plots condition data over time against each asset's healthy baseline. Gradual efficiency loss becomes visible as a trend line — not a surprise alarm. Maintenance teams plan interventions during scheduled outage windows.
Auto Work Orders
Sensor-to-Work-Order Automation
When a condition threshold is crossed, Oxmaint auto-creates the work order, checks spare parts inventory, assigns the right technician by skill tag, and slots the repair into the next available maintenance window.
Cost Avoidance
Documented Savings Per Intervention
Every condition-triggered intervention carries an estimated cost avoidance figure — what the failure would have cost versus what the planned repair cost. Your ROI report builds itself with each prevented degradation event.
Common Questions

What Power Plant Teams Ask About Cooling Tower Predictive Maintenance

Do we need new sensors to start predictive maintenance on our cooling system?
Most power plants already have temperature, pressure, and flow data flowing through SCADA or DCS. Oxmaint connects to these existing data sources via standard APIs — no new hardware on day one. Additional wireless vibration sensors can be added incrementally. Start free and connect your existing cooling system data.
How quickly can Oxmaint detect scaling or fouling in our cooling tower?
With baseline data established in the first 2-4 weeks, Oxmaint detects approach temperature drift and conductivity trends that indicate early-stage scaling 3-6 weeks before measurable efficiency loss. The earlier you start capturing data, the faster detection becomes actionable. Book a demo to see thermal trending in action.
Can Oxmaint monitor both the cooling tower and the associated CW pumps and fans?
Yes — Oxmaint treats the entire cooling system as an interconnected asset group. Tower fill, basin, CW pumps, fan motors, gearboxes, and condenser tubes all carry individual condition scores within the same platform. Cross-asset correlation catches issues that single-asset monitoring misses. Start free and build your cooling system asset registry.
What ROI should we expect from cooling tower predictive maintenance?
Plants typically see 25-40% reduction in cooling system maintenance costs and measurable heat rate improvement from catching fouling early. One prevented summer-peak turbine trip from backpressure alone can save $50K-$200K — often recovering the full platform investment in a single event. Book a demo to model your cooling system ROI.
How does this integrate with our existing water treatment program?
Oxmaint's conductivity and chemistry trending feeds directly into treatment decision-making. When mineral concentration approaches saturation, the platform triggers blowdown adjustments or chemical dosing work orders — coordinating water treatment with maintenance scheduling rather than running them in parallel silos. Start free now.
Cooling Tower Analytics  ·  Predictive Maintenance  ·  Free to Start
Your Cooling Tower Is the Silent Governor of Your Plant's Efficiency. Start Listening to It.
Oxmaint connects your cooling system's sensor data to condition-triggered work orders, degradation trend tracking, and automated cost avoidance reporting — so scaling, fouling, and pump wear get caught weeks before they reach your heat rate. Deployable this week.

Share This Story, Choose Your Platform!