Heat exchanger fouling is the single largest source of continuous, undetected efficiency loss in power plants — responsible for an estimated 2.5% of global energy production losses and $4.4 billion in annual maintenance and fuel cost penalties across the thermal generation sector. Unlike bearing failures or turbine trips, fouling does not announce itself with an alarm. It accumulates as a fraction of a percent per week across boiler feedwater heaters, lube oil coolers, intercoolers, and closed cooling water heat exchangers until the cumulative penalty becomes too large to ignore — typically at an outage. At that point, the efficiency loss has already been paid for, repeatedly, in fuel. Fouling analytics — tracking heat transfer coefficient degradation, pressure drop trends, and effectiveness ratio in real time against equipment-specific baselines — convert this invisible, continuous loss into a scheduled cleaning event before the penalty compounds. Start tracking heat exchanger fouling in Oxmaint free and build the analytics baseline that makes cleaning decisions proactive rather than reactive.
Performance Optimization
Predictive Maintenance
Heat Exchanger Analytics
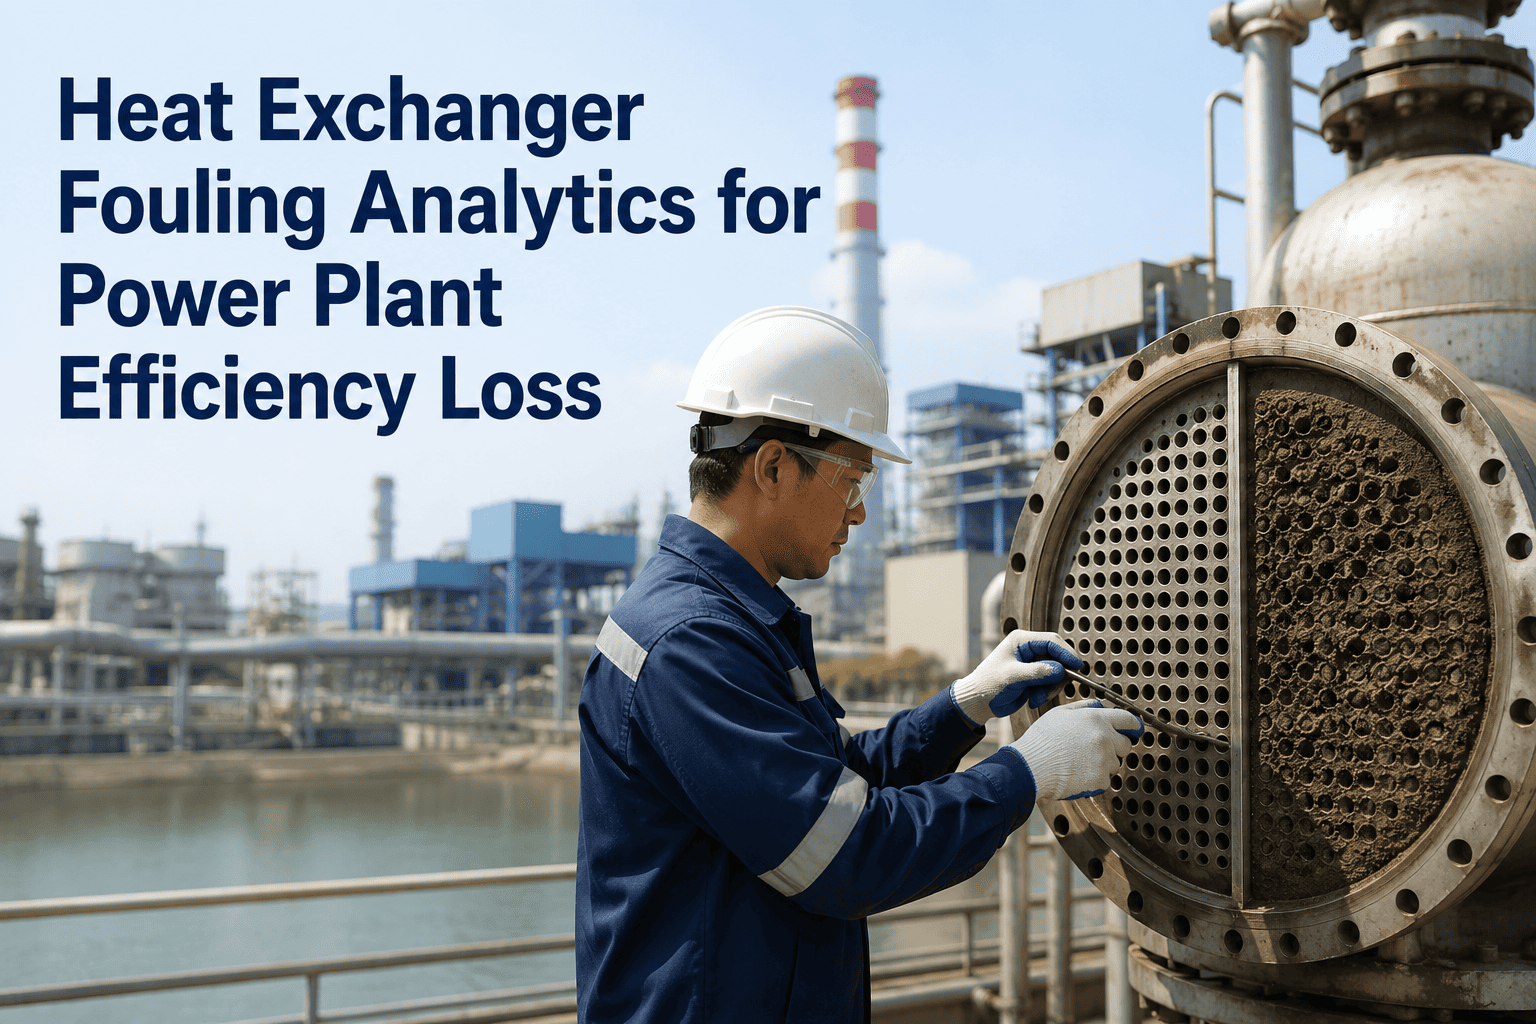
Heat Exchanger Fouling Analytics for Power Plant Efficiency Loss
Track fouling resistance, heat transfer coefficient decay, and effectiveness ratio across every heat exchanger in real time — and schedule cleaning before the efficiency penalty compounds into an outage-scale problem.
The Invisible Efficiency Loss Curve
Fouling resistance accumulation in a typical FW heater without analytics-driven cleaning schedule — 500 MW unit, $2.8M annual fuel penalty at month 6
Four Analytics Metrics
The Fouling Analytics That Actually Quantify Efficiency Loss
Generic temperature monitoring tells you a heat exchanger is hot. Fouling analytics tells you exactly how much thermal performance has been lost, what it is costing per day, and when cleaning will pay for itself. These are the four metrics Oxmaint tracks per heat exchanger.
U = Q ÷ (A × LMTD)
U degrades as fouling deposits add thermal resistance between fluid streams. Oxmaint calculates U continuously from inlet/outlet temperatures and flow rates, trending the decay curve against the clean U value baseline. A U below 70% of clean value at the same flow rate is the primary cleaning trigger — independent of calendar date.
Alert threshold
U < 80% of clean baseline → yellow alert | < 70% → cleaning work order
Rf = (1/U_fouled) − (1/U_clean)
Fouling resistance is the engineering measure of the insulating deposit layer between tube wall and fluid. Oxmaint tracks Rf against TEMA-recommended design limits for each service type — feedwater heaters, lube oil coolers, and seawater coolers each have different acceptable Rf thresholds based on process requirements and cleaning cost.
TEMA design limit
0.0002 m²K/W for clean water | 0.0005 for treated process fluids
ε = Actual heat transfer ÷ Maximum possible heat transfer
Effectiveness ratio compares what the heat exchanger is doing against what it could do at current flow rates and inlet temperatures — eliminating seasonal variation from the degradation signal. An effectiveness below design on a corrected basis confirms fouling-driven degradation rather than process condition changes. Oxmaint normalizes for ambient conditions automatically.
Typical range
Clean: 0.75–0.92 | Cleaning warranted: < 0.65 on corrected basis
dP_fouled ÷ dP_clean at same flow = fouling index
dP rising above the clean baseline at constant flow rate confirms deposit accumulation in tube side channels or shell-side baffles. dP trends are particularly diagnostic for particulate fouling and biological growth — both of which may not significantly affect U in early stages but create blockage and corrosion risk that worsens rapidly if not addressed.
Alert threshold
dP > 125% of clean baseline at design flow → inspection work order
Equipment Coverage
Priority Heat Exchangers for Fouling Analytics in Power Plants
Not all heat exchangers have equal fouling impact on plant efficiency. These five categories represent the highest-ROI targets for fouling analytics deployment — ranked by their contribution to heat rate and generation capacity.
1
High-Pressure Feedwater Heaters
Why priority
HP FW heater degradation directly increases boiler heat input requirement — 1% U degradation translates to 0.3–0.4% heat rate increase. At a 500 MW coal unit, 3% U degradation adds $1.8M–$2.4M in annual fuel cost.
Primary fouling type
Oxide scale (iron and copper corrosion products), condensate chemistry excursions, drains cascade contamination
Analytics trigger
TTD rising > 3°C above design; terminal temperature difference tracking in Oxmaint against post-outage baseline
2
Main Condenser (Hotwell Side)
Why priority
Every 1°C rise in condenser TTD from tube fouling causes 0.5–0.8% back pressure increase, directly reducing turbine output. The condenser is typically the largest single heat rejection surface in the plant — fouling impact is magnified.
Primary fouling type
Biofouling (zebra mussels, algae), calcium carbonate scaling, silt/sediment in once-through cooling water systems
Analytics trigger
TTD rising and CW dP increase — both required to confirm fouling vs. flow restriction
3
Gas Turbine Lube Oil Coolers
Why priority
Lube oil cooler fouling raises bearing oil supply temperature above 50°C, accelerating bearing degradation and forcing derating to protect bearing life. Unlike efficiency penalties, lube oil cooler failure has a direct equipment reliability consequence.
Analytics trigger
Oil supply temperature rising > 2°C at constant load and cooling water temperature — corrected effectiveness below 80% of clean baseline
4
Air Cooled Intercoolers (Gas Turbine Inlet)
Why priority
Intercooler fouling from dust, pollen, and inlet air contaminants reduces inlet air density, cutting compressor mass flow and reducing turbine power output by 2–4% in fouled condition — directly recoverable by offline cleaning.
Analytics trigger
Compressor inlet temperature rising above corrected ambient; intercooler air-side dP trending above clean baseline at design flow
5
Closed Cooling Water Heat Exchangers
Why priority
CCW coolers service generator hydrogen coolers, exciter coolers, and transformer oil coolers — cooling failures here cause equipment trips, not gradual efficiency loss. Early fouling detection prevents reliability consequences that are far more costly than the cleaning itself.
Analytics trigger
CCW supply temperature rising; differential temperature across individual service coolers deviating from design
Fouling is paying your fuel bill right now. Analytics shows exactly how much.
Oxmaint's predictive maintenance analytics calculates the dollar-per-day efficiency penalty from heat exchanger fouling across every unit on your site — and generates the cleaning work order before the cost compounds further.
Cleaning Decision Framework
When to Clean — The Analytics-Driven Decision Model
Calendar-based cleaning is the wrong trigger for heat exchanger maintenance. Cleaning too early wastes outage windows. Cleaning too late has already paid an avoidable fuel penalty. Oxmaint's fouling analytics calculates the economically optimal cleaning trigger for each heat exchanger based on its actual degradation rate and cleaning cost.
1
Calculate Daily Efficiency Penalty
Oxmaint multiplies the current U degradation percentage by unit heat rate impact factor and current fuel price — producing a real-time daily cost of fouling for each heat exchanger. This number is updated continuously as new performance data arrives.
2
Compare Against Cleaning Cost
Cleaning cost (labour, chemicals, outage window cost) is stored in the Oxmaint asset record. When the cumulative fouling penalty exceeds the cleaning cost, Oxmaint flags the exchanger for scheduling — the cleaning break-even point has been reached.
3
Project Forward to Next Outage Window
Oxmaint projects the fouling trajectory to the next planned maintenance window. If the trajectory indicates a reliability risk (dP exceeding pump head, oil temperature exceeding bearing limit) before the next planned window, it escalates cleaning priority to unscheduled — preventing a reliability event from competing with a low-cost cleaning event.
4
Generate Cleaning Work Order Automatically
When the cleaning trigger is confirmed, Oxmaint generates a pre-populated work order: exchanger ID, fouling type confirmed, recommended cleaning method (hydroblast, chemical, mechanical), required chemicals from BOM, and scheduling recommendation within the next available maintenance window.
Sample ROI Calculation — HP Feedwater Heater
Unit size
500 MW coal-fired
U degradation at cleaning trigger
22% below clean baseline
Heat rate penalty
0.7% increase = $3,200/day
Days fouled above trigger
45 days
Avoidable fuel cost
$144,000
Cleaning cost (hydroblast)
$22,000
Net saving from analytics-triggered cleaning
$122,000 per cleaning cycle
FAQ
Frequently Asked Questions on Heat Exchanger Fouling Analytics
What instrumentation is needed to run heat exchanger fouling analytics in Oxmaint?
The minimum requirement is inlet and outlet temperature on both sides of the exchanger, plus flow rate on at least one side. Most power plants already have this instrumentation installed. For dP trending, differential pressure transmitters across tube bundles are needed — these are standard on most FW heaters and condensers but may need to be added on lube oil and CCW coolers.
Oxmaint connects to existing DCS instrumentation via OPC-UA without additional sensors for most applications.
How accurate is real-time U calculation compared to lab analysis?
Real-time U calculation from DCS data is accurate to within 3–5% when properly corrected for flow variation and temperature measurement uncertainty. This is sufficient for cleaning trigger decisions, which are typically set at 20–30% U degradation thresholds where the measurement uncertainty is small relative to the signal. For precise performance guarantees and TEMA compliance, dedicated test conditions with calibrated instrumentation are required — but for maintenance decisions, real-time analytics is fully adequate and far more valuable than periodic testing.
Book a demo to see the measurement methodology Oxmaint uses for your specific exchanger type.
How does Oxmaint distinguish fouling-driven U degradation from process condition changes?
Oxmaint normalizes all performance metrics to design flow and temperature conditions before calculating U and effectiveness. Process condition changes (load swings, ambient temperature variation) affect raw temperature readings but not the corrected performance metrics. Only genuine deposit accumulation produces a monotonically decreasing U curve on a corrected basis — seasonal variation or load changes produce scatter around a stable baseline, not a declining trend.
Can fouling analytics help plan outage windows, or only trigger reactive cleaning?
Fouling analytics is most valuable as an outage planning tool. Oxmaint projects each exchanger's U trajectory forward to the next 90 days — showing which exchangers will reach cleaning threshold before the next planned outage window and which can wait. This allows maintenance planners to consolidate exchanger cleaning into planned windows rather than responding reactively to performance alarms during operation.
Start tracking your heat exchanger baselines in Oxmaint today.
What cleaning methods does Oxmaint support tracking for heat exchanger maintenance history?
Oxmaint tracks all cleaning methods in the heat exchanger's asset history: hydroblasting, chemical cleaning (acid, alkaline, enzymatic), online ball circulation cleaning, and mechanical tube brushing. Post-cleaning U recovery percentage is recorded for each method and each exchanger — building a plant-specific database of which cleaning method achieves the best recovery for each fouling type, optimizing cleaning method selection for future events.
Stop paying the fouling penalty every day. Start tracking it and scheduling cleaning before it compounds.
Oxmaint's predictive maintenance analytics calculates heat transfer coefficient decay, fouling resistance, and daily efficiency cost across every heat exchanger in your plant — generating cleaning work orders at the economically optimal trigger point, not an arbitrary calendar date.