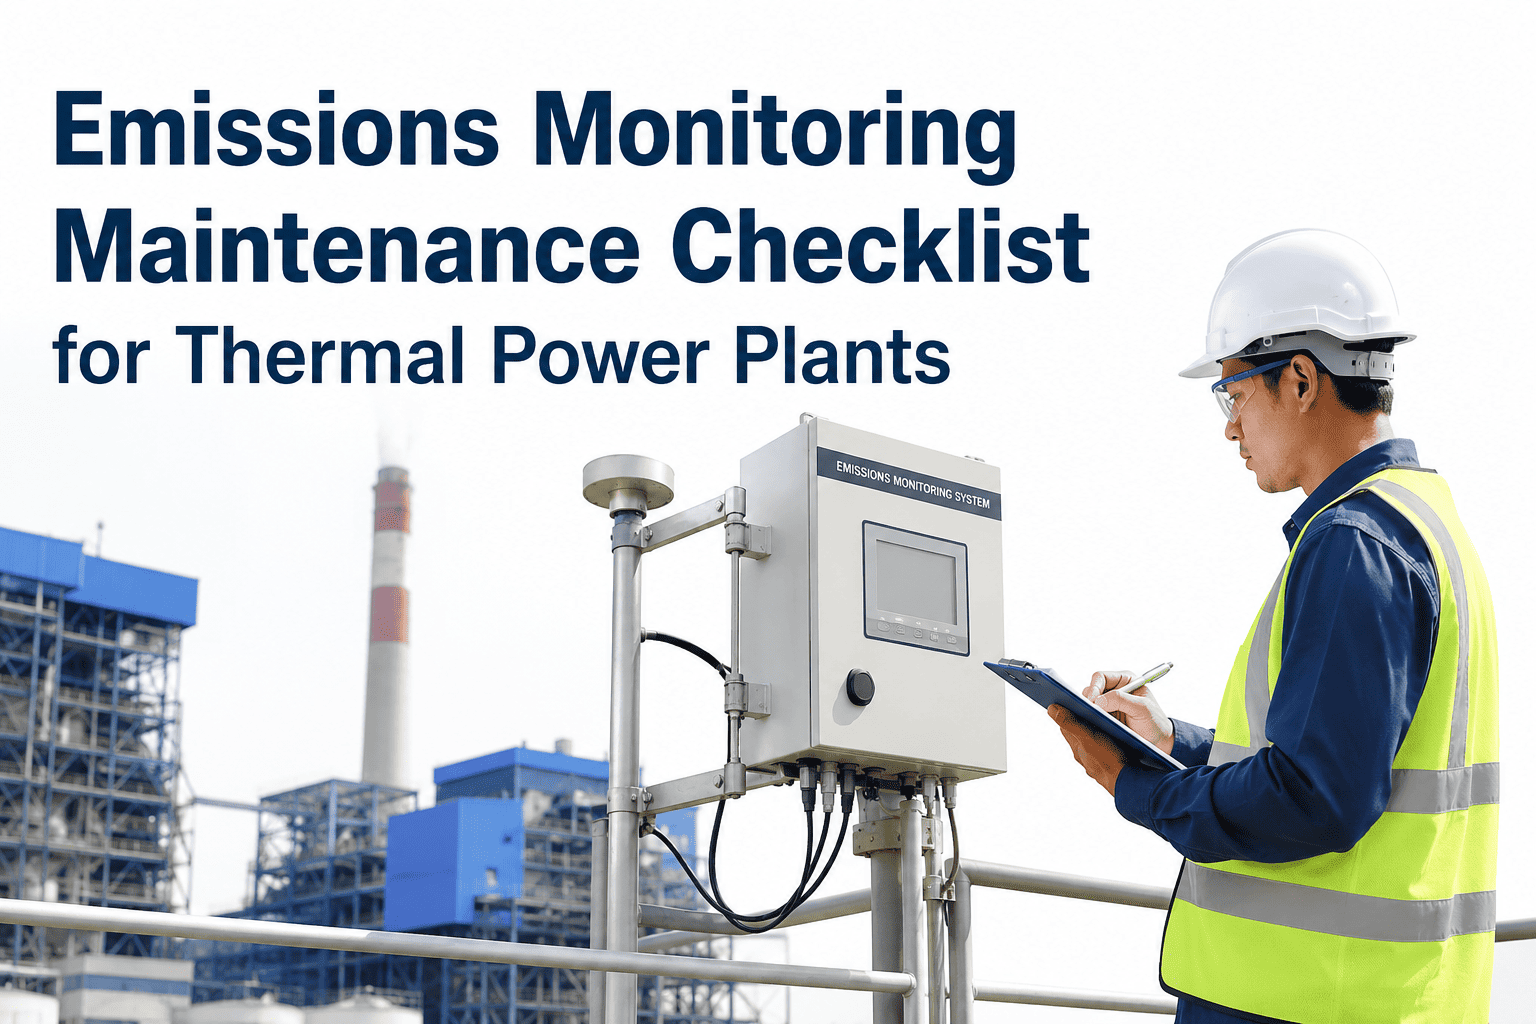
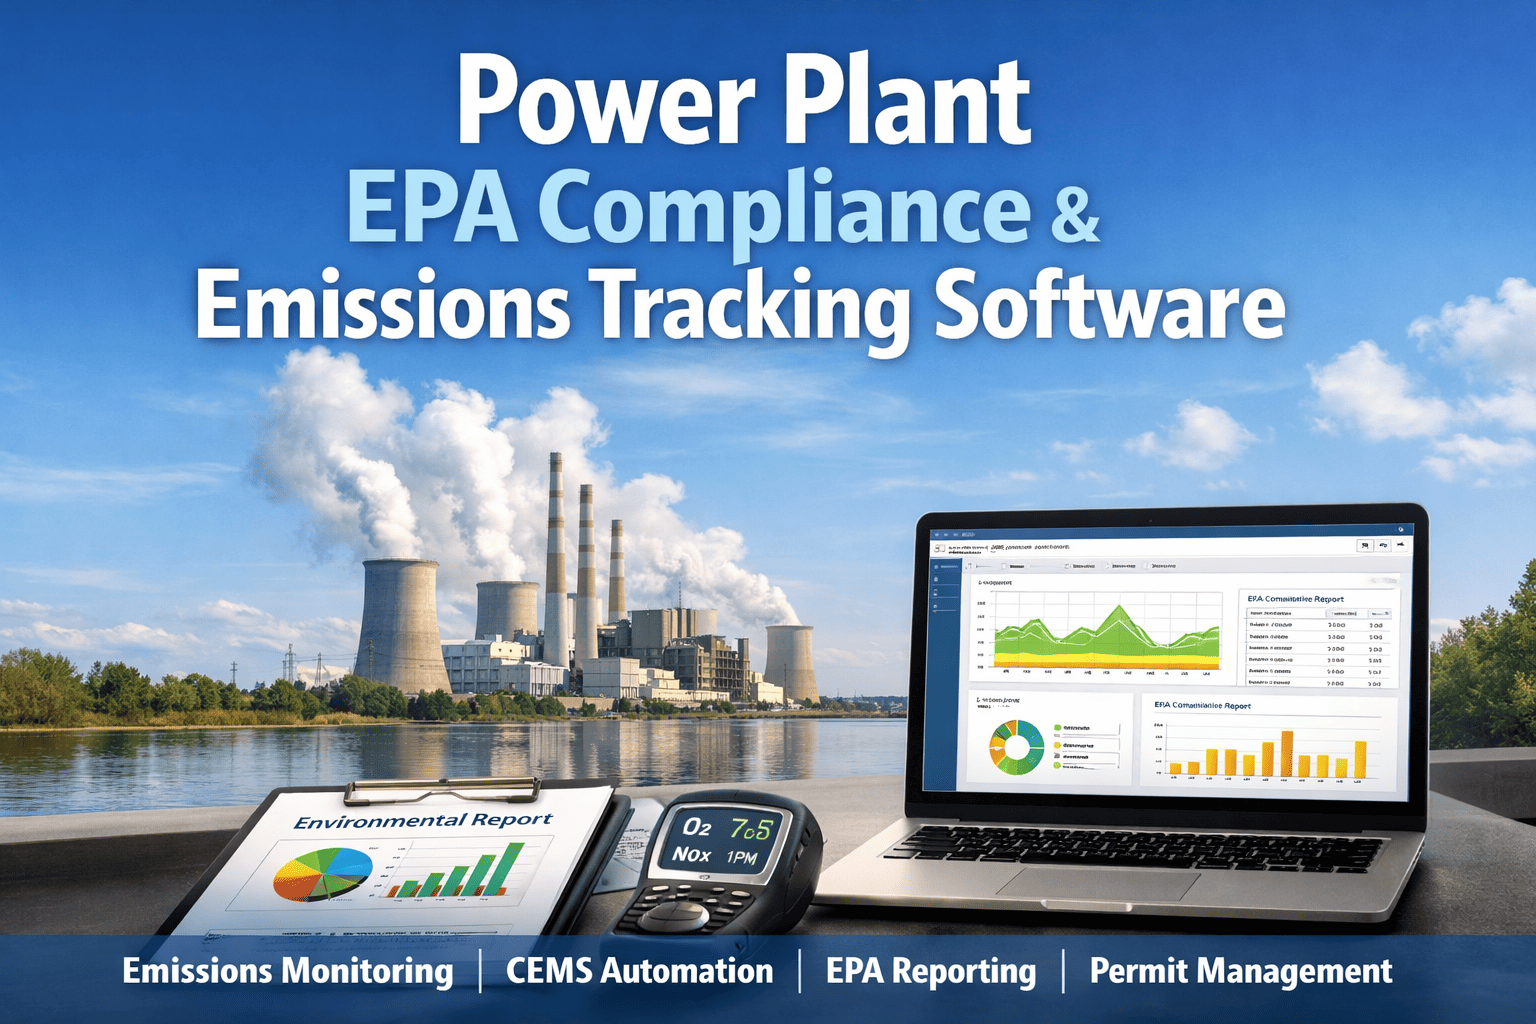
A thermal power plant's Continuous Emissions Monitoring System is both a regulatory obligation and a real-time performance diagnostic — when it works correctly, it proves compliance; when it fails, it creates compliance violations independent of how well the actual emission control equipment is performing. Regulatory agencies including CPCB, EPA, and equivalent authorities treat CEMS data gaps, calibration failures, and reporting outages as compliance violations even when stack emissions are within limits, because the missing data cannot be reconstructed or substituted after the fact. Plants with CMMS-managed CEMS maintenance programs maintain data availability above 95%, satisfy audit requirements with timestamped digital records, and use the same monitoring infrastructure to optimise combustion and fuel efficiency — turning a compliance cost into an operational asset. This checklist gives your environmental, instrumentation, and maintenance teams a complete inspection and calibration framework covering CEMS probes, sample conditioning, analyzers, data acquisition systems, and flue gas desulfurisation monitoring — structured so every check feeds directly into your OxMaint CMMS compliance tracking workflow with an audit-ready record for every finding.
Thermal Power Plant · Environmental Compliance · CEMS Maintenance Checklist
Emissions Monitoring Maintenance Checklist for Thermal Power Plants
A complete CEMS maintenance and calibration checklist covering stack probes, sample conditioning systems, gas analyzers, opacity monitors, data acquisition systems, and compliance reporting infrastructure — built for environmental and instrumentation teams targeting 95%+ CEMS data availability and zero exceedance events.
95%+
CEMS Data Availability Target
15 min
Regulatory Reporting Interval
5%
Max Calibration Drift Allowed
Zero
Target Exceedance Events
System Architecture
Five CEMS Subsystems — Each a Separate Maintenance Domain
A CEMS failure in any single subsystem can cause a complete data availability failure reported to regulators. Understanding the subsystem architecture is essential for assigning maintenance ownership and scheduling correctly.
1
Stack Probe and Extraction
Heated probe extracts a representative flue gas sample from the stack. Probe filter blockage is the most common single cause of CEMS data loss.
2
Sample Conditioning
Removes moisture, particulate, and interfering gases from the sample stream. Chiller failure causes moisture carryover that destroys analyzer cells.
3
Gas Analyzers
SO2, NOx, CO, O2, and CO2 analyzers measure component concentrations. Calibration drift above 5% of span requires immediate recalibration.
4
DAHS (Data Acquisition)
Collects, timestamps, and stores every 15-minute reading. Software failures or clock drift can invalidate entire reporting periods retroactively.
5
Opacity Monitor
Transmissometer measures stack particulate opacity. Dirty optical windows cause false high-opacity readings that trigger regulatory alerts.
DDaily
WWeekly
MMonthly
QQuarterly
AAnnual / RATA
Section 1
Daily CEMS Health and Calibration Checks
Daily checks are the foundation of CEMS data availability compliance. These checks take 30 minutes per system and prevent the majority of unplanned data outages that create regulatory exposure.
DAHS system clock accuracy verified — clock drift greater than 15 seconds per day can cause 15-minute data intervals to be logged incorrectly, invalidating the data record for that period under EPA 40 CFR Part 75 and equivalent CPCB requirements
DInstrumentation Technician · CMMS DAHS health log
Automated zero and span calibration cycle confirmed completed and logged — all analyzers confirmed within 5% of span drift tolerance; any analyzer failing auto-calibration check escalated to instrumentation team for same-day investigation
DEnvironmental Engineer · CMMS calibration log
Sample conditioning system status verified — chiller temperature confirmed within operating range (typically 2–5°C), condensate drain pump operation confirmed, moisture indicator upstream of analyzer confirmed dry, sample flow rate at design value
DInstrumentation Technician · CMMS conditioning log
Stack probe heater temperature confirmed within specification — probe heater failure causes sample moisture condensation inside the sample line, blocking flow and causing a data gap within hours; probe heater current draw logged to detect element degradation before complete failure
DInstrumentation Technician · CMMS probe log
Opacity monitor zero and span check confirmed — optical window cleanliness verified visually; any opacity reading deviation greater than 2% during stable load operation investigated for window fouling before next reporting period
DInstrumentation Technician · CMMS opacity log
CEMS data availability percentage calculated for the past 24 hours — any period below 95% hourly availability logged with cause code and corrective action in CMMS; regulatory reporting team notified of any data gap exceeding 15 minutes to initiate substitute data procedures
DEnvironmental Engineer · CMMS compliance dashboard
Section 2
Weekly and Monthly Preventive Maintenance
Weekly and monthly tasks address the slower degradation mechanisms — filter loading, analyzer cell fouling, calibration gas inventory, and sample line integrity — that daily checks are too granular to catch before they cause data outages.
Probe extraction filter differential pressure measured — rising dP trend indicates progressive filter loading; filter replacement scheduled before dP reaches alarm limit, not after, because a blocked filter causes immediate data gap with no recovery time
WInstrumentation Tech · CMMS filter maintenance record
Calibration gas cylinder pressures verified — remaining volume calculated against consumption rate; cylinder replacements ordered with 30-day buffer stock confirmed available; expired certification date on any cylinder triggers immediate replacement regardless of pressure
WEnvironmental Engineer · Gas inventory log in CMMS
Sample line trace heating confirmed operational throughout full length — cold spots in sample line cause moisture dropout and particulate deposition that progressively reduces sample flow and biases analyzer readings toward false-low values that mask actual emission events
WInstrumentation Tech · CMMS trace heat inspection log
NDIR or UV analyzer cell verification completed — zero gas and high-span calibration gas injected manually and analyzer response compared to DAHS auto-calibration result; any discrepancy greater than 2% between manual and automated verification triggers cell cleaning or replacement
MInstrumentation Tech · Analyzer calibration record
Flow monitor (velocity monitor or differential pressure probe) calibration coefficient reviewed against design — Pitot-based flow monitors are sensitive to probe fouling and require periodic comparison against stack flow test measurements to confirm mass emission rate calculations are valid
MInstrumentation Tech · Flow calibration record
CEMS shelter environment checked — temperature within 15–35°C range, humidity below 70%, no water ingress at cable entries, backup power supply tested, and UPS battery condition verified; loss of shelter conditioning is the leading cause of unexpected analyzer hardware failures
MInstrumentation Tech · CMMS shelter inspection log
OxMaint auto-generates CEMS maintenance assignments by subsystem and frequency, tracks calibration gas expiry dates, alerts environmental engineers when data availability drops below threshold, and stores every calibration record in a format ready for regulatory audit — eliminating manual spreadsheet tracking.
Section 3
Quarterly Audit Readiness and RATA Preparation
Quarterly checks and annual RATA (Relative Accuracy Test Audit) preparation are the highest-stakes CEMS maintenance activities. A RATA failure requires a facility to submit a Corrective Action Plan and imposes reporting restrictions that can affect permit compliance standing.
Quarterly linearity test completed for all analyzers — mid-range and high-range calibration gases injected; linearity verified within 5% of actual concentration; any analyzer failing linearity test taken offline for repair and substitute data procedures initiated per regulatory protocol
QEnvironmental Engineer · Linearity test report in CMMS
Full DAHS data record audit for the quarter — all 15-minute data points reviewed for substitution codes, missing periods, calibration period exclusions, and data flags; audit report prepared confirming data quality meets regulatory reporting standards
QEnvironmental Engineer · Quarterly data quality audit
Pre-RATA maintenance window confirmed in annual schedule — full filter replacement, analyzer cell cleaning, sample conditioning service, and opacity monitor optical window cleaning completed 2–4 weeks before RATA testing date to ensure peak system performance during the audit period
QMaintenance Planner · CMMS RATA prep checklist
FGD (Flue Gas Desulfurisation) system performance data reviewed against CEMS SO2 readings — correlation between FGD reagent utilisation, slurry pH, and measured SO2 emission confirms system performance trends; divergence between process indicators and CEMS output triggers investigation of both systems
QEnvironmental Engineer · FGD-CEMS correlation review
Annual RATA conducted by independent certified firm — reference method measurements taken in parallel with CEMS over minimum 9 operating hours; relative accuracy confirmed within 20% of reference for all monitored parameters; RATA certificate filed in CMMS compliance document store
AEnvironmental Compliance Manager · RATA certificate
Section 4
Emissions Trend Analysis and Compliance Monitoring
CEMS data is only as valuable as the analysis applied to it. Plants that review emissions trends proactively identify emission control equipment degradation weeks before a compliance threshold is approached — those that only check for exceedances have no warning time.
Weekly NOx trend reviewed against fuel and load conditions — a rising NOx baseline at constant load without corresponding fuel change indicates burner degradation, combustion tuning drift, or SCR catalyst deactivation requiring planned maintenance before permit limit is approached
WEnvironmental Engineer · CMMS emissions trend dashboard
SO2 emission rate compared against ESP and FGD performance data — a rising SO2 trend while FGD operation appears normal indicates CEMS analyzer calibration drift requiring verification; confirmed rising emission triggers ESP inlet condition review and FGD reagent quality investigation
WEnvironmental Engineer · Cross-system correlation review
Monthly compliance margin report generated — actual rolling-average emissions versus permit limits expressed as percentage of limit; any parameter above 80% of permit limit triggers a formal investigation and corrective action assignment before approaching the regulatory threshold
MEnvironmental Compliance Manager · CMMS compliance report
Annual emissions report preparation verified against CEMS DAHS raw data — all quarterly submissions cross-checked against source data records; any discrepancy between filed reports and raw DAHS data identified and documented before annual compliance certification is submitted to regulatory authority
AEnvironmental Compliance Manager · Annual report audit file
KPIs
CEMS Compliance and Reliability Targets
| Metric |
How to Measure |
Minimum Standard |
Best Practice Target |
Review Cadence |
| CEMS Data Availability |
Valid readings / Total operating hours |
90% per quarter |
Above 98% |
Daily |
| Calibration Drift |
Analyzer drift vs span value |
Below 5% of span |
Below 2% of span |
Daily |
| RATA Relative Accuracy |
CEMS vs reference method |
Within 20% required |
Within 10% |
Annual |
| Exceedance Events |
Readings above permit limit |
Zero tolerance |
Zero per year |
Per event |
| Compliance Margin |
Actual vs permit limit % |
Below 90% of limit |
Below 75% of limit |
Monthly |
| Unplanned CEMS Outages |
Unscheduled system downtime events |
Below 4 per quarter |
Below 1 per quarter |
Monthly |
FAQs
Frequently Asked Questions
What is the most common cause of CEMS data availability failures in thermal power plants?
Blocked probe extraction filters are the single most common cause of unplanned CEMS data outages. A filter that loads progressively over days gives no alarm until it is completely blocked — at which point sample flow stops and data immediately becomes invalid. Weekly differential pressure trending across the probe filter is the most effective prevention measure. OxMaint tracks filter dP trends and alerts teams before blockage causes data loss.
What happens if CEMS data availability falls below the regulatory minimum?
When CEMS data availability drops below the minimum threshold (90% per quarter under most regulatory frameworks), facilities must apply substitute data procedures that assume worst-case emission values for the missing periods. This inflates reported emissions, may trigger exceedance reporting, and creates regulatory inquiry. Repeated availability failures lead to formal enforcement notices and can affect permit renewal. Prevention through scheduled maintenance is far less costly than regulatory response.
How is a RATA different from routine CEMS calibration?
Routine calibration verifies the CEMS against certified reference gases in a controlled bench test. A RATA compares the CEMS readings against an independent reference method measurement in the actual stack under real operating conditions, conducted by an accredited third party. RATA validates the entire measurement chain from probe to DAHS, including extractive losses and sample conditioning effects that routine calibration cannot detect. Book a demo to see how OxMaint manages RATA scheduling and documentation.
Can CEMS data be used to optimise combustion as well as for compliance?
Absolutely — and the best-run plants treat CEMS as a combustion optimisation tool, not just a regulatory instrument. Continuous O2 and CO readings feed into combustion control loop adjustments that improve boiler efficiency by 0.5–1.5%, worth significant fuel savings at full load. NOx trend data guides burner maintenance scheduling. A well-maintained CEMS system pays for its maintenance cost many times over in fuel cost reductions alone.
How does a CMMS improve CEMS maintenance compliance management?
A CMMS manages calibration schedules with automatic due date alerts, tracks calibration gas cylinder expiry, stores RATA certificates and compliance reports digitally, generates data availability reports for regulatory submissions, and provides a complete audit trail of every maintenance action. Manual spreadsheet tracking of CEMS maintenance cannot provide the real-time availability monitoring or automated escalation that regulators expect to see as evidence of systematic compliance management. Start your OxMaint free trial and configure CEMS compliance tracking in minutes.
Ready to Deploy This Checklist?
Every Calibration Logged. Every Data Gap Prevented. Every Audit Passed.
OxMaint gives your environmental and instrumentation teams a complete CEMS compliance management platform — automating calibration schedules with expiry alerts, tracking data availability in real time, generating regulatory-ready inspection records, storing RATA certificates and compliance documents digitally, and alerting teams the moment any CEMS parameter drifts toward a threshold before it becomes a compliance event.