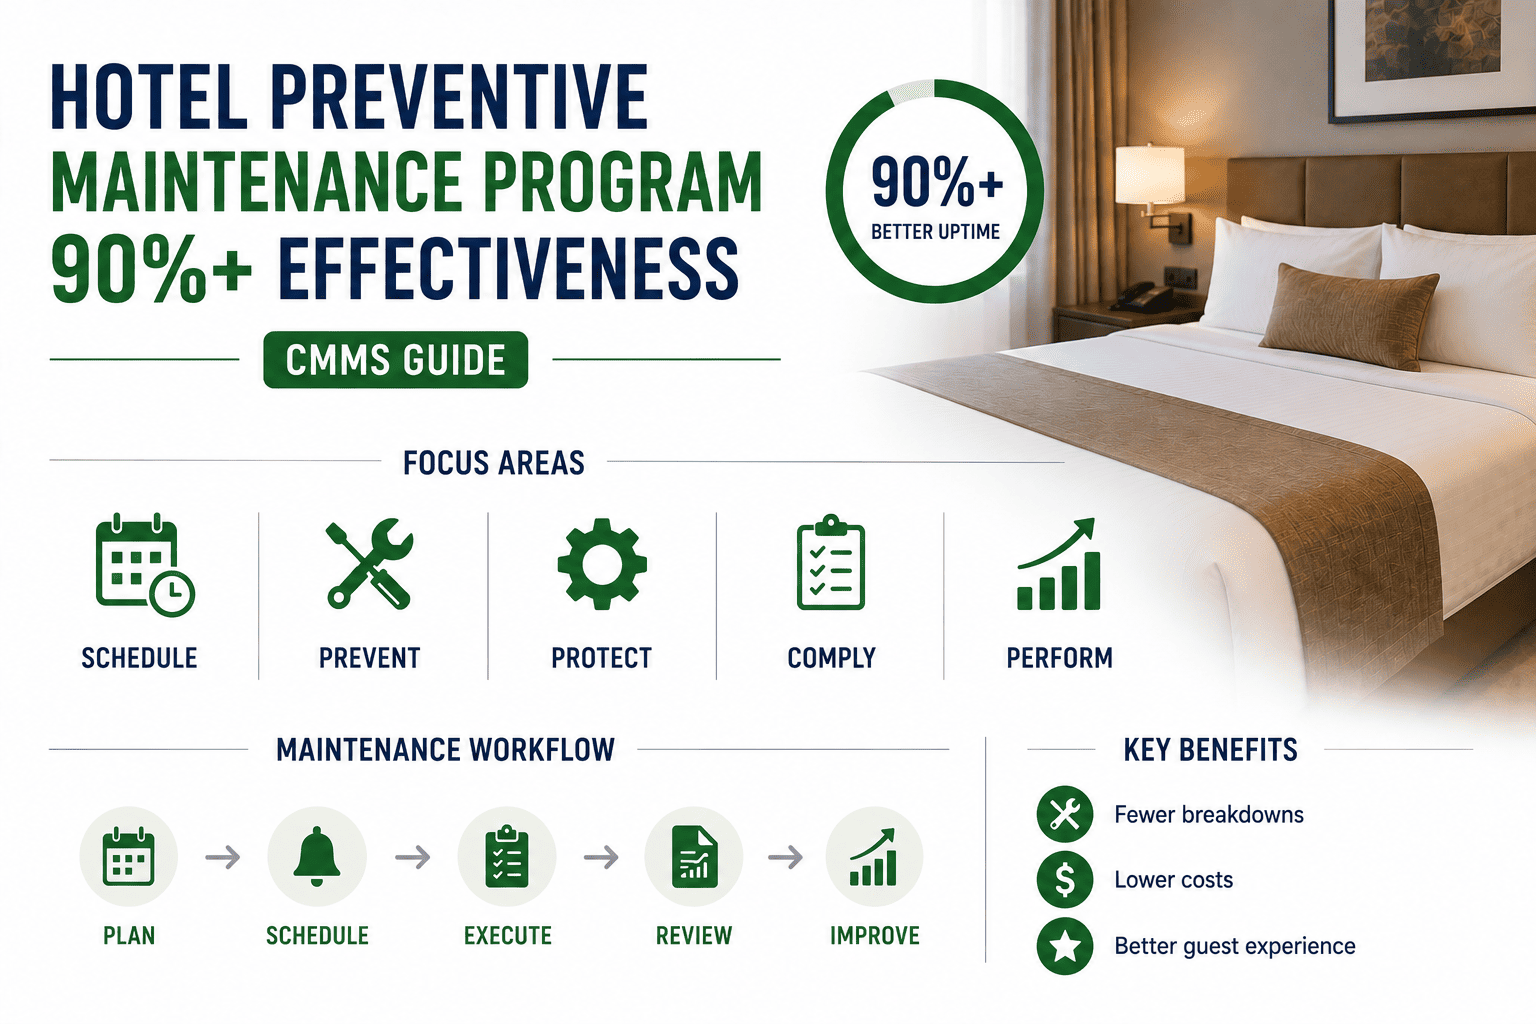
Hotels that sustain preventive maintenance compliance above 90% see guest complaint volumes drop by roughly 40% and review scores climb a full star on average — yet the industry baseline hovers near 48% because most programs still run on paper logs and clipboard rounds. The gap between 48% and 90% is not about working harder; it is about engineering a PM library, setting defensible frequencies, assigning resources against asset criticality, and tracking completion through a CMMS dashboard that flags slippage the same day it happens. This guide walks through each of those levers with the numbers, formulas, and worked examples a multi-property director of engineering needs to build a program that holds above 90% across every asset class. If you want to skip straight to running it, you can Start Free Trial and configure the PM library while you read.
The CMMS Compliance Playbook
Can a hotel engineering team realistically hold PM compliance above 90% — every month, every property?
Yes, but only when the PM library is engineered against asset criticality, frequencies are defended with MTBF data, and a CMMS dashboard escalates missed tasks within 24 hours. Paper-based programs average 48% completion; CMMS-driven programs cross 90% within three months of go-live.
Why 90% Is The Tipping Point
The Business Case For A 90%+ PM Compliance Floor
Every percentage point of PM compliance below 90% correlates with a measurable spike in reactive work orders, guest-facing outages, and capex acceleration. The math is unforgiving — and it is the reason top-quoted hotel portfolios set 90% as the minimum acceptable floor, not a stretch goal.
A 240-Key Full-Service Hotel At 48% Compliance
Consider a 240-key property running 1,100 preventive tasks per quarter on paper logs at 48% completion. The 572 missed tasks concentrate in guestroom fan coil units, ice machine condensers, and pool chemistry — exactly the assets that generate front-desk complaints. In a typical quarter the property logged 147 reactive work orders, spent $41,200 on emergency vendor calls, and absorbed 23 comped-room nights from HVAC and plumbing outages. After migrating to a CMMS with a rebuilt PM library and 24-hour escalation, the same property reached 91% compliance in 11 weeks. Reactive volume fell to 52 work orders, emergency spend dropped to $13,800, and comped nights fell to four. The program paid for itself in under four months.
Build The Library
Engineering A PM Library That Survives Staff Turnover
A PM library is not a binder of checklists — it is a structured database of asset, task, frequency, labor minutes, parts, and acceptance criteria. Get the schema wrong and compliance will collapse the first time a chief engineer leaves. The five-tier model below is what 90%+ portfolios use.
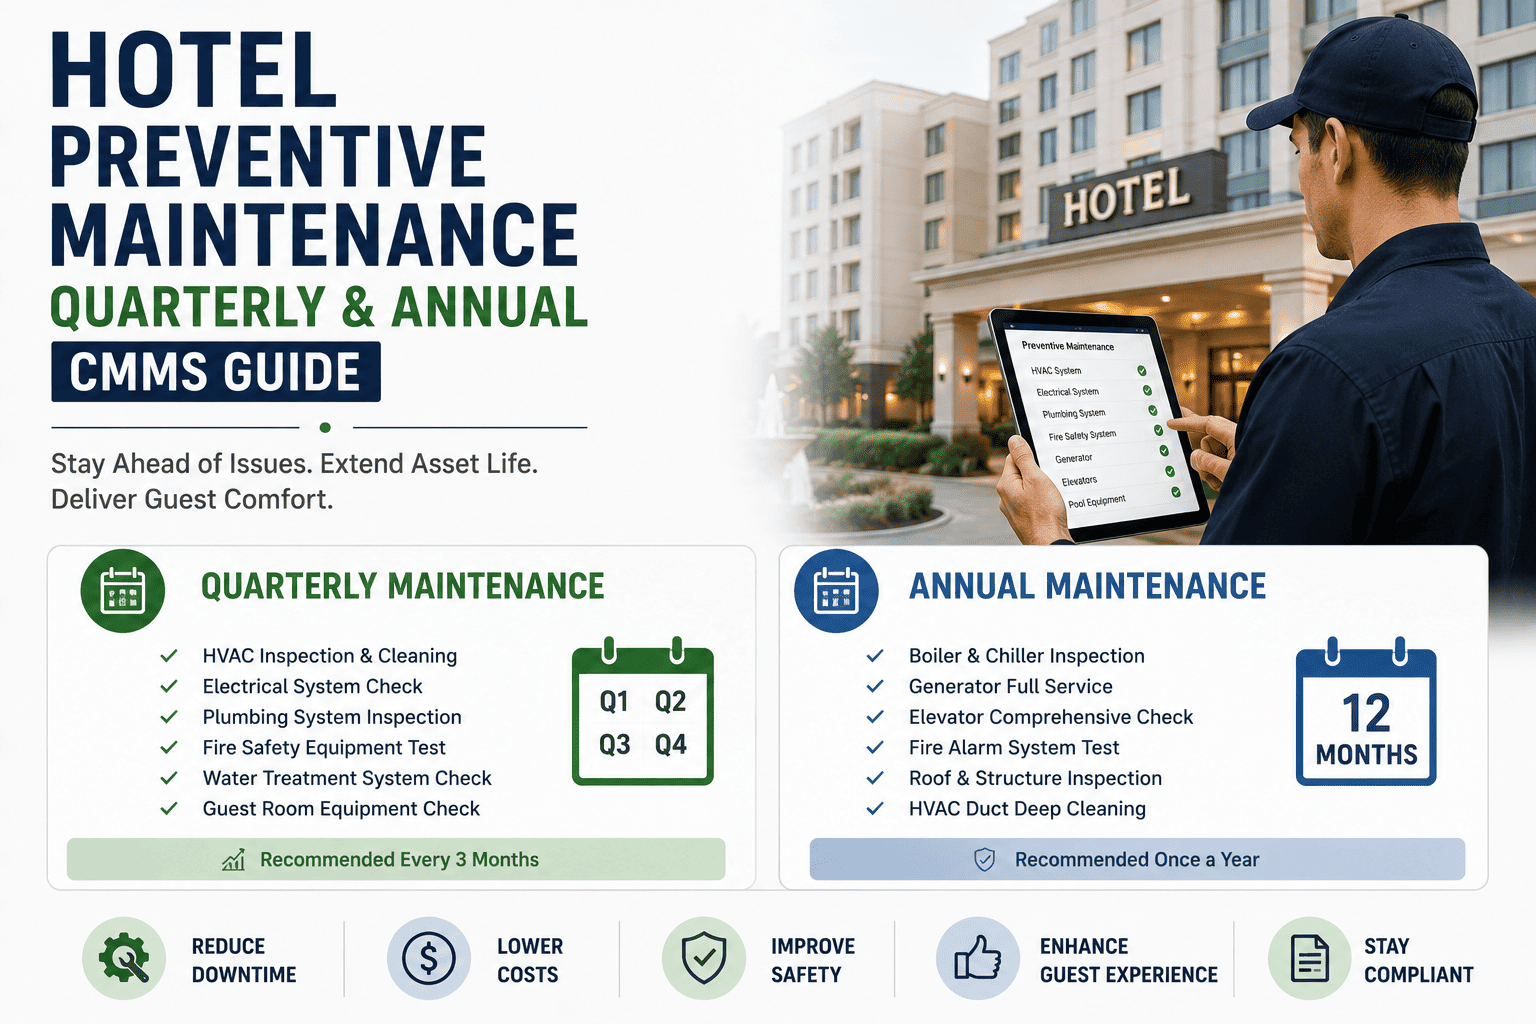
Life-Safety & Code-Required
Fire pumps, sprinkler tests, emergency lighting, elevators, backflow preventers. Frequencies set by AHJ code — NFPA 25, ASME A17.1, local fire marshal. Non-negotiable; missed tasks trigger automatic escalation to the regional director within 24 hours.
Guest-Facing Critical
Guestroom HVAC, plumbing fixtures, ice machines, pool chemistry, laundry equipment. Frequencies driven by MTBF and usage hours. These assets drive 70%+ of guest complaints, so they carry the strictest 90% compliance floor.
Operational Backbone
Boilers, chillers, cooling towers, main electrical, DDC/BMS controls. Failures here cascade across the whole property. PMs are quarterly to annual, labor-heavy, and typically require vendor coordination and lockout-tagout plans.
Interior & FF&E
Door closers, caulk lines, grout, furniture hardware, window seals. Low individual risk but high cumulative impact on review scores. Monthly room-rounds task group; rolled into the room-attendant defect-reporting flow.
Grounds & Exterior
Parking lot lighting, irrigation, roof drains, signage, pavers. Seasonal and weather-driven; scheduled against climate data rather than fixed calendar dates. Often delegated to outside vendors with CMMS work-order tracking.
Set Frequencies With Data
The Frequency Formula: From Guesswork To Defensible Intervals
Most hotel PM frequencies are inherited from a vendor recommendation written 15 years ago. A 90%+ program replaces inherited intervals with a calculation grounded in mean time between failures, asset criticality, and condition data streaming from the BMS.
MTBF is derived from the last 24 months of work-order history. Criticality Factor ranges from 0.4 (Tier 4 FF&E) to 0.95 (Tier 1 life-safety). Condition Score (0–1) comes from inspection data and IoT sensors; a higher score extends the interval, a lower score shortens it. Recalculate quarterly.
| Asset Class | Typical MTBF | Criticality | Calculated Interval | Industry Default |
|---|---|---|---|---|
| Guestroom Fan Coil Unit | 14 months | 0.85 | 90 days | 180 days |
| Ice Machine Condenser | 9 months | 0.80 | 60 days | 90 days |
| Commercial Dishwasher | 11 months | 0.75 | 75 days | 30 days |
| Boiler (Hydronic) | 38 months | 0.95 | 180 days | 365 days |
| Pool Pump & Filter | 16 months | 0.80 | 90 days | 90 days |
| Emergency Generator | 60 months | 0.95 | 30 days (run) / 365 (full) | 30 / 365 |
Frequencies are recalculated each quarter as MTBF data accumulates. A CMMS automates this — paper systems cannot.
90 Days To Compliance
The Go-Live Timeline: From 48% To 90% In One Quarter
A structured CMMS rollout reaches 90% compliance in roughly 90 days when it follows this sequence. Skipping the baseline audit or the first-week daily standup is the most common reason rollouts stall in the 60–70% range.
Asset Register & Compliance Baseline
Walk every asset. Capture make, model, install date, criticality tier, and current condition score. Pull 24 months of work-order history and calculate actual PM completion rate. Most properties discover the real number is 40–50%, not the 75% the clipboard rounds claimed.
PM Library Engineering
Build task templates for every asset using the five-tier model. Apply the frequency formula. Attach labor estimates, parts lists, and acceptance criteria. Import into CMMS. Validate 10% of templates against OEM service manuals before go-live.
CMMS Activation & Daily Standups
Cut over from paper. Every technician works from mobile CMMS tickets. Chief engineer runs a 15-minute daily standup reviewing yesterday's completions, today's queue, and any task past its due date. Escalation rules fire automatically at 24 hours overdue.
Frequency & Labor Tuning
Review the first 60 days of data. Identify tasks consistently completed early (extend interval) or late (add labor or shorten interval). Rebalance the daily queue so no technician carries more than 7 hours of PM work in an 8-hour shift. Retrain on any task with a first-pass yield below 80%.
Dashboard Accountability & 90% Lock-In
Regional director reviews the portfolio dashboard weekly. Properties below 90% submit a corrective action plan within 48 hours. Quarterly business review ties compliance to bonus structure. The program is now self-sustaining; compliance holds above 90% indefinitely without heroics.
Dashboard Discipline
The Five KPIs A PM Dashboard Must Show Daily
A CMMS dashboard that does not surface these five metrics is decorative. Each one maps to a specific failure mode that drags compliance back toward the 48% baseline the moment nobody is watching.
PM Completion Rate
Completed PMs ÷ Scheduled PMs, measured weekly and trailing 30 days. The headline number. Target: 90%+. Anything below 85% for two consecutive weeks triggers a director-level review.
Schedule Compliance
PMs completed within ±2 days of due date ÷ total completed. A team can hit 90% completion by batch-catching up at month-end — schedule compliance catches that gaming and forces rhythm.
Reactive-To-PM Ratio
Reactive work orders ÷ PM work orders. World-class hotels run at 0.6 or lower. Above 1.5 means the PM program is losing ground and failures are outpacing prevention.
First-Pass Yield
PMs that pass inspection without rework ÷ total PMs. Below 80% indicates the task template is ambiguous, the technician needs retraining, or the parts specified are wrong. Often the hidden killer of compliance.
MTBF Trend By Asset
Rolling 90-day mean time between failures per critical asset. If MTBF is shrinking despite PM completion above 90%, the PM task itself is ineffective and the template must be re-engineered — not the frequency.
"We ran at 51% PM compliance for six years and thought it was normal. The CMMS dashboard showed us the number on day one. Eleven weeks later we were at 91% and reactive calls had dropped by two-thirds. The dashboard was the whole game — you cannot manage what the clipboard hides."
Ready To Build A 90%+ PM Program At Your Properties?
Deploy the PM library, frequency formula, and compliance dashboard in a single afternoon. Your chief engineer sees the baseline number on day one — and watches it climb past 90% within the quarter.
Frequently Asked Questions
Hotel PM Program: What Teams Ask Before Go-Live
How long does it take a hotel to reach 90% PM compliance from a 48% paper baseline?
A structured CMMS rollout reaches 90% compliance in roughly 90 days when it follows the five-phase timeline: baseline audit, library build, go-live with daily standups, frequency tuning, and dashboard accountability. Properties that skip the baseline audit or the daily standup typically stall in the 60–70% range. You can Start Free Trial and begin the baseline audit the same day.
What is the single biggest reason hotel PM programs stay below 60% compliance?
Paper logs with no escalation. When a missed PM does not trigger a visible consequence within 24 hours, technicians deprioritize it, the backlog compounds, and compliance drifts to whatever the clipboard rounds happen to catch. A CMMS with automatic 24-hour overdue escalation is the single highest-impact fix.
How do we set PM frequencies that are not just copied from an OEM manual?
Use the formula: Interval = MTBF × Criticality Factor × (1 − Condition Score). MTBF comes from 24 months of work-order history, criticality ranges from 0.4 to 0.95 by asset tier, and condition score is derived from inspection data and BMS sensors. Recalculate quarterly so frequencies tighten or loosen as the asset ages.
Can a CMMS PM program work for a portfolio of properties, not just one hotel?
Yes — and portfolio deployment is where the ROI compounds. A shared PM library template rolls out to every property, each site localizes asset registers, and a regional director reviews a single dashboard ranking all properties by compliance. Properties below 90% submit a corrective action plan within 48 hours. To see the portfolio dashboard, Book a Demo and we will walk through a multi-property configuration.
What labor investment is required to sustain a 90%+ PM program?
Plan for 1.2 to 1.5 labor hours per guestroom per month for PM execution, plus 4–6 hours per week for a chief engineer to run the daily standup, review the dashboard, and tune frequencies. This is typically less than the labor currently absorbed by reactive work orders, so net labor is flat or slightly lower once compliance crosses 80%.
Stop Accepting 48% Compliance. Engineer A 90%+ PM Program.
Every day below 90% is a guest complaint waiting to happen. Build the library, set the frequencies, turn on the dashboard — and watch reactive spend drop by two-thirds within a single quarter.
Free 14-day trial · No credit card