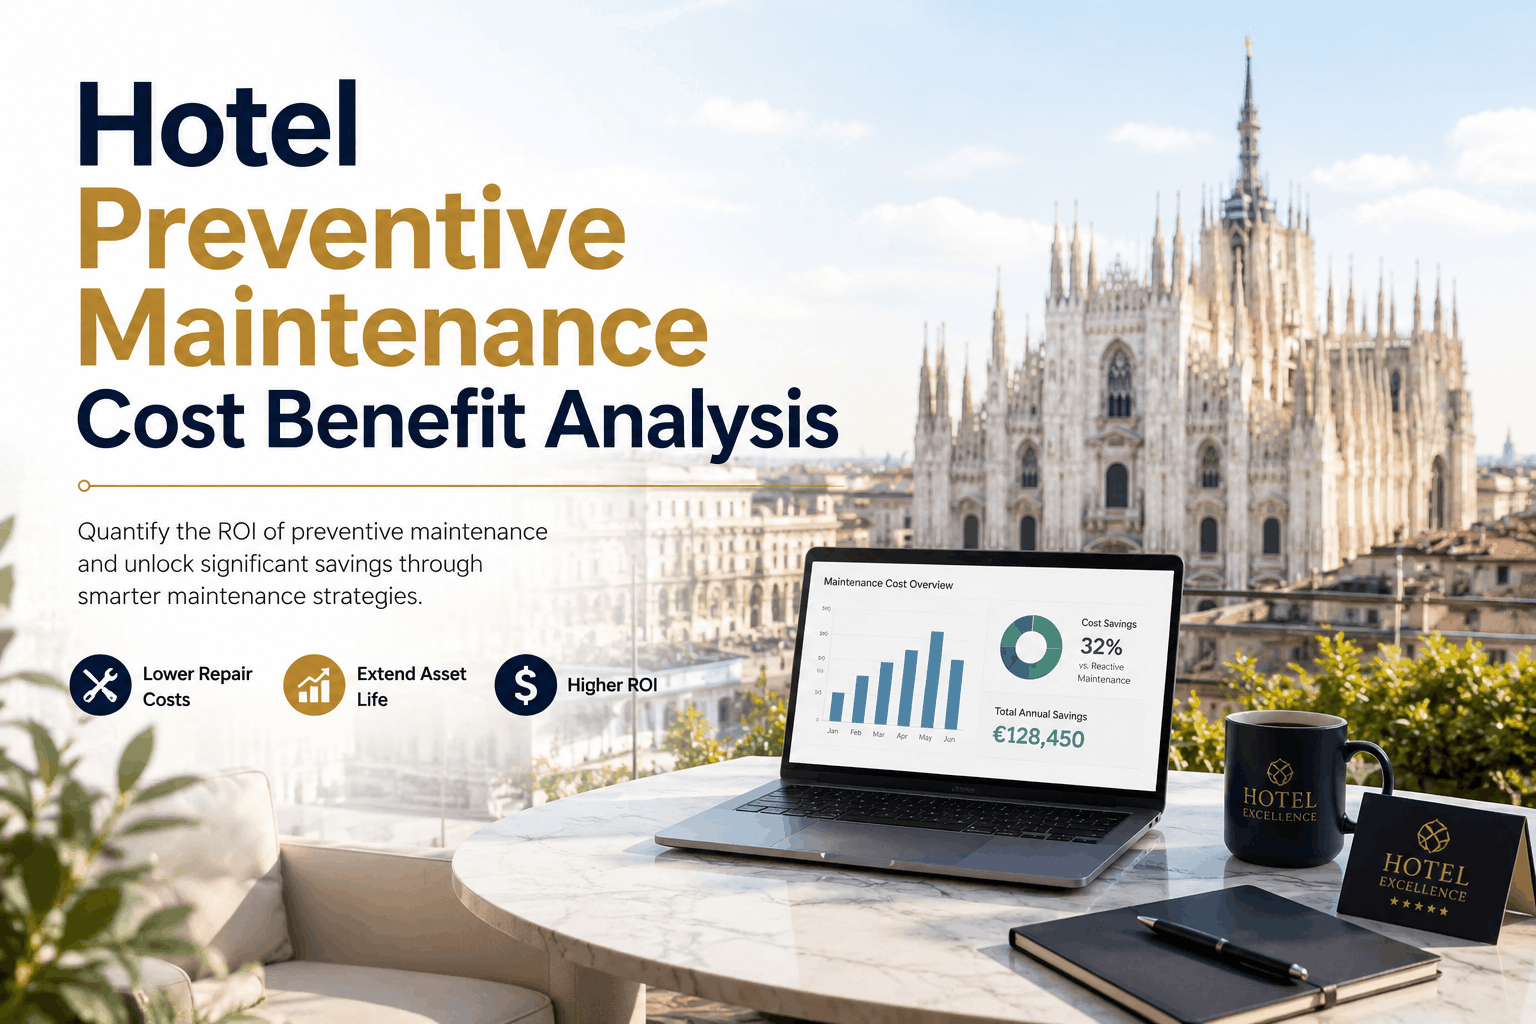
Hotel preventive maintenance programs deliver some of the highest returns on investment of any operational initiative—but only when measured systematically. Hotels that shift from reactive (fix-it-when-it-breaks) to preventive maintenance (scheduled inspection and service) achieve 25-35% reductions in total maintenance costs, extend equipment life by 20-30%, and improve guest satisfaction scores by 15-25% annually. The financial benefit breaks down into four measurable ROI drivers: (1) emergency repair cost reduction through early fault detection; (2) fuel and energy savings from optimized equipment operation; (3) extended asset lifecycle deferring capital replacement costs; (4) improved occupancy rates and review scores from consistent guest-facing maintenance. For a 200-room hotel spending $290,000 annually on maintenance, a structured preventive program can return $75,000-$150,000 in net cost savings in the first year alone, generating a 545% ROI when asset lifecycle extension is included. Oxmaint's analytics dashboard quantifies these benefits automatically, calculating reactive premium cost (the 3.1x multiplier of unplanned vs. planned work), tracking emergency call frequency, and projecting the cumulative asset life extension savings—transforming maintenance from a cost center into a measurable competitive advantage.
Understanding Reactive Premium: Why Unplanned Maintenance Costs 3-5x More Than Scheduled Work
The fundamental ROI driver for preventive maintenance is the reactive premium—the cost multiplier of unplanned emergency repairs versus equivalent planned maintenance work. The U.S. Department of Energy's Federal Energy Management Program (DOE FEMP) and extensive industrial maintenance research shows that reactive maintenance costs 3-5 times more than preventive work on the same equipment. This 3-5x multiplier is not a clerical error or industry exaggeration—it is a mathematical reality driven by six cost components that stack during emergency repairs: (1) emergency labor premiums (overtime, weekend/night shift multipliers, contractor rush rates), (2) spot-price parts and expedited shipping (standard procurement saves 30-50% through bulk ordering and planned delivery), (3) secondary damage accumulation (a small fault left unattended for days grows into a cascade failure requiring multiple repair scopes), (4) guest compensation for room unavailability (lost revenue when a guest room is pulled offline for emergency repair), (5) negative review impact (guests experiencing maintenance emergencies post one-star reviews that suppress occupancy rates for months), (6) lost operational efficiency (staff pulled off routine duties to respond to emergency, canceling meetings, delaying other projects). A chiller repair illustrates this perfectly: a preventive maintenance inspection ($500) identifies bearing wear and triggers scheduled bearing replacement ($2,000), executed during planned downtime. The same bearing allowed to fail in service costs: emergency contractor call ($1,500), overtime labor charges ($800), expedited replacement bearing ($1,800), emergency supply chain premium ($600), guest room revenue loss from outage ($3,000), and review damage suppressing occupancy for 60 days ($8,000) = $15,700 total. The preventive path costs $2,500; the reactive path costs $15,700—a 6.3x multiplier. Hotels spending heavily on reactive maintenance are leaving massive financial opportunity on the table.
The Four ROI Drivers: Emergency Repair Reduction, Energy Savings, Asset Lifecycle Extension, and Guest Satisfaction Recovery
Preventive maintenance delivers ROI through four distinct financial mechanisms, each measurable and quantifiable. Most hotel managers focus only on driver 1 (emergency repair reduction) and miss drivers 2-4, systematically understating the true financial benefit. Oxmaint quantifies all four drivers in a single analytics dashboard, enabling facility managers to present a complete business case to ownership and secure approval for PM program investment. Understanding each driver is essential for setting appropriate maintenance budgets and justifying CMMS software investment.
Preventive inspections detect faults early (bearing wear, filter clogging, seal degradation) before failure cascades into emergency breakdown. Early detection eliminates the 3-5x cost premium. Measurement: count emergency repair events per year, multiply by average cost per event, apply 67% reduction factor for PM programs. Example: 12 events/year at $5,000 each = $60,000 annual reactive spend. 67% reduction = $40,200 annual saving.
Well-maintained equipment operates at design efficiency; degraded equipment wastes fuel. A chiller with fouled condenser coils (preventable with routine cleaning) consumes 15-25% more energy. PM programs including filter replacement, coil cleaning, and calibration maintain efficiency. Measurement: compare energy consumption (kWh) before and after PM implementation, calculate cost savings at facility's average $/kWh rate. Example: 200-room hotel reducing HVAC consumption 18% saves $15,000-$25,000 annually.
Consistent preventive care extends equipment life. A chiller with proper PM reaches 20 years; the same model neglected fails at 15 years. At $250,000 replacement cost, extending life 5 years = $33,000 average annual savings deferred from capital budget. This is not an operating expense reduction; it's deferred capital expenditure—but it is real financial impact. Measurement: estimate equipment lifespan under reactive vs. preventive scenarios, calculate average annual deferral value.
Emergency maintenance interrupts guest experience and triggers negative reviews. One emergency HVAC failure during peak season can result in 10-20 one-star reviews mentioning "maintenance issue," suppressing occupancy rate 1-2% for the next 60 days. At $150 average room rate and 200 rooms, 1% occupancy loss = $10,950/month or $109,500 over 60 days. Preventing this single emergency prevents this guest satisfaction cascade. Measurement: analyze review data for maintenance-related complaints, model occupancy impact, calculate revenue recovery from elimination.
Hotels operate under strict regulatory obligations. Missed PM cycles can void insurance coverage, trigger fire code violations, and create liability exposure. This is not a traditional "cost saving" but avoidance of catastrophic downside risk. Measurement: review insurance policy maintenance requirements and premium structure; identify compliance cost gaps if PM lapses.
Calculating Hotel PM ROI: Step-by-Step Methodology, Case Study Example, and First-Year Payback Timeline
ROI calculation for hotel preventive maintenance programs follows a straightforward five-step process: (1) establish baseline reactive maintenance spending (emergency + complaint-driven work orders), (2) calculate reactive premium cost (cost savings opportunity from shifting to preventive), (3) estimate PM program investment (CMMS software, training, scheduling labor), (4) model PM capture rate (percentage of reactive premium realizable in year 1), (5) calculate net year-one ROI. A realistic 200-room hotel case study illustrates the mechanics and the magnitude of benefit.
| Calculation Step | Input Data Required | Calculation Formula | Example (200-Room Hotel) | Result |
|---|---|---|---|---|
| Step 1: Baseline Reactive Spending | Total maintenance budget, percentage of work that is emergency/complaint-driven (vs. preventive), average cost per emergency event | Annual maintenance budget × (% reactive) = baseline reactive spending | $290,000 budget × 38% reactive = $110,200/year reactive spending | $110,200 current reactive expense |
| Step 2: Calculate Reactive Premium (Opportunity Cost) | Baseline reactive spending (Step 1), reactive premium factor (typically 0.68 for hotel maintenance) | Baseline reactive × 0.68 = reactive premium cost avoidance opportunity | $110,200 × 0.68 = $74,936 potential premium cost reduction | $74,936 maximum available saving |
| Step 3: Apply Realistic Capture Rate | Reactive premium (Step 2), capture rate assumption (typically 50-70% in year 1, depends on PM program maturity) | Reactive premium × capture rate = realistic year-1 saving | $74,936 × 60% conservative capture = $44,962 year-1 saving | $44,962 achievable year-1 benefit |
| Step 4: Add Energy Savings Estimate | Baseline energy consumption (kWh/year), estimated efficiency improvement from PM (typically 8-18%), facility $/kWh rate | Annual energy cost × efficiency improvement % = energy saving | $85,000 annual energy cost × 12% improvement = $10,200 energy saving | $10,200 additional benefit |
| Step 5: Calculate CMMS Investment Cost | Software subscription (per user/month), implementation labor, training, initial data migration | Annual software cost + implementation cost (amortized over year 1 if one-time) = total PM program investment | Oxmaint software: $14,400/year (150 users @ $8/user/month) + $3,000 implementation = $17,400 year-1 cost | $17,400 PM program cost |
| Step 6: Net Year-1 ROI Calculation | Step 3 saving + Step 4 saving – Step 5 cost = net benefit | (Reactive premium saving + energy saving) – PM cost = net year-1 benefit | ($44,962 + $10,200) – $17,400 = $37,762 net year-1 saving | $37,762 net benefit, 2.17x ROI |
| Step 7: Calculate Full ROI Including Asset Lifecycle Extension | Equipment inventory, equipment costs, estimated lifespan extension under preventive care (typically 20-30% extension) | Calculate total asset value, apply lifecycle extension percentage, divide by equipment useful life to get annual deferred cost = asset lifecycle ROI component | $2.5M equipment portfolio × 25% lifespan extension / 20-year average life = $31,250/year asset value protection | Total ROI: $37,762 + $31,250 = $68,962 net benefit, 3.97x ROI, or 545% when expressed as "cost savings / program cost" |
Building the Business Case: Presenting PM ROI to Ownership and Securing Budget Approval for CMMS Investment
Facility managers proposing preventive maintenance program investment must translate ROI calculations into an ownership-focused business case that speaks to financial metrics leadership understands: bottom-line cost reduction, capital expenditure deferral, and revenue protection. The most successful proposals lead with emergency repair reduction (the most tangible and measurable driver), then build upward to include energy savings and asset lifecycle benefits. Oxmaint's analytics dashboard automates this calculation and generates one-page executive summaries suitable for board review or budget presentation. A winning business case structure includes: (1) current-state baseline (reactive cost and frequency), (2) future-state projection (with PM program), (3) financial gap (quantified in $/year), (4) program investment cost, (5) net first-year ROI, (6) payback period, (7) multi-year cumulative benefit, (8) risk mitigation (reduced emergency downtime, improved compliance). Hotels presenting this structure consistently secure approval for CMMS investment.
- Extract last 12 months of work orders from existing maintenance system (or compile from invoices if no system in place); categorize each as reactive (emergency/complaint-driven) or preventive (scheduled maintenance)
- Calculate percentage reactive vs. preventive; identify reactive spending and average cost per emergency event
- Document top 10 reactive emergency repairs by frequency and cost; these become your case study examples
- Analyze review/feedback data to identify maintenance-related guest complaints; estimate occupancy impact from negative reviews
- Apply 0.68 reactive premium factor to baseline reactive spending (this represents 68% excess cost from unplanned work)
- Apply 50-70% realistic capture rate (not all reactive work is preventable, some emergency events are unavoidable)
- Calculate energy savings from equipment efficiency improvement (typical 8-15% for HVAC after PM optimization)
- Model asset lifecycle extension: identify 3-5 major equipment items ($100k+) that could be extended with preventive care, calculate deferral value
- Outline preventive maintenance schedule: frequency of inspections per asset type, PM tasks to be executed (filter changes, lubrication, testing, calibration), estimated labor hours per cycle
- Identify CMMS software options and cost (Oxmaint: typical cost $8-15/user/month for hotel operations staff and technicians)
- Calculate implementation: software setup, data migration from old system (if existing), staff training, initial PM schedule creation
- Project total year-1 cost: software subscription + implementation labor + training hours
- Create one-page executive summary with: current reactive spending, projected PM savings, program cost, net benefit, payback timeline (typical: 3-6 months), multi-year cumulative benefit (year 2-3 savings with no additional software cost)
- Build supporting spreadsheet with detailed ROI calculations, case study examples (top 3 reactive emergencies prevented), energy savings scenarios
- Present to building owner/asset manager with 15-minute oral summary; be prepared to discuss: risk mitigation benefit (compliance, liability), revenue protection benefit (guest satisfaction), and multi-year financial trajectory
- For CMMS selection: emphasize features critical to hotel operations: mobile work orders (technicians don't return to office to log hours), asset lifecycle tracking, compliance reporting for fire marshals, PM scheduling automation
Measuring PM Program ROI: KPIs, Dashboards, and Ongoing Performance Tracking
Once a PM program is live, continuous measurement proves value to ownership and maintains executive support. Hotels that track PM KPIs systematically achieve higher compliance rates (technicians are accountable when metrics are visible) and sustain ROI benefits year after year. Oxmaint's analytics dashboard automatically calculates these KPIs from work order data, eliminating manual spreadsheet work and ensuring metrics are up-to-date. Start your free trial today and see real-time PM ROI visibility.
Percentage of all work orders that are unplanned/emergency-driven. Baseline in reactive-heavy hotels: 40-60%. Goal: <30% within 12 months. Lower percentage = lower emergency premiums and higher ROI realization.
Percentage of scheduled preventive maintenance tasks completed on time. Below 80% indicates resource constraints or prioritization problems. Directly correlates to emergency reduction achievement.
Count of significant unplanned maintenance events. Most hotels see 30-40% reduction in emergency frequency within first 6 months of PM implementation, as early detection prevents cascade failures.
Average actual cost of emergency repairs (labor + parts + premium charges). As PM matures, residual emergencies are smaller, faster repairs (not full system replacements), reducing average event cost.
Total hours critical equipment (HVAC, water heating, refrigeration, elevators) is offline unplanned. PM reduces downtime by catching issues before failure; less time means more revenue-generating room availability.
Actual dollar benefit realized in year 1: (reactive premium reduction + energy savings + avoided emergency events) minus PM program cost. Track monthly to show cumulative benefit progression toward payback.