Multi Property Hotel Maintenance Management: Centralized CMMS for Hotel Chains & Portfolio Optimization
By Jam on March 23, 2026
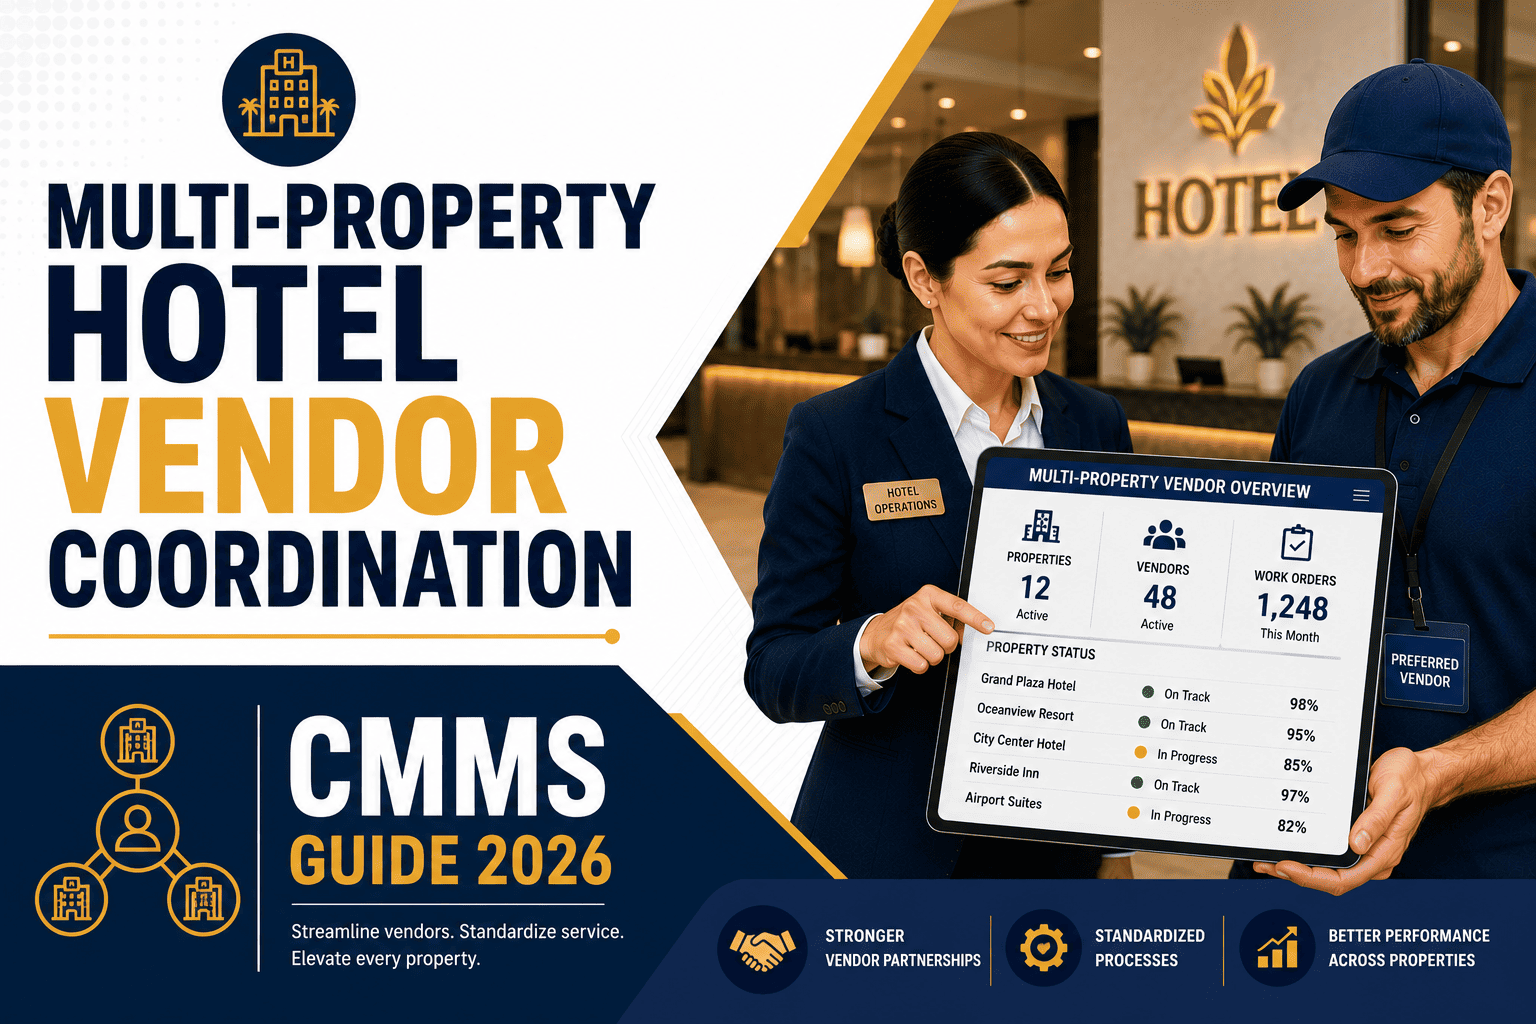
Hotel chains and portfolio operators managing more than three properties face a structural maintenance challenge that single-asset operators do not: performance variance across locations that is invisible until it surfaces in owner reporting, brand audit scores, or insurance claims. Asset managers reviewing quarterly results routinely encounter 30% to 50% cost-per-available-room spread between comparable properties in the same portfolio — a variance driven almost entirely by inconsistent PM adherence, reactive maintenance ratios, and absence of cross-site benchmarking. Centralised CMMS architecture eliminates the data isolation that creates this variance, giving regional engineering directors and portfolio asset managers a single operating picture across every property in real time. Teams ready to close this performance gap can sign up for Oxmaint's multi-property platform or book a demo to see the portfolio dashboard configured for your property count and brand mix.
Multi Property ManagementMulti Property Hotel Maintenance Management: Centralized CMMS for Hotel Chains & Portfolio Optimization10–12 min read
30–50%
CPAR variance typical between comparable properties in uncoordinated hotel portfolios
2.8x
higher reactive maintenance ratio at properties without centralised PM standard enforcement
62%
reduction in brand audit maintenance deficiencies within 12 months of centralised CMMS deployment
$380K
average annual maintenance cost saving across a 5-property portfolio following CMMS standardisation
The Multi-Property Maintenance Problem: Why Decentralisation Costs More
The default operating model for growing hotel groups — each property maintaining its own spreadsheets, local CMMS instances, or paper-based PM logs — produces compounding inefficiencies that become structurally embedded over time. Regional directors inherit portfolios where no two properties define work order priority the same way, no shared asset register exists, and benchmark comparisons require weeks of manual data extraction. The cost is not merely administrative: deferred maintenance at a single property in a branded portfolio carries brand standard exposure, lender covenant risk, and guest satisfaction implications that affect the entire portfolio's financing terms. Book a demo to see how Oxmaint's Multi Property Dashboard surfaces cross-site performance gaps before they become capital events, or sign up to begin connecting your existing property data into a unified portfolio view.
Decentralised Model Costs
Operational impact
No cross-site benchmarkingPM standard driftDuplicate contractor spendInconsistent CapEx timingBrand audit exposure
Financial consequence
30–50% CPAR variance within comparable portfolio · Emergency premium costs 2–3x planned rates · Manual reporting lag of 3–6 weeks to asset managers
45–60%
reactive maintenance ratio at decentralised properties versus 15–25% target
Centralised CMMS Gains
Operational improvements
Real-time CPAR by propertyBrand template enforcementPortfolio-wide PM complianceConsolidated contractor negotiation
Financial outcome
8–14% aggregate maintenance cost reduction · Vendor consolidation saves 12–18% on contractor spend · Capital plan synchronised across portfolio for lender reporting
62%
reduction in brand audit deficiencies within 12 months of centralised deployment
Portfolio Analytics Value
Analytics capabilities
Cross-site KPI rankingCapEx horizon forecastingTechnician productivity indexAsset age risk scoring
Reporting output
Owner-ready monthly portfolio reports · Lender covenant compliance tracking · Brand standard PM adherence by property and category
<1 hr
to generate portfolio maintenance report versus 3–5 days manual assembly
Centralise Your Portfolio Maintenance Operations in One Platform
Oxmaint's Multi Property Dashboard connects all sites to a single asset register, enforces brand PM templates across every property, and delivers real-time CPAR and compliance analytics to regional directors and asset managers.
Centralised CMMS Architecture: What It Covers Across a Hotel Portfolio
A centralised CMMS is not a single-property system replicated across locations — it is a hierarchical architecture where brand-level PM templates, asset class standards, and reporting frameworks cascade down to individual property operations while performance data flows upward to portfolio analytics in real time. The distinction matters because the governance model determines whether engineering quality scales with the portfolio or degrades as the property count grows. Directors overseeing portfolios of five or more properties can sign up to see how Oxmaint's property hierarchy is configured for their management structure, or book a demo to walk through the brand template library and cross-site analytics setup.
Brand Standard PM Templates
Portfolio-wide enforcement
A single set of OEM-aligned and brand-compliant PM task libraries pushed to all properties simultaneously. Updates to frequency, scope, or compliance requirements propagate across the portfolio without property-by-property reconfiguration.
Impact: PM adherence standardised across all sites
Hierarchical Asset Register
Portfolio → Property → System
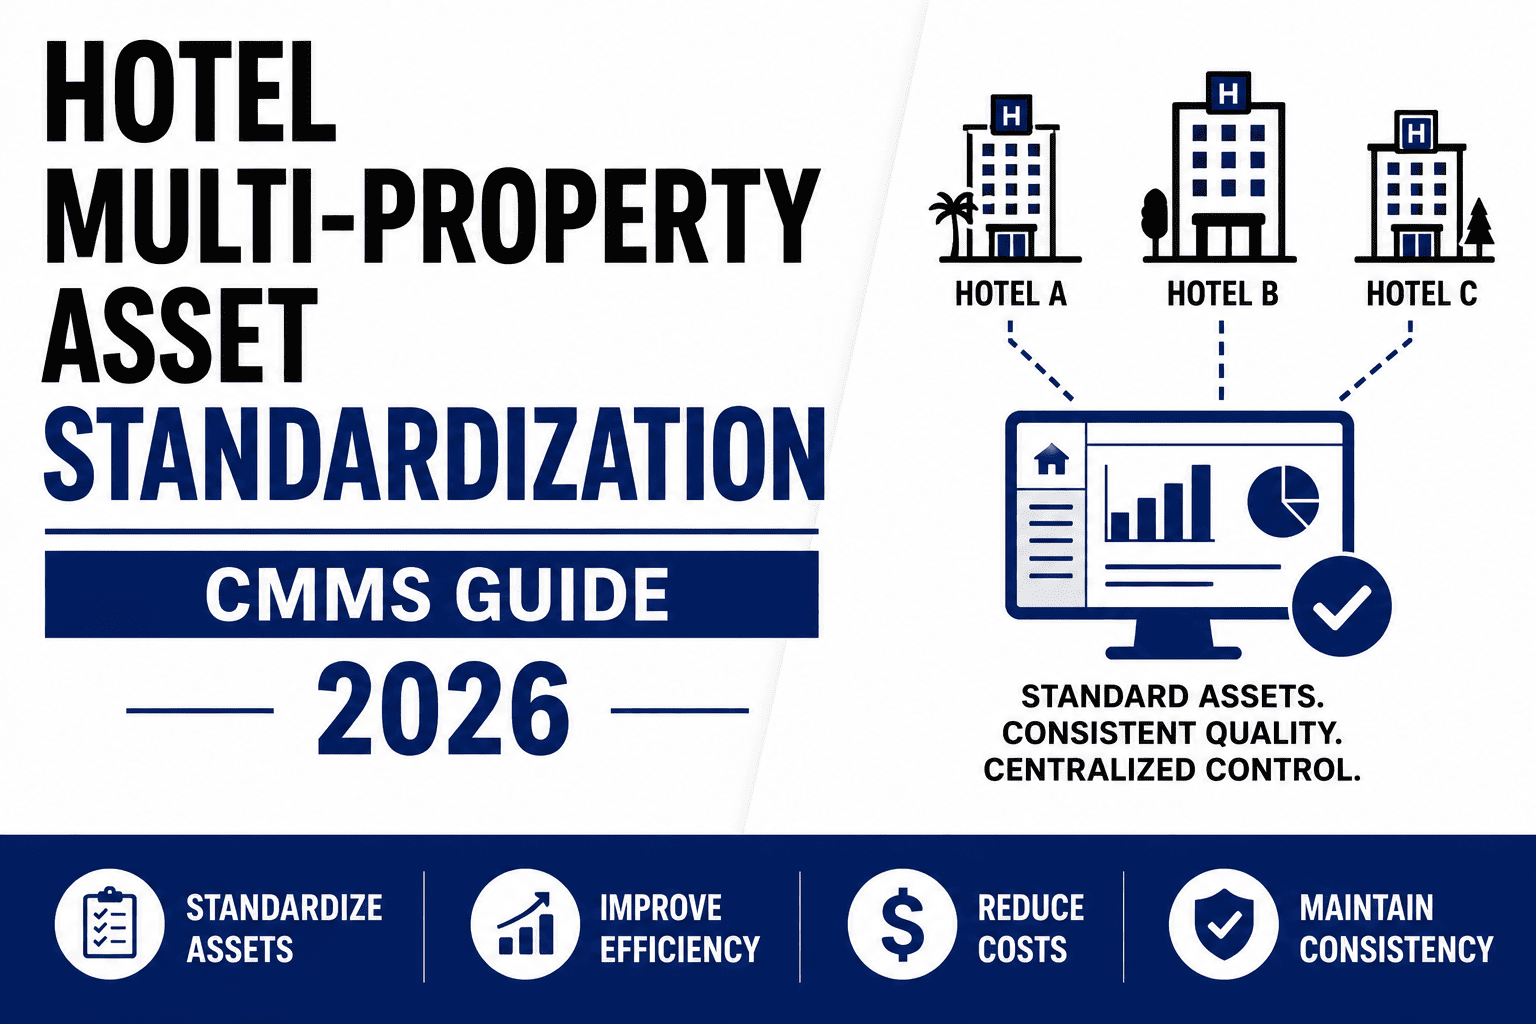
Assets structured at portfolio, property, department, and system level. Acquisition of a new property onboards directly into the existing taxonomy — no custom build required per site. Asset age, condition, and replacement forecasts visible at portfolio level for capital planning.
Impact: 5-year CapEx plan across all properties in one view
Cross-Site Performance Analytics
Real-time portfolio KPIs
CPAR, reactive ratio, PM compliance percentage, mean time to resolution, and open work order aging ranked by property. Regional directors identify outlier properties in minutes, not weeks. Owner and asset manager reports generated without manual data extraction.
Impact: Portfolio ranking visible in under 60 seconds
Centralised Vendor & Contract Management
Portfolio-level procurement leverage
Service contracts, SLAs, and contractor performance tracked centrally across all properties. Portfolio-wide spend visibility enables consolidated tender negotiation — typically yielding 12–18% reduction versus individual property contracting. Contractor response time compliance visible per site.
Impact: 12–18% contractor cost reduction via portfolio leverage
Brand Audit Compliance Tracking
Pre-audit readiness score
PM tasks mapped directly to brand standard audit criteria. Pre-audit compliance score calculated automatically for each property. Deficiencies flagged with remediation work orders generated before the audit window — converting reactive audit response to proactive compliance management.
Impact: 62% reduction in audit deficiencies within 12 months
Technician Workforce Optimisation
Cross-property resource planning
Labour hours, skill deployment, and technician productivity tracked by property and compared across portfolio. Seasonal demand modelling enables cross-property technician deployment during peak periods. Training gap identification across the portfolio reduces brand standard non-compliance driven by skill deficiency.
Impact: 14–22% improvement in labour utilisation
Portfolio Performance Benchmarking: Centralised vs Decentralised Operations
Metric
Centralised CMMS (Oxmaint)
Decentralised / Property-Silo Model
CPAR variance across portfolio
Variance narrows to 10–15% within 18 months. Real-time ranking identifies outliers immediately. Root cause traceable to asset, department, or technician level.
30–50% variance common and undetected. No benchmarking without manual data extraction. Regional directors receive reports 3–6 weeks after the period closes.
PM compliance rate
Brand template enforcement produces 88–94% on-time PM completion across portfolio. Overdue tasks escalate automatically to regional director view.
Compliance rates of 55–70% typical when each property manages its own schedules. No cross-site visibility. Chronic low performers unidentified until brand audit.
Capital plan coordination
Portfolio-level CapEx plan with property-by-property replacement timelines. Reserve draw requests coordinated to optimise ownership group cash flow and lender reporting.
Individual property capital requests submitted independently. No portfolio-level prioritisation. Ownership groups manage conflicting CapEx demands from multiple properties simultaneously.
Contractor spend management
Portfolio-wide spend visible by vendor, category, and property. Consolidated tender enables 12–18% rate reduction. SLA compliance tracked automatically across all sites.
Each property negotiates independently. No spend consolidation leverage. Duplicate contractor relationships for same service category across portfolio common.
Owner and lender reporting
Automated portfolio report in under one hour. CapEx vs OpEx split by property. CPAR trends, PM compliance, and reactive ratio in owner-ready format.
Manual assembly from multiple systems takes 3–5 days per report cycle. CapEx/OpEx misclassification risk. Asset manager queries require multiple email threads across properties.
Deployment Framework: Centralising Maintenance Across a Hotel Portfolio
Centralisation of maintenance operations across an existing portfolio is a change management exercise as much as a technology implementation. The framework below reflects deployment sequencing for hotel groups with 3 to 20 properties operating under a mix of management agreements, owned assets, and franchise arrangements. The priority at each stage is minimising operational disruption at property level while building portfolio-wide data integrity from day one. Directors managing the transition can sign up to begin the asset register build for their first pilot property, or book a demo to walk through Oxmaint's multi-property onboarding sequence with a solutions specialist.
1
Establish Portfolio-Level Asset Taxonomy and Brand PM Library
Define the asset classification hierarchy that will apply across all properties — portfolio, property, building, department, system, asset. Build or import brand standard PM task libraries aligned to OEM specifications and franchise agreement requirements. This taxonomy becomes the foundation that every property onboards into — not a bespoke build per site. Oxmaint's Brand Standard Templates module contains pre-built libraries for major hotel brand categories that regional engineering directors can customise before pushing to properties.
2
Pilot on Highest-Variance or Highest-Risk Property First
Deploy the centralised CMMS at the property with the largest gap between current performance and portfolio benchmark — this produces the most visible ROI within 90 days and builds the case for portfolio-wide rollout with ownership and lenders. Alternatively, deploy at the newest acquisition to establish baseline data before deferred maintenance accumulates. Avoid piloting at the best-performing property: it understates the platform's value to ownership groups evaluating the investment.
3
Configure Cross-Site Analytics and Reporting Hierarchy
Map the reporting structure to the management agreement hierarchy: portfolio owner, asset manager, regional director, general manager, and Director of Engineering each receive dashboards calibrated to their decision-making scope. Asset managers require CPAR trends and CapEx horizon data. Regional directors require PM compliance ranking and reactive ratio by property. GMs require open work order aging and upcoming PM schedule. Oxmaint's Cross-Site Analytics module delivers each view from the same data set without custom report builds per stakeholder tier.
4
Roll Out to Remaining Properties in Cohorts of 3–5
Portfolio-wide rollout in cohorts of 3 to 5 properties per wave allows regional engineering support to be concentrated during onboarding without disrupting operational continuity. Each cohort uses the established taxonomy — no re-architecture between waves. Cross-site benchmarking activates immediately once a second property is live: the data comparison itself drives adoption at sites that observe their ranking position relative to comparable properties in the portfolio.
5
Activate Consolidated Vendor Management and Capital Plan Coordination
Once all properties are live and 90 days of cross-site spend data has accumulated, run a portfolio-wide contractor spend analysis. Identify service categories where multiple vendors serve the same properties, consolidate to preferred vendors, and use portfolio-wide volume data in the next tender cycle. Simultaneously, extract asset age and condition data across all properties to build the 5-year capital plan that ownership groups and lenders require for covenant compliance and acquisition financing.
KPI Framework for Multi-Property Maintenance Operations
Effective multi-property maintenance governance requires a two-tier KPI architecture: portfolio-level metrics that ownership and asset management teams use for financial decision-making, and property-level operational KPIs that regional engineering directors use for performance management. Conflating the two tiers produces reporting that is too granular for ownership review and too aggregated for operational intervention. The framework below is designed for properties operating under institutional ownership or management agreements with structured reporting obligations. Engineering teams building their first cross-site KPI framework can book a demo to see how Oxmaint's dashboard hierarchy separates these tiers automatically, or sign up to configure the portfolio KPI structure against their own management hierarchy.
Cost Per Available Room (CPAR)
Owner / Asset Manager tier
Primary financial normalisation metric. Track monthly by property, year-to-date against budget, and trended against portfolio benchmark and competitive set. Variance above 15% from portfolio average triggers automatic regional director review flag in Oxmaint dashboard.
Target: Within 10% of segment benchmark
PM Compliance Rate
Regional Director tier
Percentage of scheduled PM tasks completed on time versus planned schedule. Portfolio average and property-by-property ranking. Minimum threshold of 85% for brand standard maintenance categories — properties below threshold trigger escalation protocol to GM and regional director simultaneously.
Target: 88–94% on-time completion
Reactive Maintenance Ratio
Regional Director tier
Unplanned reactive work orders as a percentage of total work order volume. Industry target is 15–25% for well-managed full-service properties. Portfolio ranking by reactive ratio identifies properties with systemic PM under-investment before CPAR impact materialises in financial reporting.
Target: Under 25% reactive ratio
Mean Time to Resolution (MTTR)
GM / Director of Engineering tier
Average elapsed time from work order creation to completion, segmented by priority tier and asset category. Cross-portfolio MTTR comparison identifies properties with contractor response time issues, parts availability gaps, or technician skill deficiencies requiring targeted intervention.
Target: P1 under 4 hrs · P2 under 24 hrs · P3 under 72 hrs
Brand Standard Compliance Score
Asset Manager / Owner tier
PM tasks mapped to brand audit criteria produce a rolling compliance score per property. Score below threshold generates automatic pre-audit remediation work orders. Portfolio-wide score trending supports brand renewal discussions and franchise agreement negotiations with factual performance data.
Target: 90%+ compliance score pre-audit
CapEx Forecast Accuracy
Owner / Lender tier
Variance between capital plan forecast and actual CapEx expenditure across the portfolio. Condition monitoring data feeding RUL estimates improves forecast accuracy — reducing the emergency capital requests that damage ownership group relationships and trigger lender covenant discussions.
Reduction in brand audit maintenance deficiencies across portfolio within 12 months62%
Reduction in cross-property CPAR variance — from 40%+ spread to under 15%71%
Of portfolio owner reports generated automatically versus manual assembly84%
Reduction in emergency contractor callout costs across portfolio versus pre-centralisation baseline58%
Frequently Asked Questions: Multi-Property Hotel Maintenance Management
QHow does a centralised CMMS handle different brand standards across a mixed portfolio?
Centralised CMMS architecture supports multiple brand template libraries operating simultaneously within the same platform — each property assigned to the applicable brand standard set while sharing the same portfolio analytics layer. Properties operating under different franchise agreements (Marriott, Hilton, IHG, independent) each receive brand-specific PM task libraries, compliance scoring, and audit mapping, while regional directors see cross-portfolio performance using normalised KPIs that abstract from brand-specific definitions. Oxmaint's Brand Standard Templates module is pre-configured for major brand categories and customisable for independent or soft-brand properties.
QWhat is the typical ROI timeline for centralised CMMS deployment across a hotel portfolio?
Properties with high reactive maintenance ratios (above 40%) typically see measurable cost reduction within 90 days of deployment — driven by PM compliance improvements that begin displacing emergency callouts. Portfolio-level financial impact, including CPAR variance reduction and contractor spend consolidation, typically materialises at the 6–12 month mark and is quantifiable for ownership group reporting. The 18–24 month mark is where capital plan improvements (forecast accuracy, deferred maintenance prevention) produce the largest single-year financial benefit, particularly for portfolios approaching major equipment replacement cycles.
QHow should multi-property maintenance data be structured for lender reporting and covenant compliance?
Lenders financing hotel portfolios under DSCR or LTV covenants increasingly require structured maintenance data demonstrating FF&E reserve adequacy and capital plan credibility. Centralised CMMS provides: asset age distribution by property supporting replacement cost forecasting; CapEx versus OpEx split by property aligned with management agreement classification thresholds; PM compliance trending as proxy for physical asset condition between formal PCAs; and reactive maintenance ratios as leading indicators of deferred maintenance accumulation. Oxmaint's portfolio reporting exports in formats compatible with asset management and lender reporting requirements without manual reformatting.
QCan a centralised CMMS support hotel acquisitions and dispositions in an active portfolio?
Centralised CMMS with a standardised asset taxonomy significantly accelerates acquisition onboarding — a new property is added to the existing hierarchy rather than built from scratch. Pre-acquisition due diligence benefits from the platform's property condition scoring framework. At disposition, the historical work order record, PM compliance history, and asset condition data constitute a documented maintenance record that supports asset valuation and purchaser due diligence. Properties with 3+ years of centralised CMMS records consistently achieve tighter bid spreads and faster buyer due diligence timelines in transaction processes.
QHow does cross-property benchmarking work when properties are in different markets and segments?
Effective cross-property benchmarking normalises for segment, key count, age, and amenity complexity before ranking. CPAR comparisons between a 150-key select service property and a 400-key full-service resort are meaningless without normalisation — but CPAR trends within segment, reactive ratio comparisons across similar properties, and PM compliance rankings are valid across diverse portfolios because they measure process discipline rather than absolute spend levels. Oxmaint's Cross-Site Analytics applies segment and property-type normalisation filters that allow regional directors to make valid performance comparisons across a portfolio that spans multiple segments and markets.
Centralise Your Hotel Portfolio Maintenance Operations
Oxmaint's Multi Property Dashboard connects all properties to a single asset register, enforces brand PM standards across every site, and delivers real-time portfolio analytics to regional directors and asset management teams — eliminating the data isolation that drives CPAR variance and reactive maintenance costs.