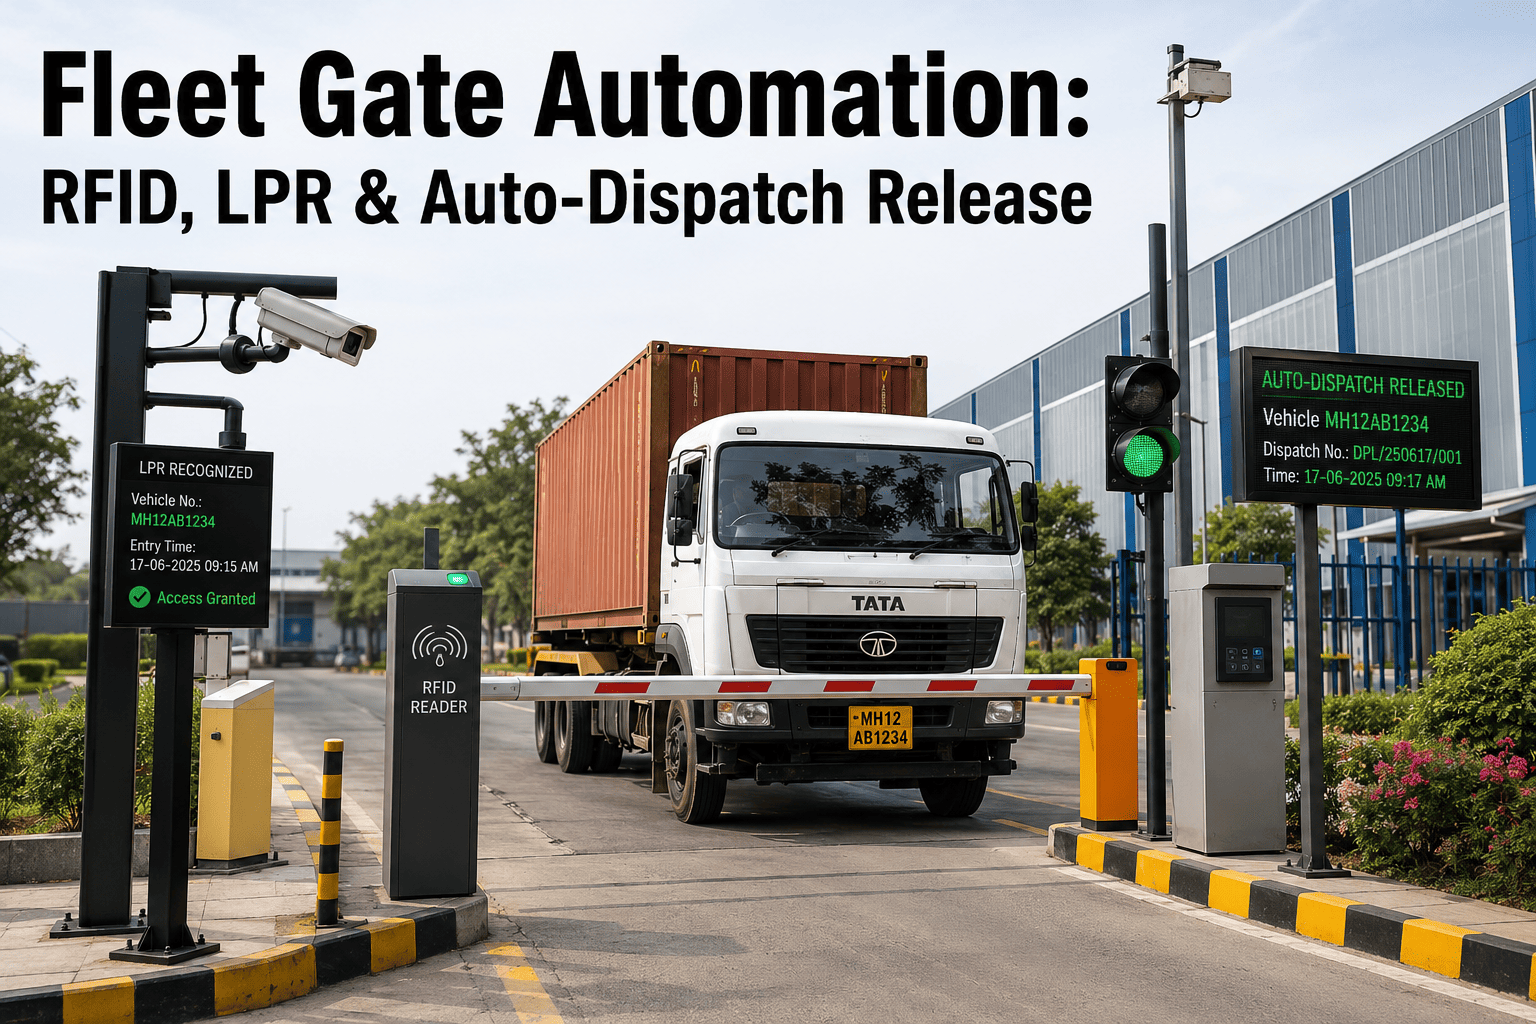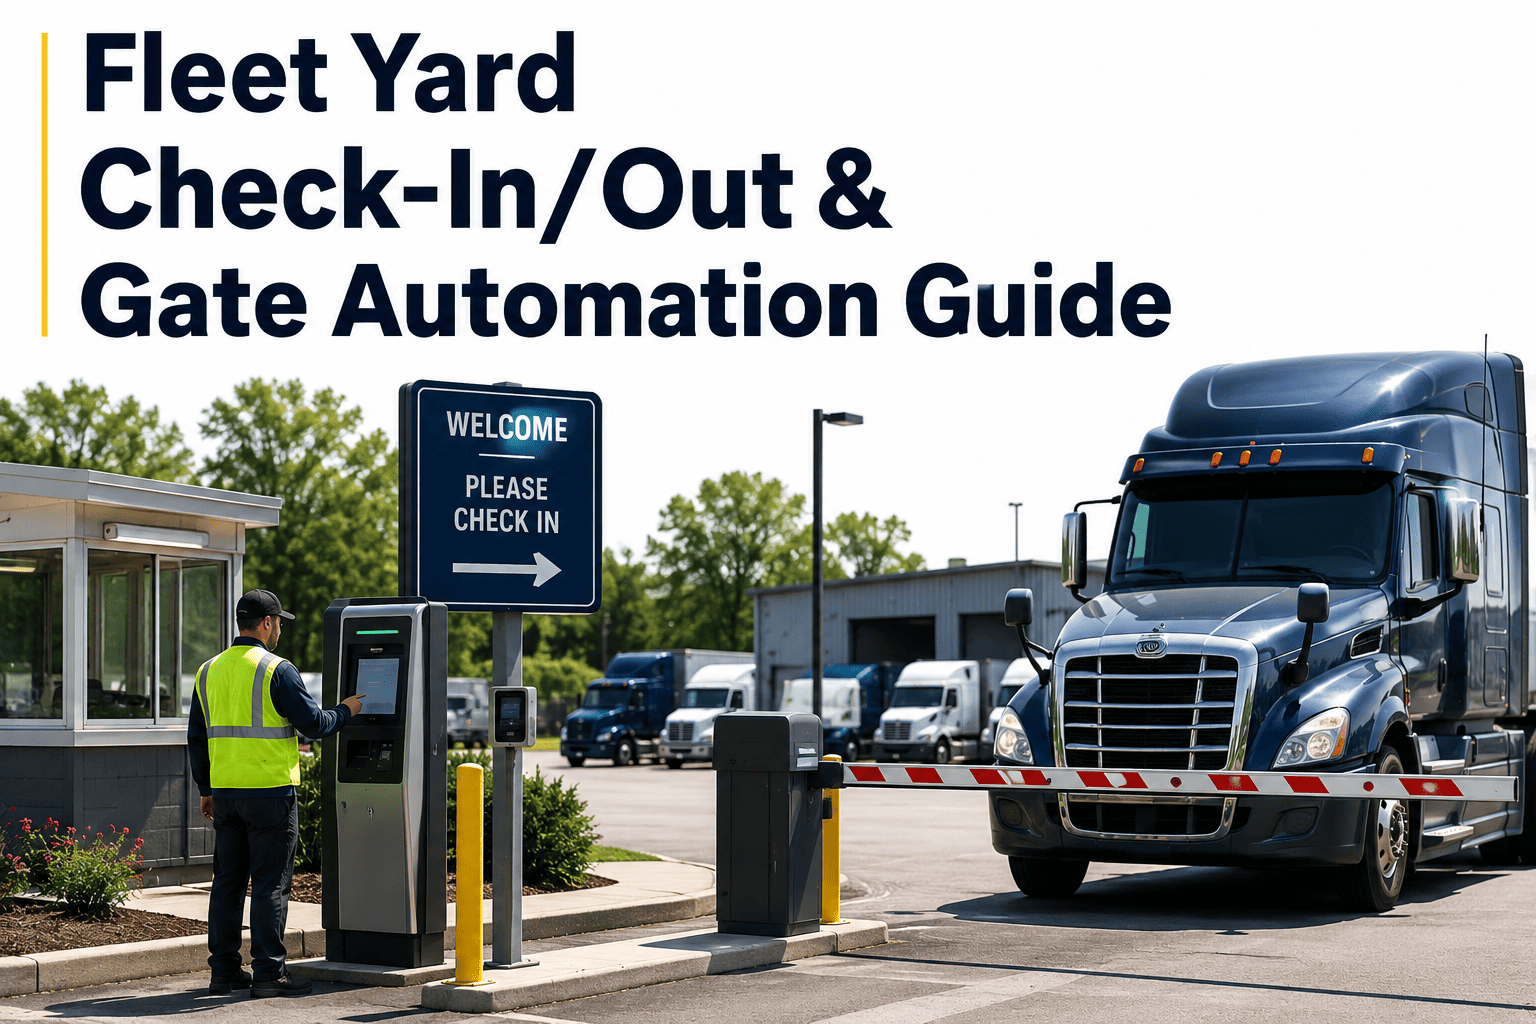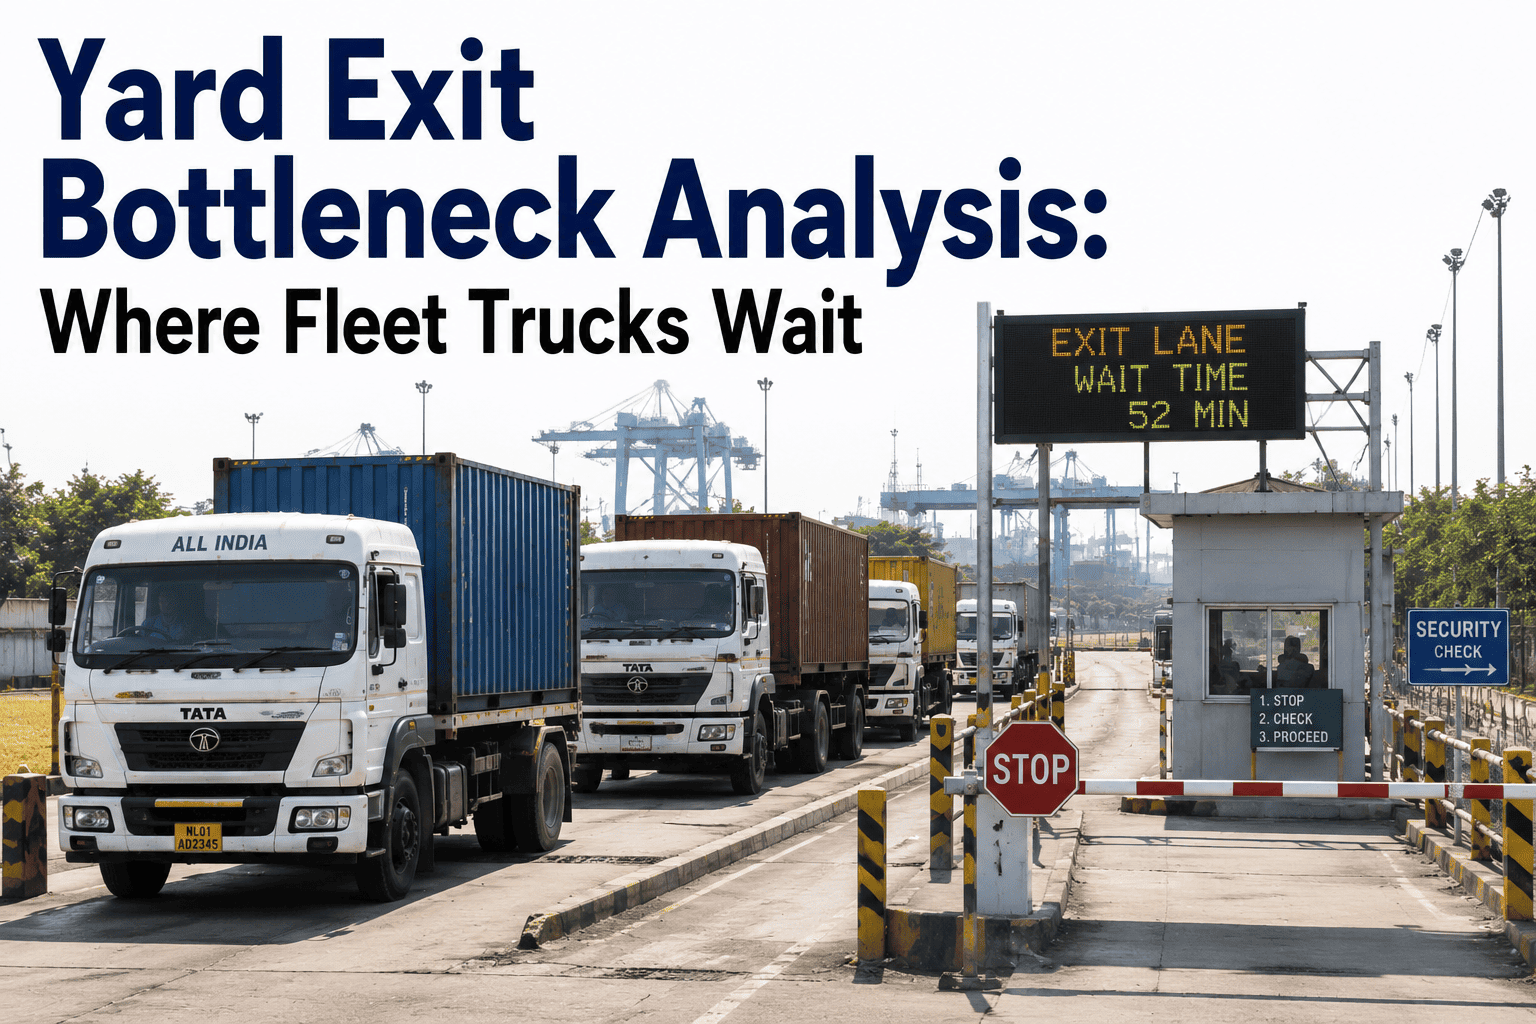
Ask a dispatcher why trucks aren't rolling out on schedule and the answer is almost always "the gate." It's the last thing anyone sees before a truck leaves, so it absorbs the blame for delays that actually started an hour earlier and thirty yards away. Fleets that map every checkpoint a truck passes through before reaching the exit routinely find the gate itself accounts for a small fraction of total dwell time — the rest is buried in inspection queues, paperwork handoffs, and staging congestion nobody is timing. Fixing the wrong checkpoint doesn't just fail to help; it burns budget while the real bottleneck keeps stacking trucks and pushing drivers past their hours. Most dispatch and maintenance teams have never had the data to tell one checkpoint from another, which is exactly the gap Oxmaint's checkpoint-level yard tracking closes.
The Six Hidden Checkpoints Where Trucks Actually Wait
A truck doesn't stall once between arrival and departure — it stalls in stages, and each stage has its own cause, its own owner, and its own fix. Treating "yard delay" as a single number hides which of the six checkpoints below is actually eating your fleet's clock. Fleets that break dwell time down by checkpoint stop guessing and start fixing the stage that is genuinely costing them the most, instead of pouring labor and budget into the one checkpoint everyone can see.
The six checkpoints below aren't unique to any one yard layout — every fleet operation runs trucks through some version of this sequence, whether it's a single regional yard or a multi-site distribution network. What changes site to site is which stage is currently the slowest, and that answer shifts by shift, by season, and by staffing level. Without checkpoint-level data, that shifting bottleneck stays invisible, and teams keep applying yesterday's fix to today's problem.
Driver ID, trailer number, and appointment window get verified before the truck is allowed past the fence line. Manual clipboard checks routinely take three to four times longer than a system that already knows the truck is expected, and every extra minute here pushes the entire chain of downstream checkpoints later.
Bills of lading, seals, and manifest data are cross-checked against what the system expects to see. Mismatched paperwork here creates a hold that can freeze a truck in place well before it reaches a dock or a lane, and it's one of the hardest delays to spot in a spreadsheet because the truck still looks like it's "in the yard" the whole time.
A spotter or driver has to find an open, correctly zoned spot. Without live yard visibility, this becomes a slow circuit around the property, and the truck sits in transit between stages instead of actually queuing anywhere useful. On larger sites this single stage can quietly account for more lost time than every other checkpoint combined.
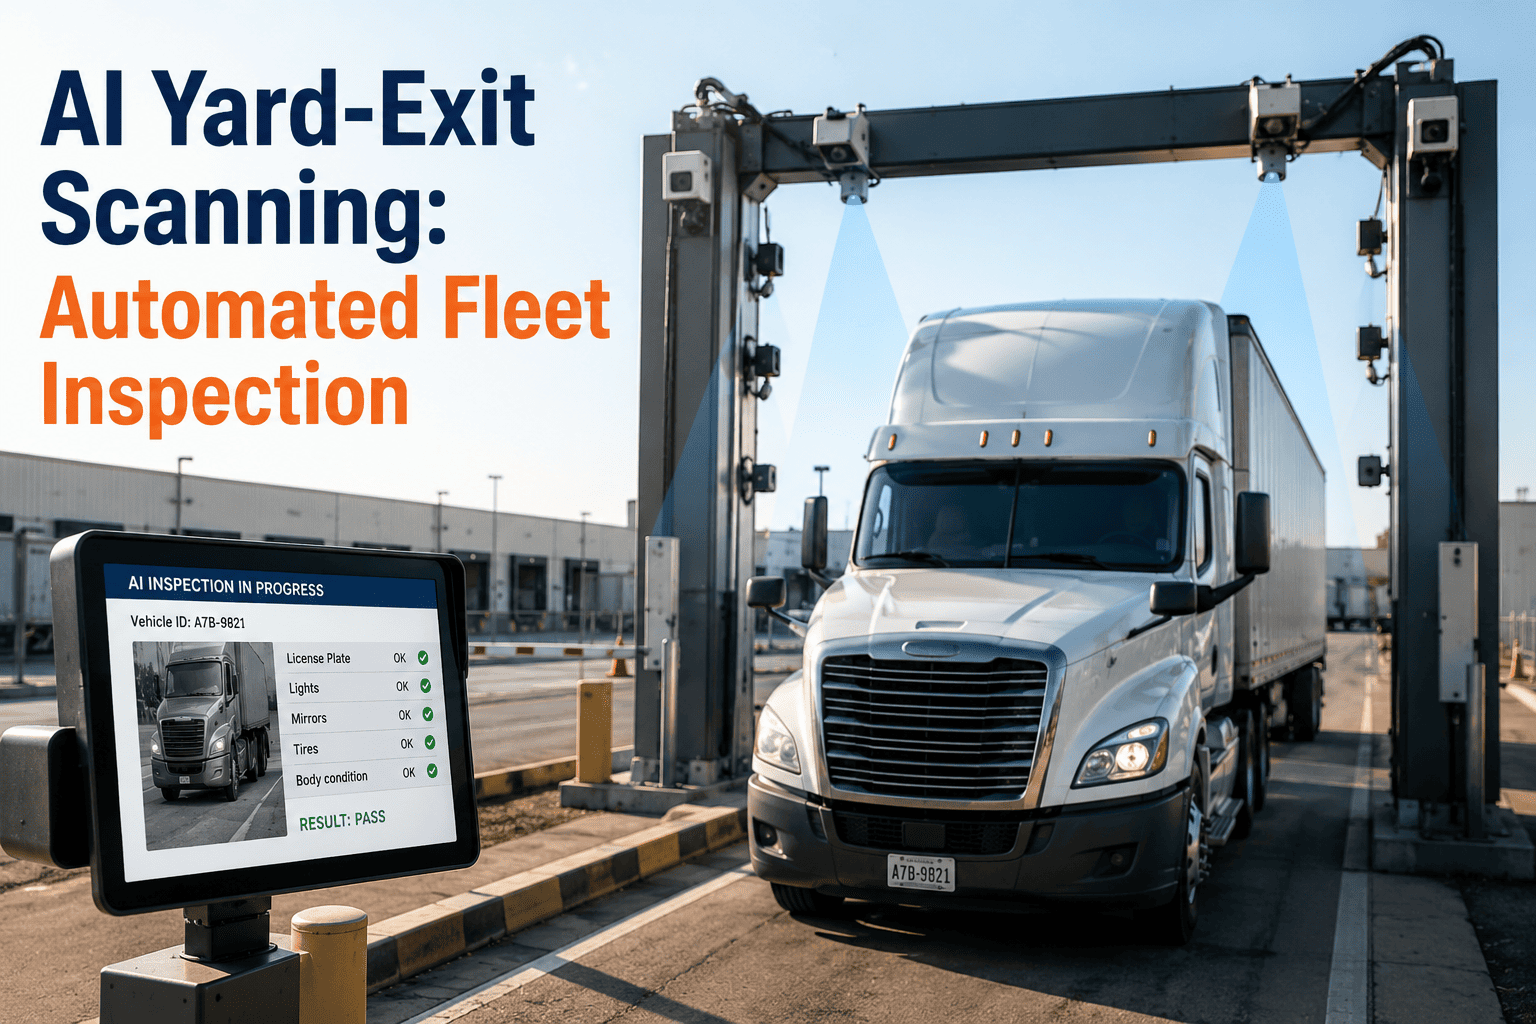
DVIR review, weight verification, or a flagged safety item pulls the truck out of the flow entirely. This checkpoint is the one most often skipped in delay reporting, even though it can hold a unit for an hour or more while a technician is located and a repair or sign-off is completed.
The truck is cleared but the assigned door is still occupied, or the appointment slot doesn't match what's actually available on the ground. This is where scheduling promises and yard reality most often diverge, and it's a common source of driver frustration since the delay happens after every other check has already passed.
Final paperwork, seal confirmation, and system closeout happen here. It's the checkpoint everyone watches, which is exactly why it gets blamed for delays that were already locked in five stages earlier, long before the truck ever pulled up to the exit lane.
One Slow Checkpoint Doesn't Stay Contained to One Truck
A ten-minute delay at staging doesn't just cost that one driver ten minutes. It pushes the next truck's arrival into a spot that isn't ready yet, delays the spotter who was scheduled to move a different trailer, and shifts the whole shift's dispatch window later by the time the tenth truck rolls through. By mid-afternoon, a bottleneck that started as a single slow checkpoint has rippled into a yard-wide backlog that looks, from the dispatch office, like everything is simply running behind.
This is why fixing the gate alone so rarely moves the needle. The gate is downstream of five other checkpoints, so speeding it up just shifts the queue back one stage instead of removing it. Real improvement comes from finding the checkpoint where trucks are actually accumulating first, and fixing that one before it has a chance to compound across the rest of the shift.
This compounding effect is also why fixes aimed at the wrong checkpoint can look successful for a few days and then quietly stop working. Speeding up gate-out frees up a little slack, trucks bunch up one stage earlier, and within a week the average turnaround time is right back where it started — except now the team believes the gate fix "didn't hold," when the real issue was never at the gate to begin with.
Time Lost, Root Cause, and the Fix — Checkpoint by Checkpoint
Once dwell time is split by checkpoint, the pattern usually looks nothing like what dispatch assumed. The table below reflects the typical distribution fleets find once they start timing every stage instead of just gate-in and gate-out — and it's worth noting the widest ranges cluster around the two checkpoints teams almost never track directly: staging and inspection holds.
| Checkpoint | Typical Time Lost | Root Cause | Fix That Works |
|---|---|---|---|
| Gate-In Check | 5–15 min | Manual ID and appointment lookup | Pre-populated arrival data, automated matching |
| Document Verification | 10–25 min | Paper BOL and seal mismatches | Digital manifest checks tied to the load record |
| Staging and Parking | 15–40 min | No live view of open, zoned spots | Real-time yard map with assigned staging lanes |
| Inspection and Safety Hold | 20–60 min | DVIR review and flagged items queue up | Digital inspection routing with priority flags |
| Dock or Door Wait | 15–45 min | Door occupied or appointment mismatch | Live door status synced to the appointment book |
| Gate-Out Clearance | 5–15 min | Final paperwork and seal confirmation | Automated closeout triggered by system status |
Stop Guessing Which Checkpoint Is Costing You Trucks
Oxmaint timestamps every checkpoint a vehicle clears, from gate-in to dock assignment to final exit, so your dispatch team can see exactly where minutes are disappearing instead of assuming it's always the gate.
Single-Point Gate Tracking vs. Full Checkpoint Mapping
Most yards already track one number — gate-in to gate-out. That number tells you a truck was slow, but never why. Mapping all six checkpoints turns a single vague metric into a diagnosis your team can actually act on, and it changes how quickly a problem gets caught: instead of waiting for a carrier complaint or a detention invoice, the slowdown shows up in the data the same shift it happens.
Checkpoint-Level Yard Intelligence Built Into Your CMMS
Every checkpoint from gate-in to gate-out logs its own timestamp automatically, so dwell time is broken down by stage instead of buried in one combined number your team has to reverse-engineer after the fact.
Spotters and drivers see open, correctly zoned spots in real time, cutting the slow circling that turns staging into an invisible bottleneck no report ever captured before.
DVIR items and safety holds route straight to the right technician with priority flags, so an inspection hold resolves in minutes instead of sitting in a queue nobody is actively watching.
Live door status feeds the appointment book directly, closing the gap between what dispatch promised a carrier and what the yard can actually deliver at the moment a truck rolls up.
When one checkpoint starts drifting slower over consecutive shifts, the system flags the trend before it becomes a full-blown pattern of missed dispatch windows and carrier complaints.
Compare checkpoint performance across shifts and locations to see whether a bottleneck is a process problem, a staffing problem, or a single site's layout issue that other yards don't share.
What Fleets See After Mapping Their Real Bottleneck
The numbers below aren't a promise that every yard hits the exact same figures — layout, volume, and staffing all matter. What's consistent across fleets that switch from gate-only tracking to full checkpoint mapping is the shape of the result: a fast, cheap fix to the actual slowest stage almost always beats a slow, expensive fix aimed at the gate.
See Your Own Six Checkpoints Mapped in a Live Demo
Walk through your gate-in, staging, inspection, and door-assignment data with a fleet specialist and find out which checkpoint is actually holding your trucks back.
Signs Your Real Bottleneck Isn't the Gate
Before you invest in faster gate hardware, check whether these patterns show up in your own yard. Each one points to a different checkpoint than the exit gate itself, and each has a specific, targeted fix rather than a general one. Recognizing the pattern is usually the fastest way to save budget, since it stops teams from spending on the wrong checkpoint before the data confirms where the real delay lives.
If drivers report circling or waiting well before they reach the exit lane, the bottleneck is almost always staging or dock assignment, not the gate transaction itself.
A bottleneck that only appears on certain shifts usually traces back to staffing gaps at inspection or document verification, not a structural gate problem.
Drivers rarely complain about a fast gate transaction. If complaints describe general waiting rather than a slow check-in specifically, the delay is happening somewhere else in the sequence entirely — most often staging or a door assignment mismatch.
Frequently Asked Questions
How do we find out which of the six checkpoints is actually causing our delays?
Timestamp every stage instead of just gate-in and gate-out. Once each checkpoint has its own duration, the slowest one is usually obvious within a single week of data. Start a free trial to begin capturing checkpoint data automatically.
Is checkpoint tracking different from a standard gate-only yard system?
Yes. A gate-only system gives one start and end time. Checkpoint mapping breaks that same journey into six measured stages, which is what actually tells you where to focus a fix instead of where a delay simply became visible.
Do we need new gate hardware to start mapping checkpoints?
No. Most fleets start with existing check-in, inspection, and dock-scheduling data and layer checkpoint tracking on top of what's already in place. Book a demo to see exactly what your current setup already supports.
What's a realistic wait-time reduction target once we start tracking checkpoints?
Fleets that fix their actual slowest checkpoint, rather than the gate by default, typically see wait time drop significantly within the first full reporting cycle, with staging and inspection fixes usually delivering the fastest visible gains.
How does Oxmaint connect checkpoint delays to maintenance work orders?
When an inspection hold flags a mechanical issue, it auto-generates a work order with the checkpoint timestamp attached, so delay data and repair history live in the same record. Start a free trial to see the workflow end to end.
Map Your Yard's Six Checkpoints and Get More Trucks on the Road
Stop fixing the gate when the real delay is three checkpoints earlier. Oxmaint gives dispatch and maintenance teams a shared, checkpoint-level view of every truck's path through the yard — free trial, no credit card required.