Fuel Efficiency Monitoring for Fleets: How AI Reduces Fuel Costs by 15%
By Matt Renshaw on March 19, 2026
Fuel is the single largest variable operating cost in commercial fleet management — averaging 35–40% of total operating expenses and entirely exposed to the behavioral, mechanical, and routing inefficiencies that accumulate invisibly across every vehicle and every shift. In 2026, the average commercial fleet wastes 12–18% of its fuel budget on preventable sources: excessive idling that burns diesel at $0.80–$1.20 per hour with zero productive output, aggressive acceleration and braking patterns that reduce fuel economy by 15–30% per vehicle, tire pressure variance that adds 0.5–3% fuel consumption per trip, and maintenance-deferred conditions like dirty fuel injectors or misaligned wheels that degrade MPG by 8–12% before any drivability symptom develops. AI-powered CMMS platforms like OxMaint address this by continuously reading telematics, driver behavior, and maintenance data against each vehicle's fuel baseline — surfacing waste sources weeks before they compound. This guide covers every major driver of fleet fuel waste and how idling reduction, driver behavior monitoring, tire pressure management, route efficiency, maintenance-related fuel loss, and fuel card analytics combine to deliver 15%+ fuel cost reduction at fleet scale.
Fleet Operations · Blog · 2026
Fuel Efficiency Monitoring for Fleets: How AI Reduces Fuel Costs by 15%
AI-powered fuel efficiency monitoring identifies every source of fleet fuel waste — excessive idling, aggressive driving, tire pressure variance, route inefficiency, and maintenance-related MPG loss — and delivers 15%+ fuel cost reduction through continuous vehicle-level analytics and automated intervention.
38%Of total fleet operating expenses consumed by fuel — the largest single variable cost
18%Average fleet fuel budget wasted on preventable idling, behavior, and maintenance sources
$0.94Per hour wasted on commercial vehicle idling — at zero productive output per vehicle
The 5 Sources of Fleet Fuel Waste — and Their Share of Your Budget
Fleet fuel waste is not distributed evenly — it clusters around five identifiable, measurable sources, each with a different monitoring approach and a different intervention timeline. Understanding which sources dominate your fuel waste profile determines where AI-powered fuel efficiency monitoring delivers the fastest return. Most fleets carry all five simultaneously, and most are unaware of the compound impact because no single source is large enough to be obvious in a summary fuel report — only vehicle-level, behavior-level analytics surface them clearly.
Excessive Idling
28%
Avg. commercial vehicle idles 1.2 hrs/day. At $0.94/hr per vehicle, a 50-truck fleet burns $21,000/yr in idle fuel alone.
Aggressive Driving
22%
Hard acceleration, speeding >75 mph, and late braking collectively reduce fuel economy 15–30% versus smooth operation.
Tire Pressure Variance
16%
Each 10 PSI under-inflation adds 0.5–1% fuel consumption. On a tandem axle truck with 18 tires, variance is rarely uniform.
Route Inefficiency
20%
Suboptimal routing, driver deviation, and traffic-driven idle add 8–14% extra miles per route. Every mile costs fuel.
Maintenance-Related MPG Loss
14%
Dirty injectors, air filter restriction, wheel misalignment, and oil degradation degrade MPG 8–12% before any symptom is visible.
Excessive Idling: The Most Visible — and Most Fixable — Fuel Waste Source
Excessive idling is the highest-ROI target in fleet fuel efficiency monitoring because it is measurable in real time, addressable through both policy and technology, and generates zero operational value. A commercial diesel engine burns approximately 0.8–1.0 gallons per hour at idle — meaning a driver who idles 45 minutes during lunch, 20 minutes at loading docks, and 15 minutes pre-trip is burning $1.50–$2.00 in fuel before turning a revenue mile. Across a 40-vehicle fleet, an average idle time of 1.2 hours per vehicle per day generates $21,000–$35,000 in annual idle fuel cost. AI monitoring identifies idle events by vehicle, driver, location, and time pattern — converting an invisible aggregate cost into an actionable per-driver, per-route report that fleet managers can respond to within the same operating day.
Idling Cost Calculator — 40-Vehicle Fleet at $4.20/gal Diesel
Daily Idle / Vehicle
Monthly Cost
Annual Cost
Reduction Potential
30 min low idle fleet
$2,520
$30,240
$9,072 at 30% cut
1.2 hrs fleet average
$8,064
$96,768
$29,030 at 30% cut
2.5 hrs high idle fleet
$16,800
$201,600
$60,480 at 30% cut
AI idle monitoring identifies idle events by driver, location, and time pattern — enabling targeted coaching and policy intervention within the same operating day
Driver Behavior Monitoring: Speed, Acceleration, and Braking Profiles
Driver behavior is the second-largest controllable fuel waste source — and the one with the widest variance across a fleet. Two drivers operating identical vehicles on identical routes will achieve fuel economies that differ by 15–25% based purely on throttle management, braking behavior, and speed discipline. AI-powered fleet fuel management platforms build a behavioral fuel efficiency score per driver by normalizing fuel consumption against load weight, route elevation, traffic conditions, and ambient temperature — isolating the driver-attributable component of MPG from factors outside their control. This vehicle-specific, route-normalized scoring converts a summary MPG report into a driver coaching tool that identifies exactly which behaviors are costing fuel and by how much.
Hard Acceleration
+12–18% fuel use
Rapid throttle application demands peak injector output. Smooth acceleration to cruising speed uses 40% less fuel than aggressive departure.
Speeding (>75 mph)
+20–30% fuel use
Aerodynamic drag increases exponentially above 65 mph. Each 5 mph above 75 costs approximately 7% additional fuel on a Class 8 vehicle.
Late Braking
+8–14% fuel use
Hard braking wastes kinetic energy that required fuel to build. AI identifies late-braking patterns per route segment and driver.
Gear / RPM Management
+6–10% fuel use
Operating at high RPM in lower gear burns significantly more fuel. AI cruise band monitoring identifies out-of-band operation per trip.
Tire Pressure and Rolling Resistance: The Silent Fuel Drain
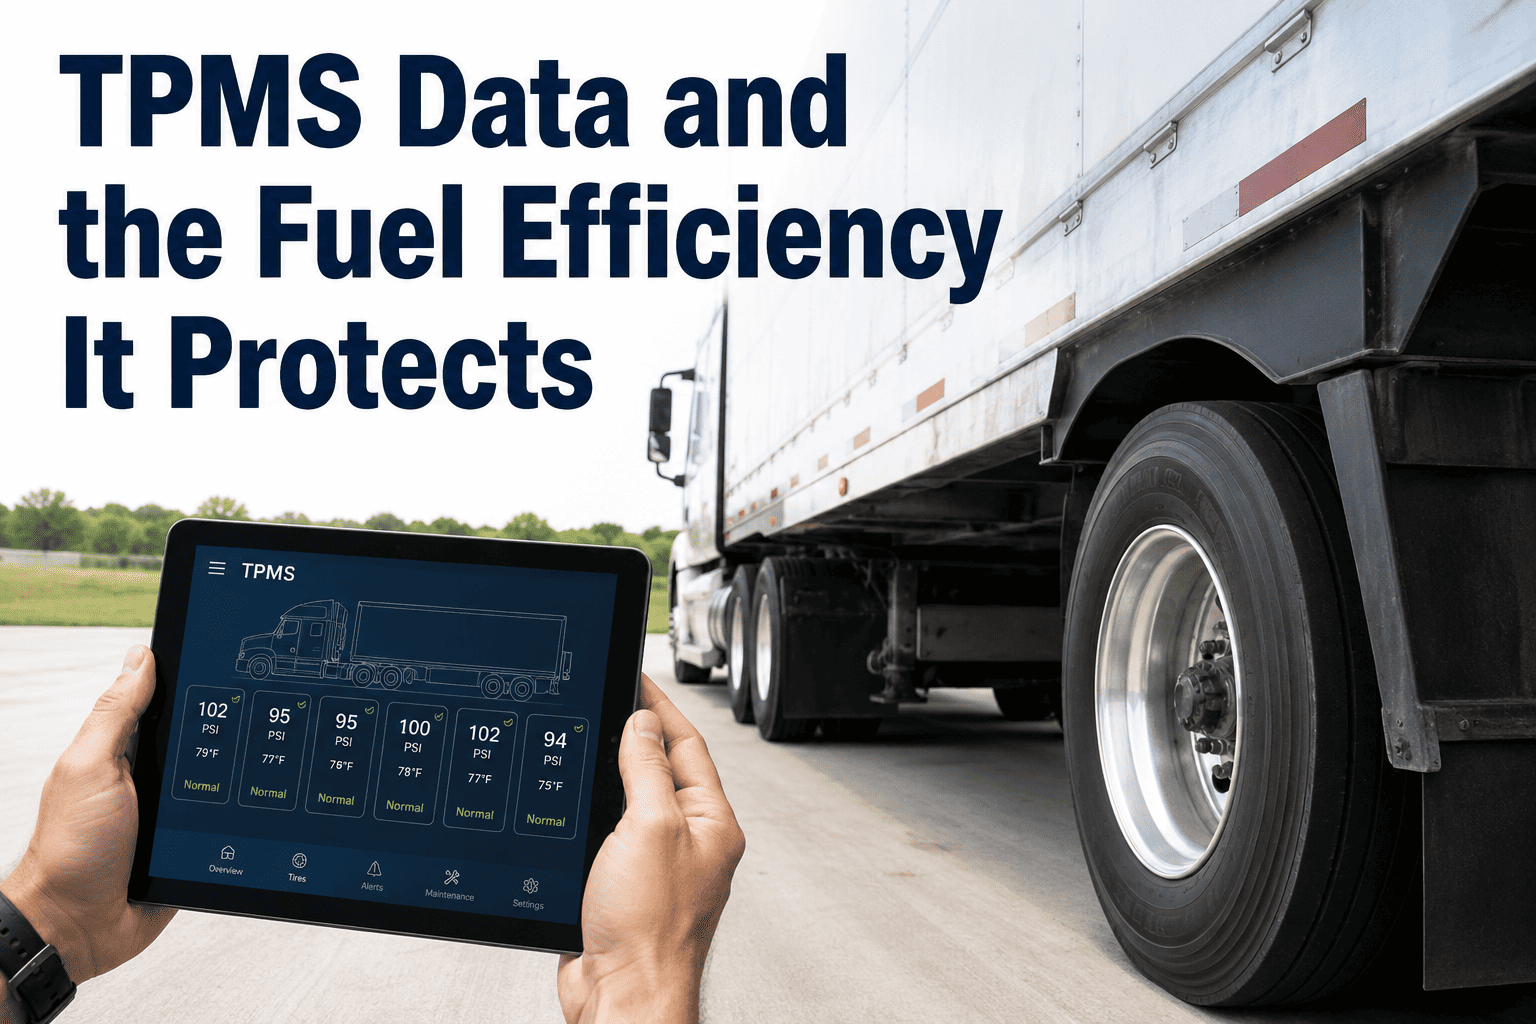
Tire pressure is one of the most undermonitored fuel variables in commercial fleet operations — and one of the most impactful at scale. Every 10 PSI of under-inflation increases rolling resistance and adds approximately 0.5–1% to fuel consumption. On a Class 8 tractor-trailer with 18 tires, a systematic under-inflation of 15 PSI across all tires adds 1.5–2.7% to the fuel bill for every mile that vehicle operates. Across a 100-vehicle fleet operating 100,000 miles per year per vehicle, that variance translates to $85,000–$150,000 in additional annual fuel cost. CMMS-integrated TPMS monitoring tracks pressure per axle per vehicle, generates maintenance alerts when pressure falls below threshold, and logs tire service history against subsequent fuel efficiency — closing the loop between tire maintenance compliance and fuel cost outcomes.
Tire Pressure Variance — Fuel Cost Impact Per Vehicle (100K miles/yr at $4.20/gal)
Pressure Variance
MPG Impact
Extra Fuel/Year
Annual Cost Added
5 PSI under
−0.3% MPG
+120 gal
+$504
10 PSI under
−0.75% MPG
+300 gal
+$1,260
15 PSI under (all tires)
−2.1% MPG
+840 gal
+$3,528
20 PSI under (all tires)
−3.0% MPG
+1,200 gal
+$5,040
On a 100-vehicle fleet, systematic 15 PSI under-inflation across all vehicles costs $352,800/yr in excess fuel — detectable and addressable with automated TPMS integration
Route Efficiency and Fuel Optimization
Route inefficiency contributes 8–14% in excess miles per route in fleets that rely on driver discretion for routing decisions — adding direct fuel cost, increased idling from traffic exposure, and additional vehicle wear. AI route optimization analyzes historical GPS data, fuel consumption per segment, traffic pattern timing, and delivery sequence to calculate the minimum-fuel path — not just the minimum-distance path. The distinction matters because minimum distance and minimum fuel are not always the same: a slightly longer route that avoids high-traffic corridors, eliminates left turns at uncontrolled intersections, and maintains highway speed rather than urban stop-and-go will consume less fuel despite more miles. Integrated fleet fuel management software feeds route performance data back into the CMMS — correlating route choice with fuel outcomes and surfacing the highest-waste route-driver combinations for targeted intervention.
GPS Segment Fuel Analysis
Fuel consumption mapped per route segment — identifies recurring high-waste corridors, congestion idling zones, and suboptimal departure time windows.
Driver Deviation Tracking
AI compares actual GPS path against optimized route — quantifying fuel cost of deviations and attributing excess mileage to specific drivers and routes.
Load-Adjusted Route Scoring
Routes scored against load weight and vehicle type — heavier loads change optimal routing parameters. AI adjusts efficiency benchmarks per trip.
Traffic-Aware Dispatch Timing
AI dispatch recommendations account for peak traffic timing — shifting departure windows to avoid stop-and-go corridors reduces idle and improves fuel economy 4–8%.
Maintenance-Related Fuel Loss: The Hidden MPG Drain
Maintenance-deferred conditions degrade fuel economy silently — no dashboard warning, no drivability complaint, just a gradual MPG decline that blends into fleet-average variance until a vehicle is 10–15% below its baseline. The five highest-impact maintenance conditions for fuel economy are dirty fuel injectors (−4–8% MPG), restricted air filters (−3–6%), degraded engine oil viscosity (−2–4%), wheel misalignment (−3–5%), and exhaust backpressure from a clogged DPF (−6–12% on diesel vehicles). AI-powered CMMS fuel analytics detect these conditions by tracking each vehicle's fuel consumption against its own baseline at equivalent load and speed — flagging anomalous MPG decline and generating a maintenance work order before the mechanical condition worsens or produces any detectable symptom.
Fuel Injector Fouling
Develops over 30,000–50,000 miles. Causes incomplete combustion and rich running. AI detects as route-normalized MPG decline before misfire codes appear.
−4–8% MPG
Air Filter Restriction
Restricted airflow forces the engine to work harder for equivalent power output. High-mileage vehicles in dusty operating environments degrade 30–40% faster than average.
−3–6% MPG
Wheel Misalignment
Toe-out misalignment increases rolling resistance and tire scrub. Common after curb strikes or pothole impacts — not detectable without wheel measurement.
−3–5% MPG
DPF / Exhaust Restriction
A partially clogged diesel particulate filter increases exhaust backpressure and forces active regeneration cycles — both burning additional fuel per mile.
−6–12% MPG
Oil Viscosity Degradation
Overdue oil changes increase internal friction throughout the drivetrain. Low-viscosity synthetic oil change intervals produce 2–4% better fuel economy vs. degraded conventional oil.
−2–4% MPG
AC Compressor Load
A failing AC compressor with refrigerant loss cycles on/off erratically — increasing parasitic engine load and creating irregular fuel consumption signatures detectable by AI.
−1–3% MPG
Fuel Card Integration and CMMS Fuel Analytics
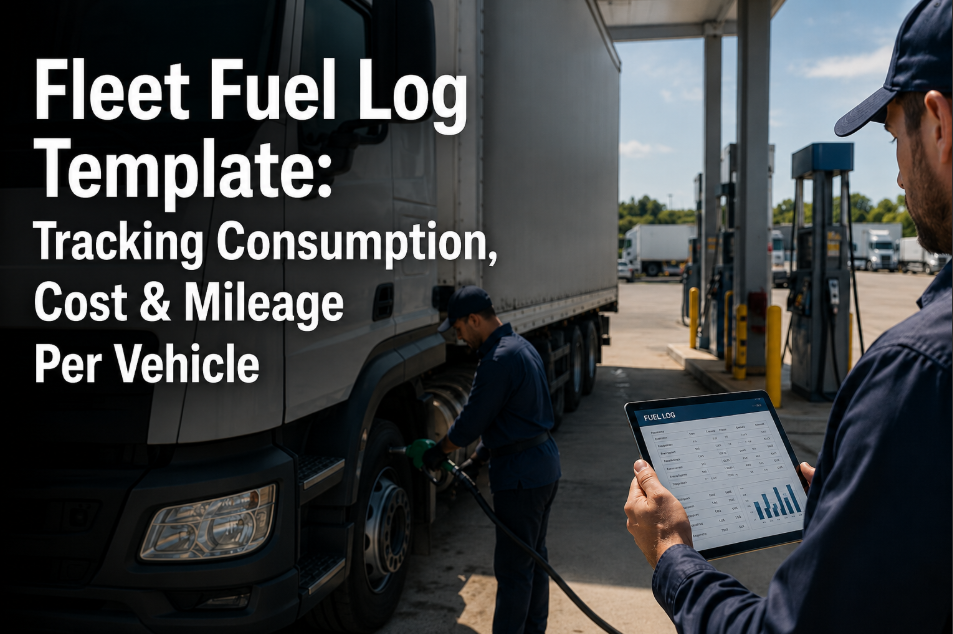
Fuel card data is one of the most underutilized analytics assets in fleet operations. Every fuel card transaction records date, time, location, odometer, gallons dispensed, and product type — creating a continuous, per-vehicle fuel consumption record that, when integrated with telematics and maintenance data in a CMMS, enables analysis that neither system can perform in isolation. Fuel card integration with OxMaint's CMMS fuel analytics automatically calculates real-world MPG per vehicle per fill-up, flags anomalous transactions (fueling volume inconsistent with odometer reading, fueling location inconsistent with route, fill-up frequency inconsistent with tank capacity), and correlates fuel economy trends with maintenance event history — attributing MPG changes to specific mechanical interventions or behavioral shifts.
Per-Vehicle MPG Tracking
Real MPG calculated per fill-up from odometer and gallons dispensed. Baseline deviation flagged automatically when MPG drops 5%+ from vehicle history.
Anomalous Transaction Flags
Fill volume inconsistent with tank capacity, fueling location off-route, or fill frequency inconsistent with consumption rate — all flagged automatically for review.
Maintenance-Fuel Correlation
MPG trend overlaid with maintenance event history — quantifies fuel economy impact of specific repairs and surfaces vehicles where maintenance is driving fuel waste.
Driver Fuel Efficiency Ranking
Fleet-wide driver ranking by load-normalized MPG. Lowest performers identified for coaching. Highest performers identified for behavior pattern sharing.
Fleet-Wide Fuel Budget Forecasting
AI projects monthly fuel spend per vehicle based on current consumption trends, seasonal factors, and scheduled maintenance — enabling accurate budget planning 60–90 days forward.
Idle Time vs. Fuel Cost Report
Idle hours mapped against fuel cost per driver per week — surfacing highest-cost idling individuals and locations for targeted policy enforcement and coaching intervention.
Start Measuring Every Source of Fuel Waste in Your Fleet
OxMaint's AI fuel efficiency monitoring connects telematics, fuel card data, and maintenance records into a unified platform — identifying idling waste, driver behavior costs, tire pressure variance, route inefficiency, and maintenance-related MPG loss in a single dashboard. Free to start. No new hardware required.
Idling reduction alone at average fleet size typically covers annual platform cost within the first operating quarter.
25%
Fuel economy improvement achievable through driver behavior coaching alone
Route-normalized driver scoring makes behavior coaching precise — targeting specific habits rather than generic instruction.
2–4 mo
Typical payback period — fuel savings usually exceed platform cost in Q1
For fleets spending $500K+ annually on fuel, a 10% reduction covers most CMMS subscription costs within 60 days.
Frequently Asked Questions
How does AI-powered fuel efficiency monitoring actually work in a fleet?
AI fuel efficiency monitoring works by integrating telematics data (GPS, vehicle speed, engine load, RPM, idle events), fuel card transaction records, and maintenance history into a unified per-vehicle dataset. Machine learning models establish a fuel consumption baseline for each vehicle at equivalent load, route type, ambient temperature, and speed profile. Deviations from that baseline — whether from driver behavior, mechanical degradation, or routing inefficiency — are detected automatically and attributed to their source. The key distinction from traditional fuel reports is the vehicle-specific, condition-normalized baseline: fleet-average MPG reports mask the per-vehicle waste that AI monitoring surfaces directly. When a specific vehicle's fuel consumption rises 7% above its own baseline on comparable routes, OxMaint generates an alert and work order — not a summary metric that buries the signal in fleet-wide averages. Sign up for OxMaint free to connect your telematics and fuel card data today.
What fuel savings are realistic for a 30–50 vehicle fleet in the first year?
For a 30–50 vehicle fleet, documented first-year fuel savings typically break down as follows: idling reduction of 25–35% yields $15,000–$40,000 depending on current idle time; driver behavior improvement through coaching yields 10–18% MPG improvement on affected drivers, typically worth $20,000–$50,000 at fleet scale; maintenance-related MPG recovery from fixing degraded conditions yields 4–8% improvement on vehicles with deferred service, worth $8,000–$20,000. Tire pressure compliance adds 1–2%, worth $3,000–$8,000. Combined, a realistic first-year fuel saving target for a 40-vehicle fleet spending $600,000/year on fuel is $75,000–$110,000 — a 12–18% reduction — with payback on the platform cost within 60–90 days of deployment. Book a demo for a fleet-specific savings estimate based on your fuel spend and current telematics data.
Does fuel efficiency monitoring require new hardware or telematics devices?
No new hardware is required for most fleets. OxMaint integrates with existing telematics providers — if your vehicles already have GPS or ELD devices transmitting data, that data stream is sufficient for AI fuel efficiency analysis. Fuel card integration connects via API to most major fleet card programs. The only additional data source that may require setup is TPMS sensor integration for tire pressure monitoring, which some vehicle models support natively through the OBD-II port. For fleets without active telematics, OxMaint can recommend lightweight plug-in OBD-II data loggers that require no installation beyond the diagnostic port — costing under $30 per vehicle. The operational deployment timeline for most fleets is 1–2 weeks from data connection to first actionable fuel efficiency report. Sign up free to begin the integration assessment.
How is fuel efficiency monitoring different from standard fleet telematics reporting?
Standard telematics reports surface raw data — speed, idle time, GPS location, engine hours — without connecting that data to fuel cost outcomes. Fleet efficiency monitoring goes further by attributing every measurable variable to its fuel cost impact. An idle event report tells you a driver idled for 45 minutes. A fuel efficiency monitoring platform tells you that 45-minute idle cost $0.71, that this driver averages 1.8 hours of daily idling, that their weekly idle fuel cost is $12.60, and that they rank in the bottom 15% of your fleet on this metric. The same logic applies to behavior, routing, and maintenance — raw telematics data becomes dollar-attributed actionable intelligence rather than a usage log. OxMaint's CMMS fuel analytics layer cost attribution on top of telematics data to make every report immediately actionable by fleet managers and dispatchers.
Your Fleet Is Burning 15–18% of Its Fuel Budget Unnecessarily. OxMaint Fixes That.
OxMaint's AI fuel efficiency monitoring integrates telematics, fuel card data, and CMMS maintenance records to identify every source of fleet fuel waste — idling, behavior, tires, routing, and maintenance degradation — and deliver actionable intervention within 24 hours of detection. Free to start. No hardware required. Join 1,000+ fleets running AI-powered fuel management with OxMaint.



-for-commercial-fleets.png)

