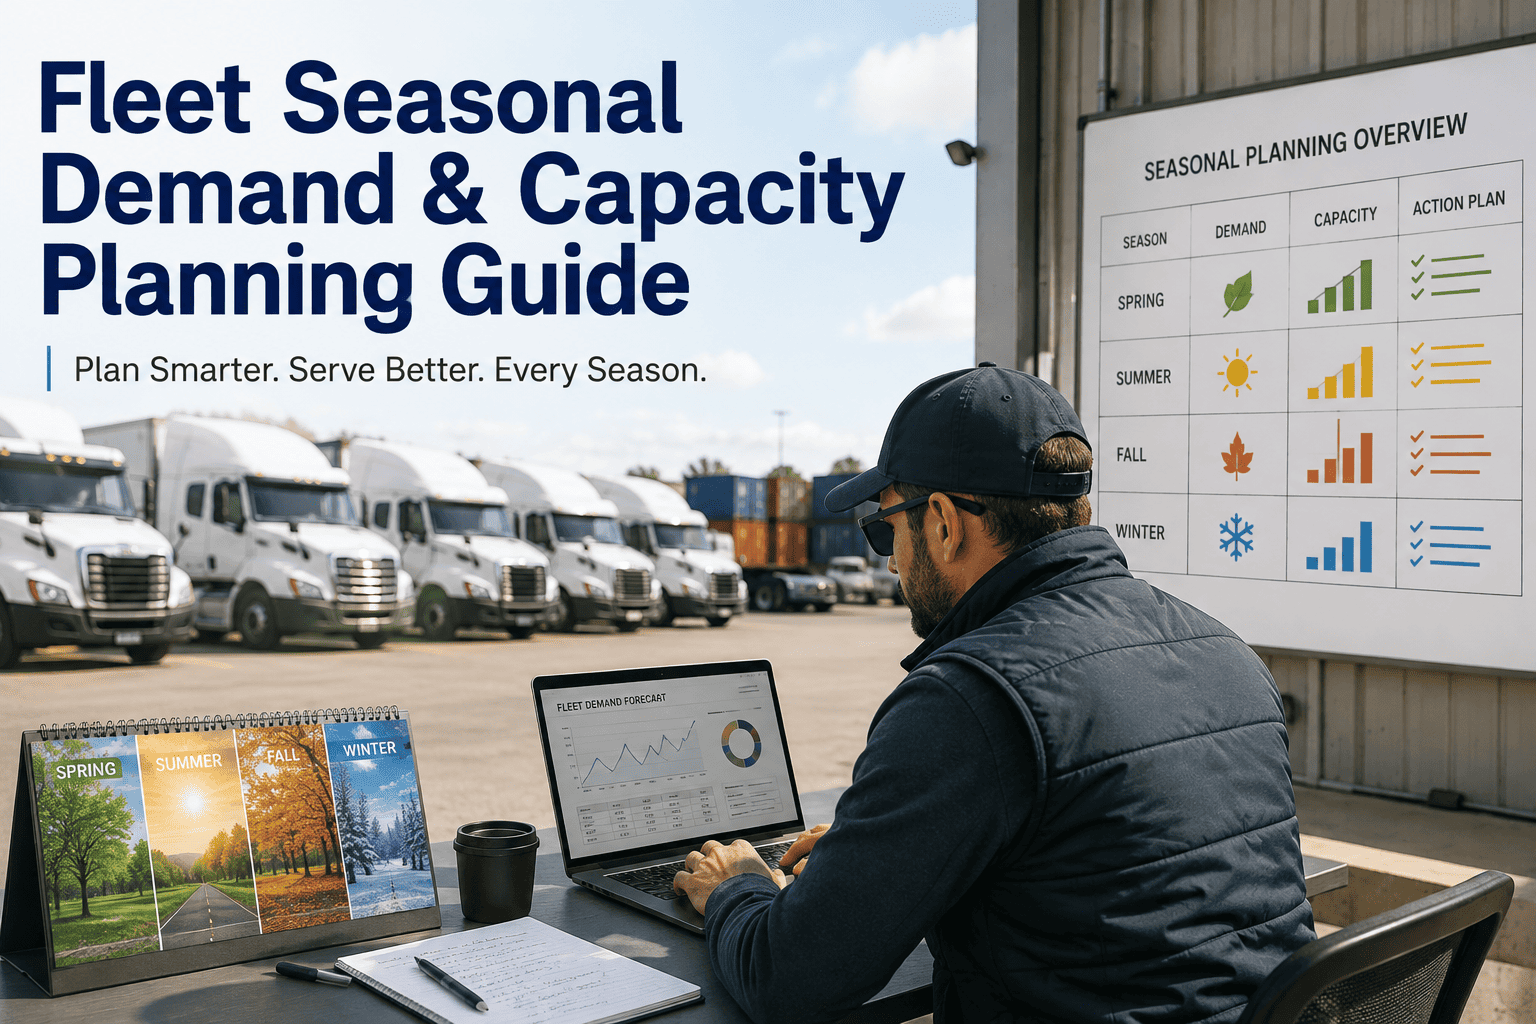
Peak season does not send a fleet manager a calendar invite before it arrives. Order volumes climb, service windows tighten, and the same vehicles that sat half idle in the slow months are suddenly expected to run flat out for weeks at a stretch. Most fleets discover the gap the hard way, when a truck breaks down mid-surge, a route falls behind schedule, or every rental yard within driving distance is already empty. The real problem is rarely a lack of forecasting data. It is a capacity plan built around average demand instead of the shape of the season itself. OxMaint helps fleet operations teams turn that seasonal curve into a working capacity plan long before the busy months start, so growth in demand does not automatically mean a spike in breakdowns and missed service windows. Sign up to map your own fleet's seasonal pattern against a properly flexed capacity plan.
Fleet Seasonal Demand and Capacity Planning: Build a Fleet That Flexes Instead of One That Breaks
OxMaint helps fleet operations leaders forecast seasonal demand, model core-plus-flex capacity, and time preventive maintenance around peak months, so the fleet is ready before the surge instead of scrambling during it.
The Pattern Every Fleet Sees but Few Plan Around
Seasonal demand is not a surprise. Delivery fleets know Q4 is heavier, construction fleets know spring and summer bring the workload, agricultural fleets know harvest compresses everything into a few critical weeks, and HVAC and landscaping fleets know summer and early spring stretch every truck they own. The pattern repeats every year, yet most fleets still size their vehicles, their maintenance calendar, and their driver rosters around the twelve-month average rather than the months that actually matter.
Static Capacity Planning Almost Always Loses to the Season
A static plan locks in one number of vehicles months ahead and holds it fixed for the year. Set that number for the peak and the fleet carries expensive idle capacity for most of the calendar. Set it for the average and the fleet falls short the moment demand actually spikes. Either way, a fixed commitment cannot track a demand curve that genuinely rises and falls by week and by lane. A capacity-aware model does the opposite: it treats the forecast as a living signal and flexes a mix of owned, leased, and rented capacity to match it as the season actually unfolds.
One fleet size is committed months in advance based on a rough seasonal estimate. Vehicles are either idle for most of the year or stretched thin the moment a real surge hits, and preventive maintenance gets pushed back because there is no slack to pull a unit out of service.
A core fleet covers steady year-round demand, short-term leasing absorbs predictable seasonal increases, and rental or partner capacity handles the overflow at the very top of the curve. Maintenance windows are scheduled into the slow months on purpose, protecting uptime for when it is worth the most.
See Where Your Fleet Actually Sits on the Demand Curve
OxMaint pulls together utilization history, maintenance status, and seasonal patterns into one view, so capacity decisions are based on data rather than last year's guesswork.
Seasonal Capacity Works Across Three Time Horizons at Once
Fleets that manage seasonal demand well are not running one plan, they are running three that talk to each other. Short-term decisions keep today's routes covered, medium-term decisions get the fleet ready for the season three to six months out, and long-term decisions make sure the fleet's composition still makes sense a year or two from now.
Live utilization tracking, driver availability, and maintenance windows drive the day-to-day dispatch decisions that keep routes covered without overloading any single vehicle.
Seasonal demand modeling, scheduled preventive maintenance volume, and rental or lease commitments get locked in here, usually sixty to ninety days ahead of the season's start.
Vehicle replacement forecasting, fleet composition, and growth capital planning happen at this level, catching capacity mismatches early enough to fix before they become a crisis.
A Practical Split: Own the Baseline, Flex the Peak
Fleets that consistently ride out seasonal swings without either overspending or falling behind tend to follow a version of the same split. It is not a rigid formula, but it is a useful starting point for any fleet trying to move away from an all-or-nothing ownership model.
The same logic applies to maintenance scheduling. The preventive work completed during the slower quarter is what protects uptime during the quarter when a single breakdown costs the most, both in lost revenue and in the price of emergency replacement capacity.
What Changes When Seasonal Capacity Is Actually Planned
| Dimension | Reactive Approach | Planned Seasonal Capacity |
|---|---|---|
| Vehicle Sourcing | Last-minute rentals booked once demand is already visible | Leases and rentals pre-booked sixty to ninety days ahead of the season |
| Maintenance Timing | Deferred whenever the fleet is busy, then handled as emergencies | Concentrated in slow months, freeing the peak for uptime |
| Cost Structure | Premium spot rates and rush fees during the exact weeks demand peaks | Negotiated seasonal rates locked in well before urgency sets in |
| Driver Planning | Overtime and last-minute hiring once schedules are already strained | Cross-trained staff and seasonal hires planned against the forecast |
| Risk Exposure | Breakdowns during peak weeks, when a lost day costs the most | Planned unavailability that dispatch can route around in advance |
The Metrics That Show a Seasonal Plan Is Holding Up
A seasonal capacity plan is only as good as the numbers that confirm it is doing its job. These are the indicators worth tracking through every peak and every trough.
Fleet Seasonal Demand and Capacity Planning — Common Questions
Most fleets need sixty to ninety days of lead time to secure leased or rented vehicles at reasonable rates and to finish preventive maintenance before demand climbs. Waiting until the surge is already visible usually means paying premium rates for whatever capacity is left. Book a demo to build a seasonal timeline around your own peak dates.
Demand forecasting predicts how much work is coming, based on historical data, seasonality, and market signals. Capacity planning takes that forecast and decides how many vehicles, drivers, and maintenance hours are needed to meet it without carrying unnecessary excess. Sign up to connect your utilization data to a working demand forecast.
Rarely. Owning enough vehicles to cover the single busiest month of the year usually means thirty to forty percent of the fleet sits idle the rest of the time. A core fleet covering baseline demand, backed by leased or rented capacity for the seasonal increase, is generally the more cost-effective approach.
Maintenance completed during the slower months protects uptime during the season when a breakdown is most expensive, both in lost revenue and in the cost of emergency replacement capacity. A CMMS that schedules PM around the seasonal calendar, rather than a fixed date, keeps more vehicles road-ready when demand peaks. Sign up to schedule maintenance around your seasonal calendar.
Two to three years of historical utilization data, sales or order volume trends, and known calendar events specific to the industry all sharpen a seasonal forecast far more than a single prior year of numbers. Weather patterns and regional events can also meaningfully shift the timing of a surge. Book a demo to see how your own historical data maps to a seasonal forecast.
The Fleets That Handle Peak Season Well Are Rarely the Ones Scrambling for Trucks
OxMaint brings seasonal forecasting, core-flex capacity modeling, and maintenance scheduling together, so the fleet is ready weeks before the surge instead of reacting once it has already arrived.