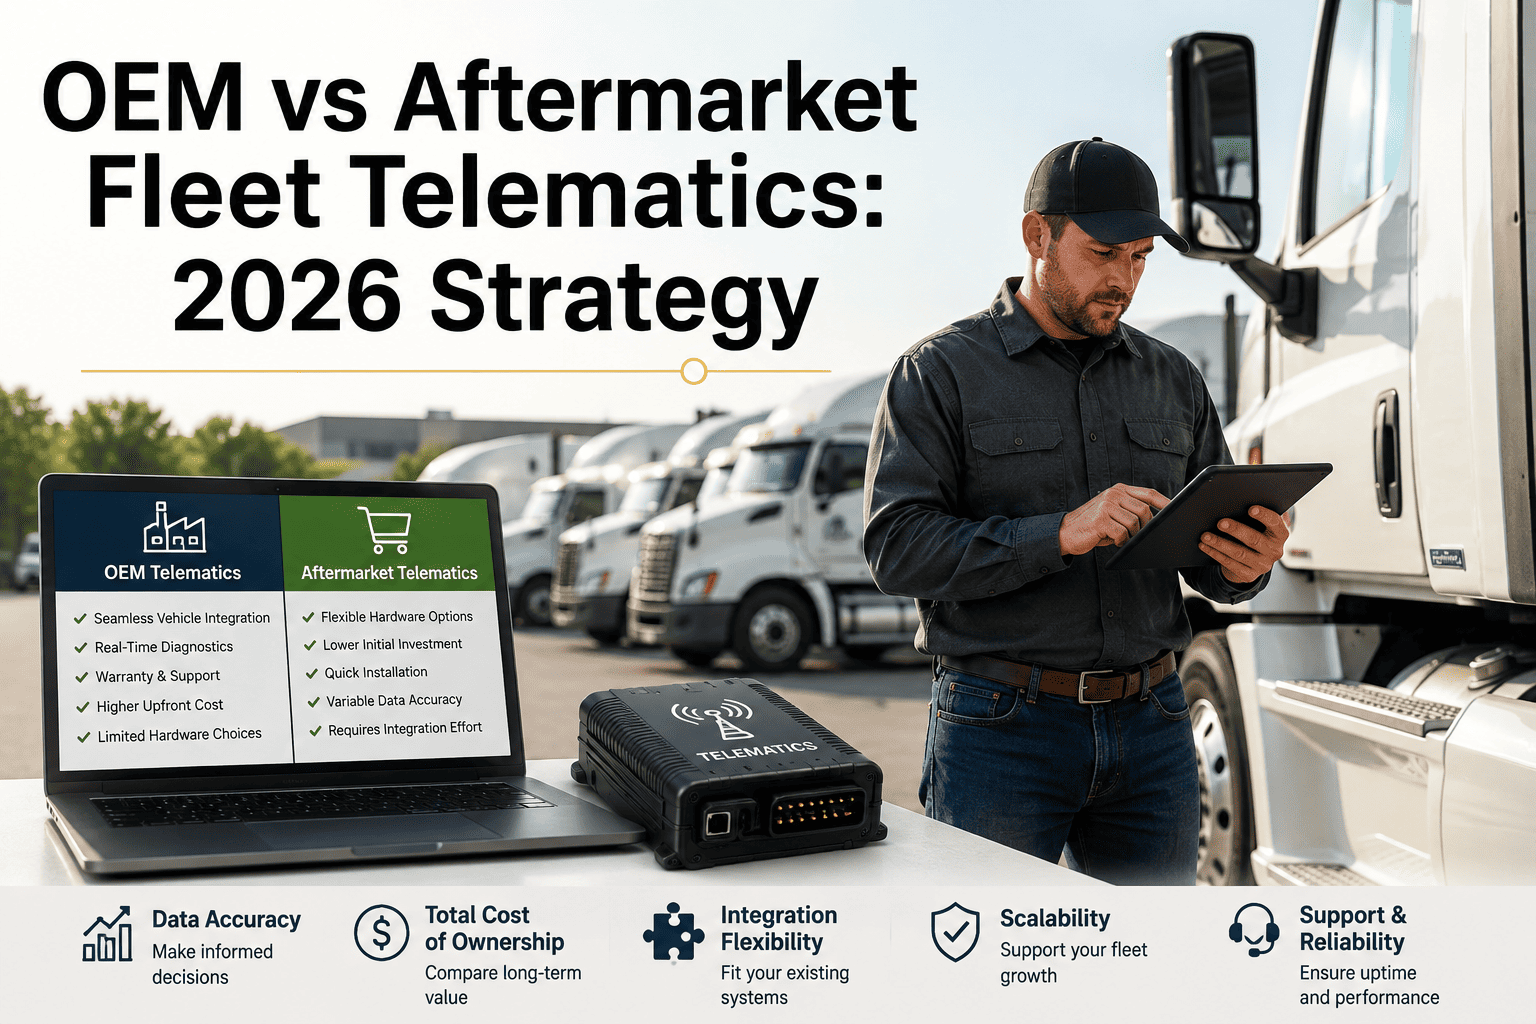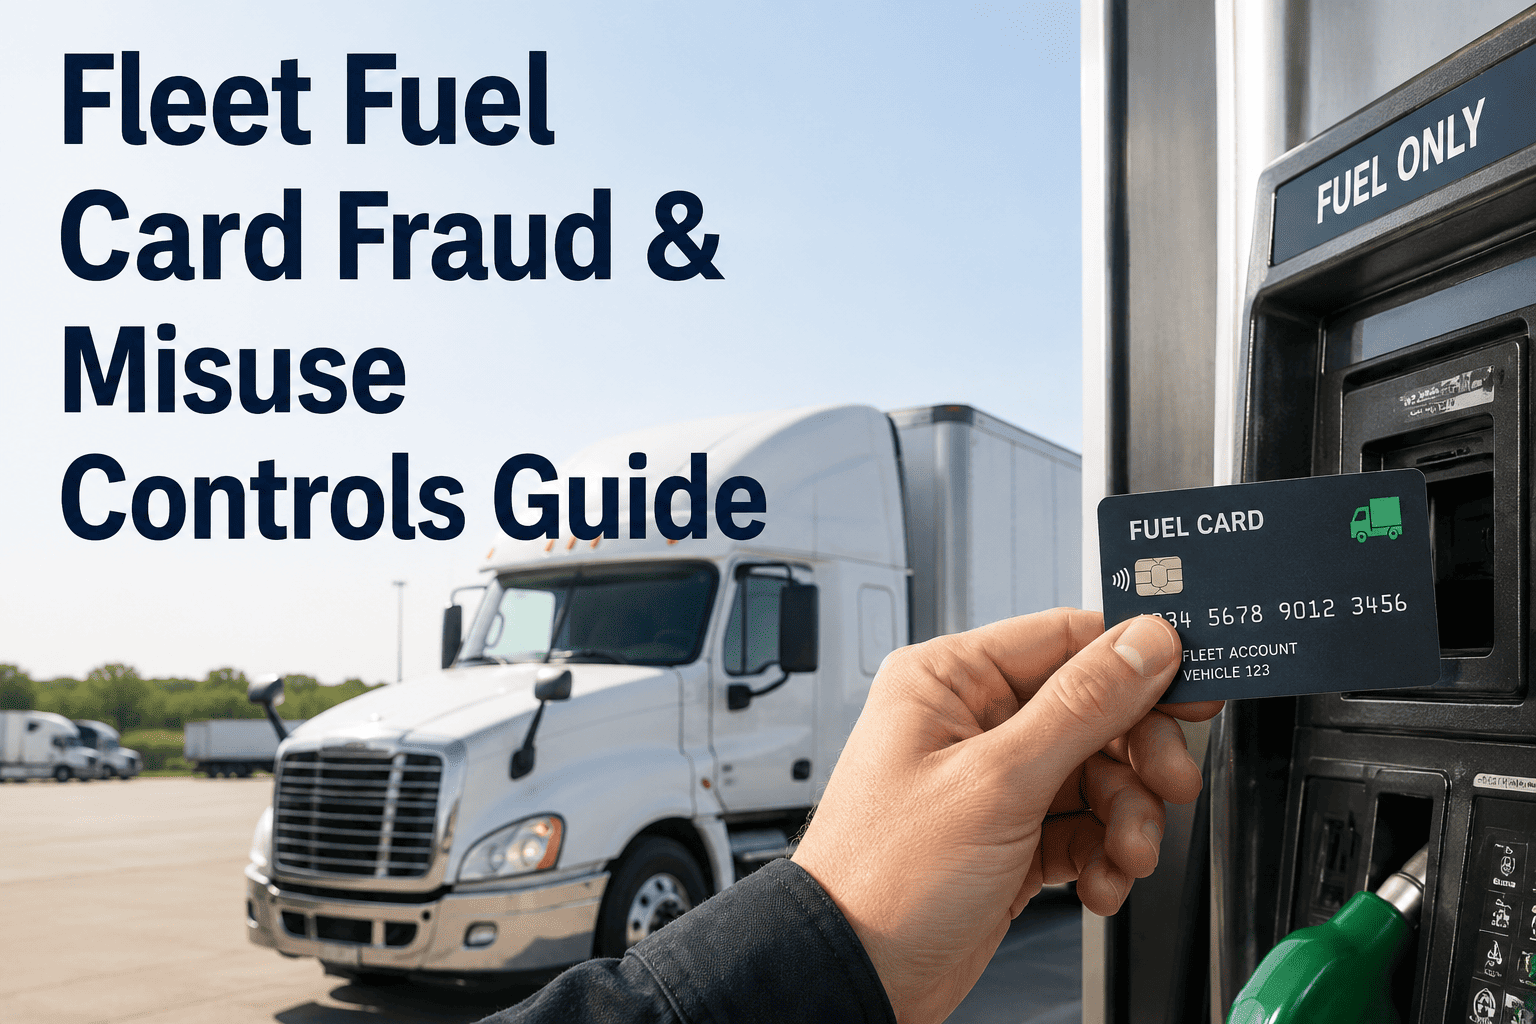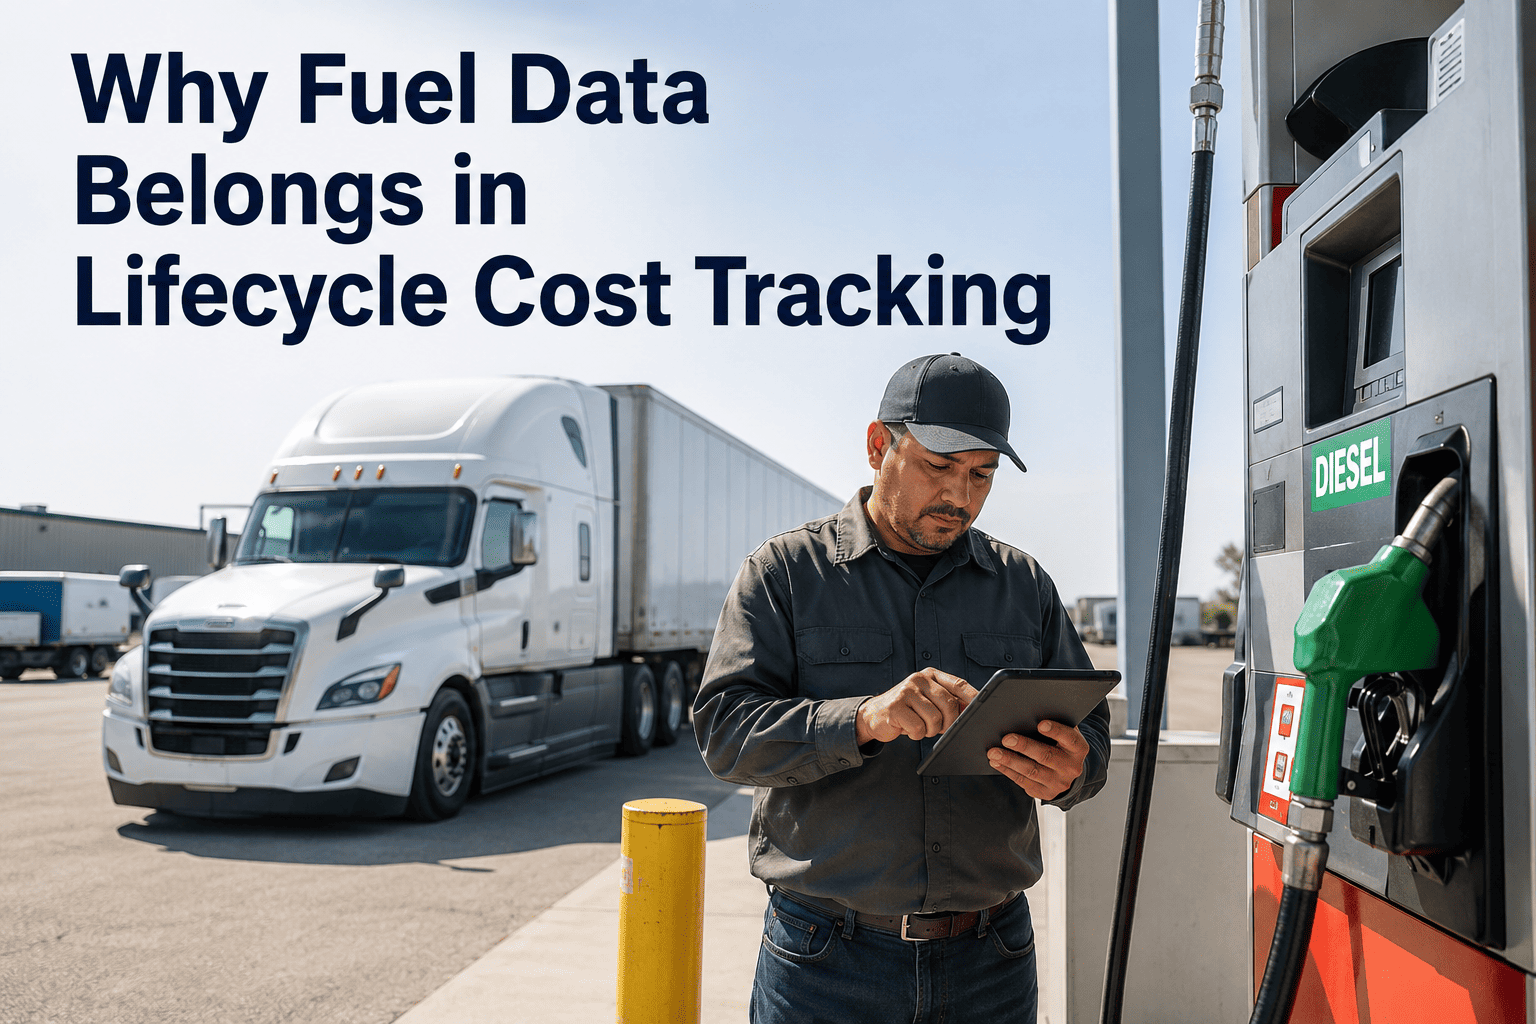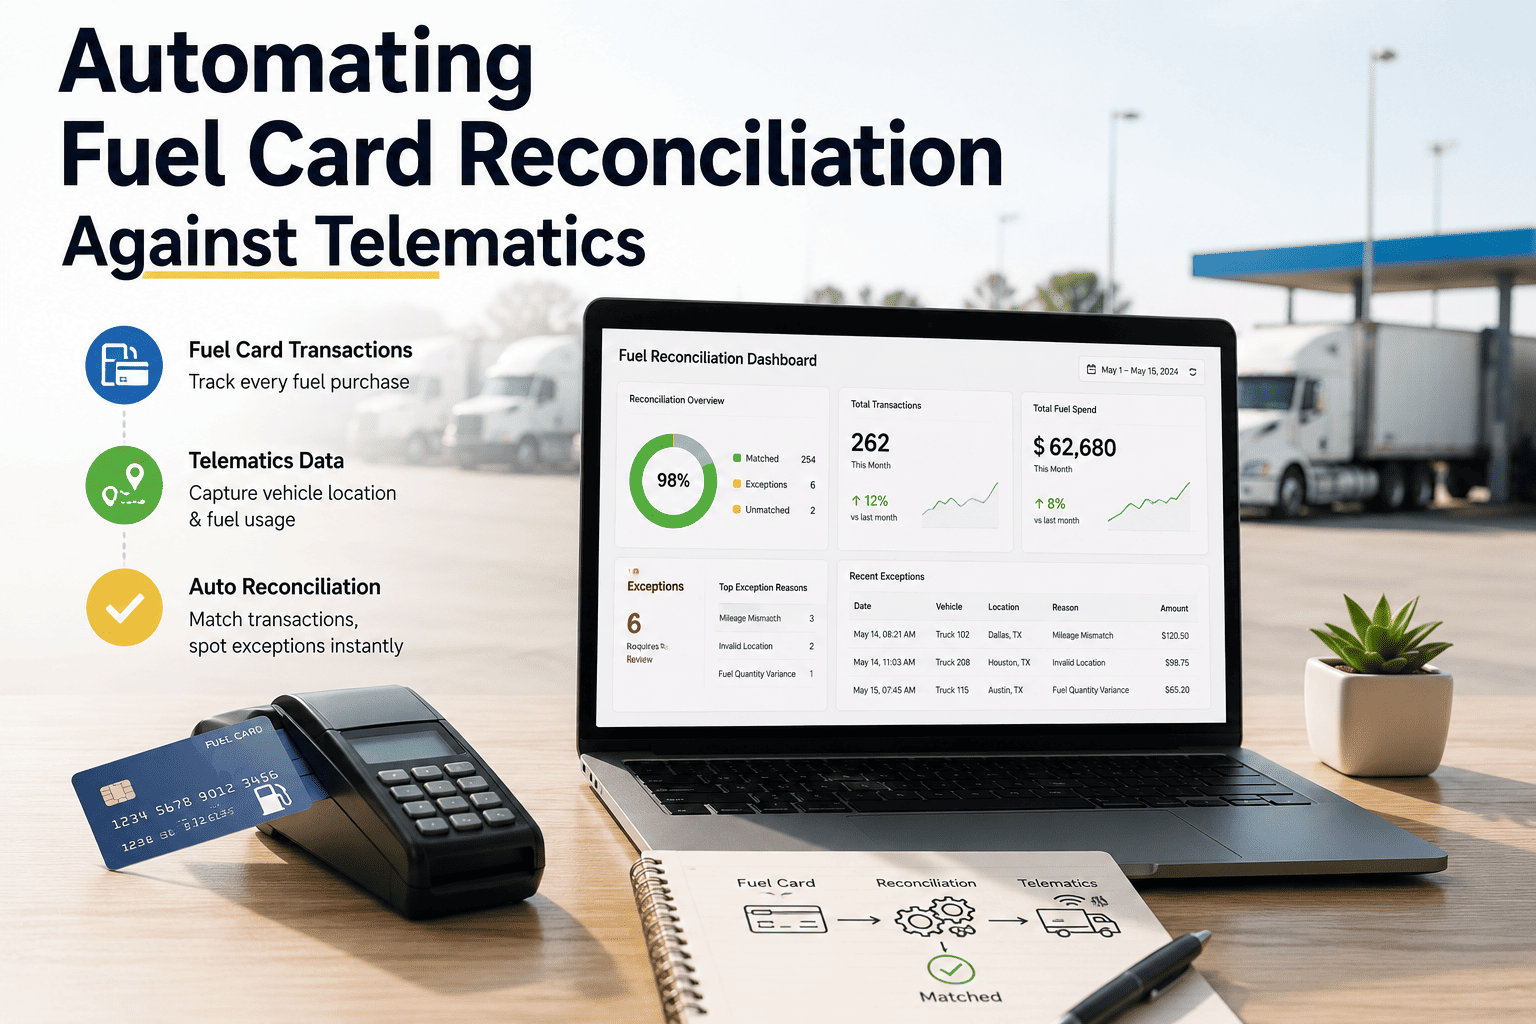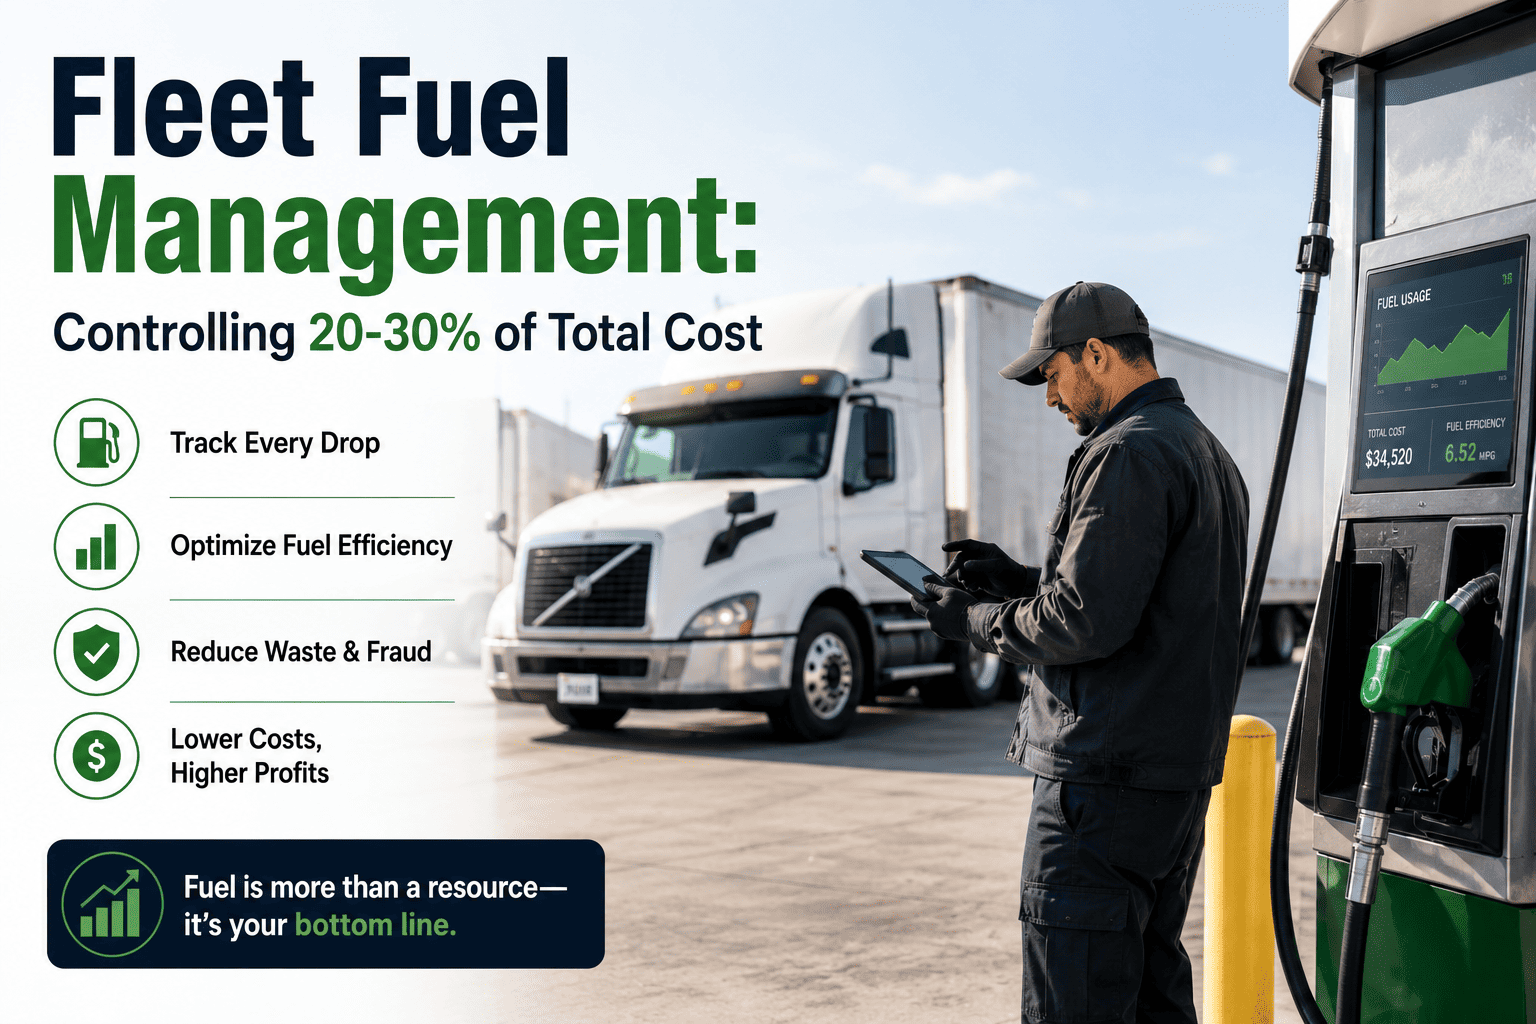
A 60-truck regional dry van fleet was spending $1.2 million a year on diesel without any real visibility into where the money actually went. The fleet manager knew fuel was the single largest line item on the budget, but drivers fueled up wherever was convenient, idle time went untracked, and nobody could explain why identical routes showed a 22% spread in miles per gallon between trucks running the same lane. Over one year, unnecessary idling alone burned through roughly 31,000 gallons, fuel card misuse quietly ate into the budget in ways nobody could quantify, and a handful of routes padded with avoidable detours added thousands of unbilled miles. Fuel already represents 20-30% of total operating cost for most commercial fleets, and every unmonitored gallon compounds that number further every month. When this fleet finally connected telematics data with fuel card transactions in one platform, the leaks became visible within the first billing cycle. If your fleet is still reconciling fuel spend from paper receipts and gut instinct, start a free trial with Oxmaint to see where your gallons are actually going.
Fleet Fuel Management in 2026: Controlling the 20-30% of Your Budget You Can Actually Influence
Fuel is the largest controllable expense on a fleet balance sheet, yet most fleets still manage it with fuel cards, spreadsheets, and hope. This guide breaks down where fuel dollars actually disappear and what a connected fuel management strategy recovers.
Stop Guessing Where Your Fuel Budget Goes
Oxmaint merges telematics, fuel card transactions, and odometer data into one dashboard so every gallon is accounted for, every anomaly is flagged, and every driver's fuel behavior is visible in real time.
Where Fuel Budgets Actually Leak — And Nobody Notices Until the Bill Arrives
Fuel waste is rarely one dramatic event. It builds quietly across five predictable categories, and by the time a fleet manager notices the total spend climbing, the underlying causes are already baked into daily operations. Identifying which leak is draining your budget is the first step before any fix works. See how much of this applies to your fleet by booking a demo and walking through your own fuel data.
Manual Fuel Tracking vs. Connected Fuel Management
Spreadsheets and paper receipts can tell you the total spent on fuel last month. They cannot tell you which truck, which driver, or which behavior is responsible for the overage — and that gap is exactly where the budget disappears every single month.
| Fuel Management Factor | Spreadsheets and Fuel Cards Alone | Oxmaint Connected Tracking |
|---|---|---|
| Idle time visibility | Not tracked unless manually logged by drivers | Automatic engine-hour idle tracking per vehicle and per driver |
| Fraud and misuse detection | Discovered weeks later during audit, if at all | Real-time GPS-verified transaction matching and tank-capacity checks |
| MPG benchmarking by vehicle | Calculated manually, updated monthly at best | Continuous MPG comparison across vehicles, drivers, and routes |
| Maintenance-linked fuel loss | Fuel drop and mechanical issues tracked separately | Declining MPG auto-flagged against maintenance and tire records |
| Route efficiency review | Rarely audited beyond driver complaints | Route deviation alerts tied directly to fuel consumption impact |
| Time to identify a fuel anomaly | Weeks to a full billing cycle | Same day — flagged the moment the transaction posts |
See Fuel Waste and Mechanical Wear in the Same Dashboard
A truck burning more fuel than its peers is often telling you something mechanical before it ever breaks down. Oxmaint connects fuel trends to maintenance history so declining MPG gets diagnosed instead of just noted.
How Oxmaint's Fuel Management Engine Works
Oxmaint pulls fuel card transactions, telematics data, and odometer readings into a single feed, then applies rules that catch waste, fraud, and inefficiency the moment they happen rather than at month-end reconciliation.
What Fleets Recover With Connected Fuel Management
These figures reflect industry benchmarks reported across 2025-2026 fleet operator data, not a guaranteed outcome for every fleet. The actual number depends on fleet size, current fuel discipline, and how quickly drivers adopt coaching feedback. Run the numbers against your own fleet by starting a free trial and comparing month one against your historical fuel spend.
Frequently Asked Questions
What percentage of fleet operating cost does fuel typically represent
How quickly can a fleet expect to see fuel savings after adopting tracking software
Does Oxmaint work with our existing fuel card provider
Can fuel data be linked to our preventive maintenance schedule
Is IFTA and fuel tax reporting included in the platform
Every Gallon Is Either Tracked or It's Lost. Choose Which One.
Connected fuel card matching, idle tracking, driver scorecards, route efficiency analysis, and IFTA automation in one platform that starts showing leaks in your very first billing cycle.